Chapter 8
Assessment of understanding physics: a case study
Faculty of Science
This is the story of a project which looked at some aspects of formal examinations in physics. It was conducted within the School of Physics by members of the Sydney University Physics Research Group, which was set up in 1992 by a group of academics with the aims of contributing to and applying scientific understandings of the processes and practices of learning and teaching physics at university level. The group adopted the view that because physics education has so many discipline-specific characteristics, research in that area is most appropriately done by physicists.
A good deal of educational research looks at what students do, how they learn and what they think, as well as the external influences that affect learning. Our original purpose was to gain some understanding of students’ thinking that would enable us and our colleagues to become more effective teachers. We were thinking in terms of the well-established tradition of research and model-building about misconceptions, alternative conceptions and students’ construction of their own concepts in science (Confrey, 1990; Duit & Treagust, 1998). We chose, as our source of information, answers to an exam question on a topic of some importance in all introductory undergraduate physics courses: gravity and weight.
In choosing that source of data we opened some connections to other flourishing areas of research in higher education: students’ approaches to learning and, in particular, the influences of assessment practices and students’ perceptions of the requirements of assessment (Struyven, Dochy & Janssens, 2005). Part of our project was concerned with the consequences of recycling an exam question, a topic about which we could find nothing specific in the research literature.
Our investigation was originally focused on students’ reasoning and conceptions but as the project progressed we saw a need to concentrate more on what we, the teachers, were doing. Since our raw data were the answers to an exam question, the redirected focus was on what we as academics expect to find and reward in those answers.
The original study: Students’ conceptions and reasoning
The project began in 1998 as an attempt to discover something about the reasoning patterns that students use when they answer a particular kind of exam question requiring a short written answer to a conceptual problem. That style of question had its origins in an introductory course, Physics I (Life Sciences), developed at Sydney University during the 1970s for students majoring in biological sciences and related professions such as medicine. The course was innovative for its time in that it focused on applications and on the conceptual aspects of the subject rather than the traditional heavy emphasis on the mathematical derivations of results. A typical question would ask for explanations of phenomena or a descriptive solution to a problem. Over time the school started using the same style of question as one component of the exams in the more traditional courses for students majoring in physical sciences and related professions such as engineering.
82To illustrate the style, here is the exam question used in our study:
In a spaceship orbiting the earth, an astronaut tries to weigh himself on bathroom scales and finds that the scale indicates a zero reading. However, he is also aware that his mass hasn’t changed since he left the earth. Using physics principles, explain this apparent contradiction.
The question was worth five marks and was allotted 10 minutes writing time in a three-hour exam worth 180 marks. It was included in the first-semester (final) exam for two different first-year courses, a Fundamentals course designed for students with no background in physics at the level of the Higher School Certificate and a Regular course for students who have previously studied the subject. One of us (MS) teaches the Fundamentals course. The original reason for including common questions in the exams for two different but parallel courses was to provide a common benchmark for evaluation and comparison of student performance in the courses. The question was chosen for our study because a good answer requires understanding and integration of the basic concepts of force, mass and acceleration which are part of the core of both the Fundamentals and Regular courses.
At first, our study focused on the kinds of understandings displayed by the students’ answers. To do that a team of three researchers, including an undergraduate student, studied a sample of 100 answers from each of the two classes (200 answers altogether). We based our analysis on phenomenography, a research methodology developed by Marton (1986) and colleagues. The methods of data collection and analysis used in phenomenography are exploratory but the goal is usually to obtain clear descriptions of the data in terms of a set of categories, which is often arranged as a hierarchy. The epistemological stance is that knowledge is subjective and relative and there are no initial assumptions about the nature of the categories which may emerge. Instead of evaluating the answers for the ‘correctness’ of the physics we read them with a view to identifying common patterns of description. The researchers used an iterative process of sorting the answers into groups with common features until they arrived at a consensus about the broadly different categories of answers. Those categories were then described and given labels. Further subcategories were identified, eventually yielding a three-tiered structure.
Most responses contained a comment regarding the existence or absence of gravity in the spaceship. Those comments formed the first or main tier of categories. The second tier (subcategories) contained answers that tried to justify the absence of gravity and/or explain freefall. The third tier (explanation categories) either used the concepts of mass and weight, or contained a discussion of scales and normal force to explain the absence of a scale reading. The final description of the categories, which was obtained in a later part of the study, is shown in Table 8.1, together with the number of answers in each category. Category 3, significant gravity, contains answers which include an explicit statement about a non-zero value of ‘gravity’ as well as many which used such a value without declaring it first. The miscellaneous category 4 contains all the answers which did not fit any of the main categories, 1 to 3. Although many of those answers mentioned the idea of gravity they turned out to be so disparate that we could not find a meaningful label for them. (Categories which are empty in this table emerged in answers from subsequent years.) The process of deriving the categories is described in detail in Sharma, Millar, Smith & Sefton (2004). 83
Table 8.1. Distributions of answers among the revised phenomenographic categories
| Main categories with subcategories and explanation categories | Fundamentals class 1998 | Regular class 1998 | Both classes 1998 | |||
|---|---|---|---|---|---|---|
| 1) | Gravity is zero at the spaceship. This is because: | |||||
| 1.1 | The weight of the astronaut is zero since the scales indicate a zero reading. | 2 | 1 | 3 | ||
| 1.2 | There is no gravity in space or the spaceship is outside the earth’s g field. Described in terms of: | |||||
| a) scales & normal force. | 2 | 7 | 9 | |||
| b) mass & weight. | 42 | 24 | 66 | |||
| 1.3 | The ship is experiencing free fall, equating free fall with gravity = 0. Described in terms of: | |||||
| a) scales & normal force. | 0 | 2 | 2 | |||
| b) mass & weight. | 3 | 2 | 5 | |||
| 1.4 | No reason or other reasons given. Described in terms of: | |||||
| a) scales & normal force. | 1 | 2 | 3 | |||
| b) mass & weight. | 8 | 8 | 16 | |||
| d) neither a nor b. | 2 | 1 | 3 | |||
| 2) | Gravity is approximately equal to zero at the spaceship. Described in terms of: | |||||
| a) Scales & normal force | 3 | 2 | 5 | |||
| b) Mass & weight | 6 | 6 | 12 | |||
| c) Mass & weight & free fall | 0 | 0 | 0 | |||
| 3) | Gravity has a significant value at the spaceship. | |||||
| 3.1 | There is no net acceleration of the spaceship due to cancellation of quantities. | 0 | 5 | 5 | ||
| 3.2 | No mention of free fall … | 0 | 0 | 0 | ||
| 3.3 | The concept of free fall, acceleration at the same rate or falling together used. | |||||
| a) scales & normal reaction or contact force | 13 | 16 | 29 | |||
| b) mass & weight | 0 | 1 | 1 | |||
| d) neither or other reasons | 8 | 10 | 18 | |||
| 3.4 | Astronaut and spaceship are in free fall. Gravity inside the spaceship is zero. | 1 | 1 | 2 | ||
| 4) | Miscellaneous | 9 | 12 | 21 | ||
| Totals | 100 | 100 | 20084 | |||
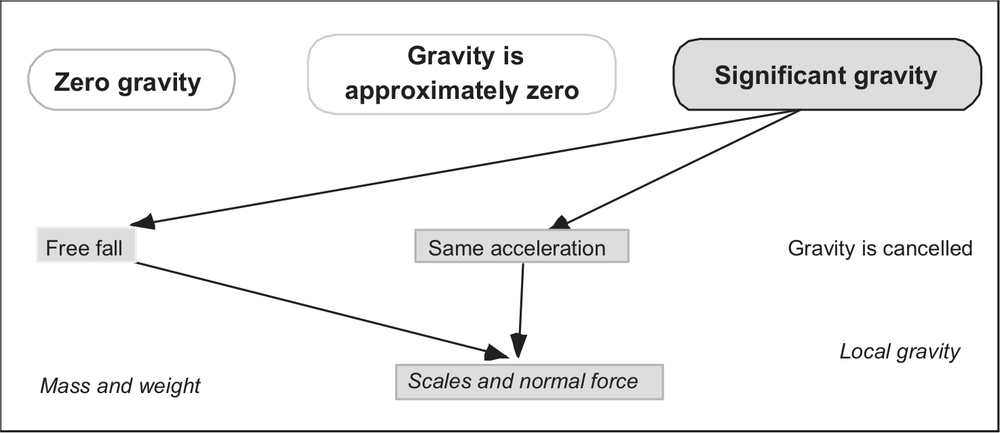
Figure 8.1. A map template for common reasoning paths and categories
As part of our original plan to understand the students’ reasoning patterns we developed various maps in which we plotted all the common levels and details of the descriptions from Table 8.1. Figure 8.1 is an example of a map which represents one kind of answer in category 3.3b, showing not only the student’s main reasoning path but also the territories that were not visited in the answer. We conjecture that this representation of the many possible conceptions and reasoning paths can describe a multitude of examples on the same topic.
Although an inspection of Table 8.1 might suggest that there are more Fundamentals answers in the main category 1 and more Regular answers in category 3, statistical tests (chi-squared) gave no reason to claim any significant difference between the distributions among categories for the two classes. That result was a surprise, so we looked at the exam marks (Figure 8.2). It was no surprise that the experienced Regular students got better marks than the novice Fundamentals students but the marks also showed that the exam question was a tough one for both classes. A chi-squared test on those marks distributions suggests that the chance of getting those differences in marks by accident is about 0.2% – a statistically significant difference. Some details of the examination procedures are relevant here. One lecturer in the Fundamentals course wrote the question, the course director compiled the marking scheme and another lecturer in the Fundamentals course marked all the answers from both classes. Standard practice for marking first year physics papers is to appoint a panel of full-time lecturing staff as markers who gather in the same room during scheduled marking sessions. The work is divided so that all answers to the same question are marked by one person. The aims of that arrangement are to encourage concentration on the task by the markers and consistency of marking within each question, with the hope that variations in standards among markers will be averaged out for each complete paper – a process which is more economical than multiple marking. 85
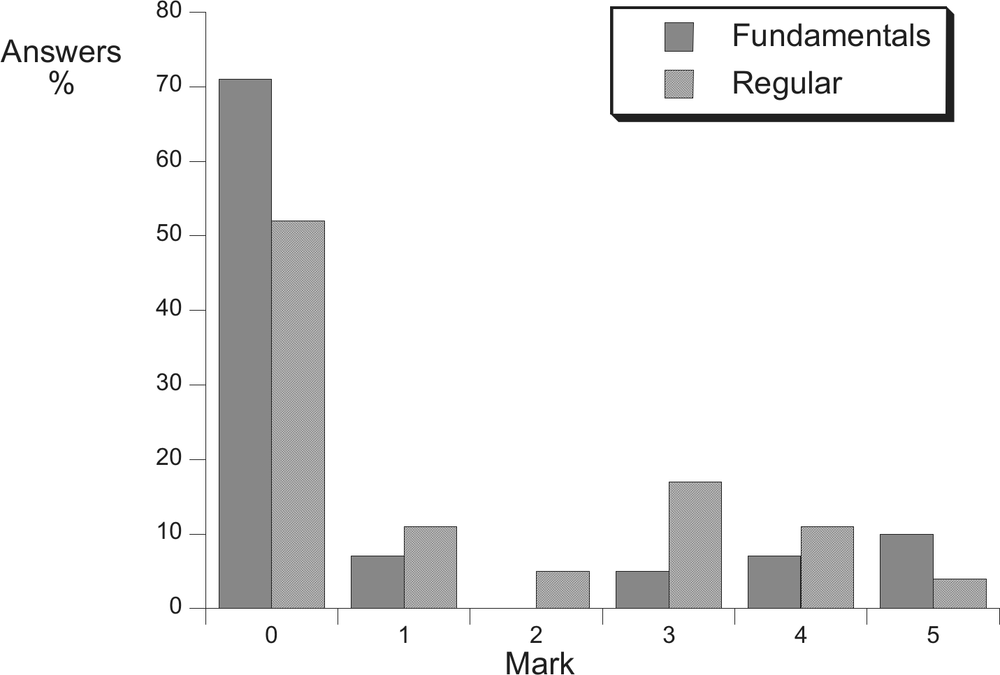
Figure 8.2. Marks for the sample of answers from the two classes, 1998
One point worth noting is that the official marking scheme, which would get a mark of 5, sits clearly in category 3.3a. So, although the original categorisation of the answers ignored the difference between correct and incorrect physics, a physicist can quite easily spot good and bad kinds of answers in Table 8.1. This apparent discrepancy, between the power of our category analysis and that of normal exam marking to distinguish between two different classes of students, leads to several new questions about what actually happens during the marking process, some of which we have followed up. Explicit comparisons of this kind between the power of phenomenographic studies and exam marking to distinguish between groups of students appear to be rare; the only instance that we have found is a study by Dahlgren (1978) of concepts in economics, cited by Gibbs, Morgan & Taylor (1982). First, however, we look at another line of investigation: what happens when a question like the one in this study is repeated in subsequent exams?
Recycling the exam question
We have often heard it said that telling students what is in an exam or repeating old exam questions makes no difference to overall student performance. On the other hand, informal and anecdotal evidence suggested to us that many students do use past exam papers as a guide to study. If that practice is both widespread and effective then one would expect to see some improvement in the answers to recycled questions. To our surprise, a search of the literature failed to turn up any specific research findings on the issue. To test our conjectures we put exactly the same exam question into the Fundamentals exam for another two consecutive years and classified all the answers using the phenomenographic categories from our original study. To help in this work, 86two undergraduate students joined the project. While the answers were being sorted we re-evaluated the categories, which yielded some minor changes. Full details of this part of the project may be found in Sharma et al. (2005).
Note that the particular exam question was not discussed in lectures, practical classes or structured tutorials and no model answer was published. Students were given no advance warning of the content or topics of the exam questions. Any specific knowledge of the question and its acceptable solutions that students may have had before the examination is therefore likely to have been gained by informal means, such as the student grapevine and individual study of past papers which are available in the university library.
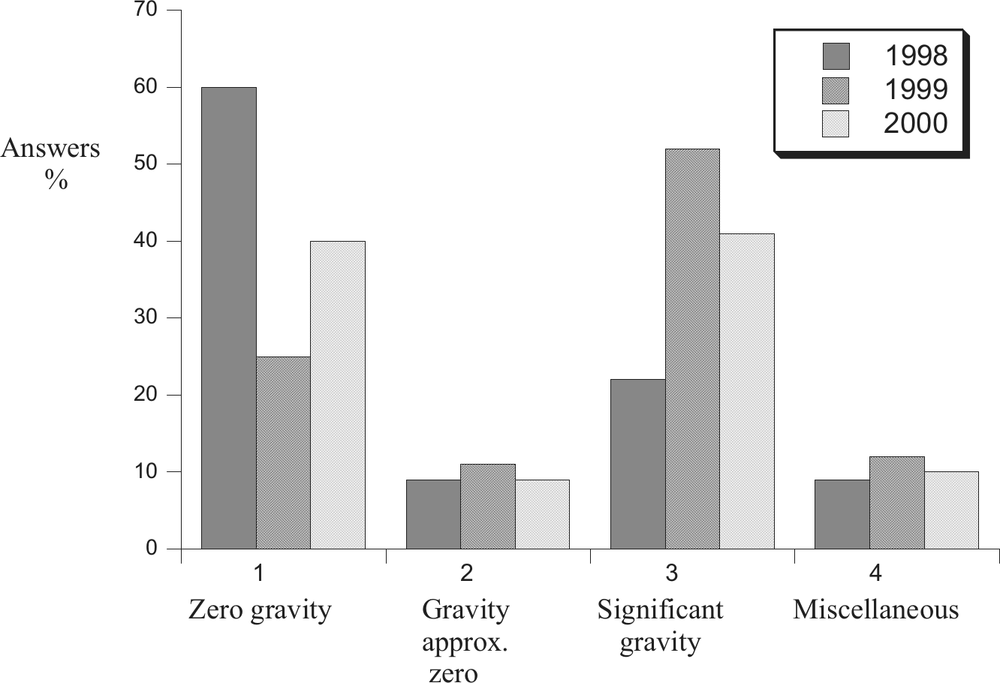
Figure 8.3. Percentage of answers in the main categories for the three years
Figures 8.3 and 8.4 show what happened. In terms of the main categories of answers, there is a shift between 1998 and 1999, from saying that gravity is zero at the spaceship to saying that it is significant. That was followed by a partial shift back, between 1999 and 2000, to the earlier view. We have already noted that the subcategory which is congruent with the accepted ‘correct’ answer is 3.3 in Table 8.1. The popularity of category 3.3 doubled from 1998 to 1999 and almost maintained its new level in 2000. So it would seem that repeating the question did produce better answers the first time it was used, but not subsequently. Could it be that students thought that since the question had been recycled once we wouldn’t do it again? 87
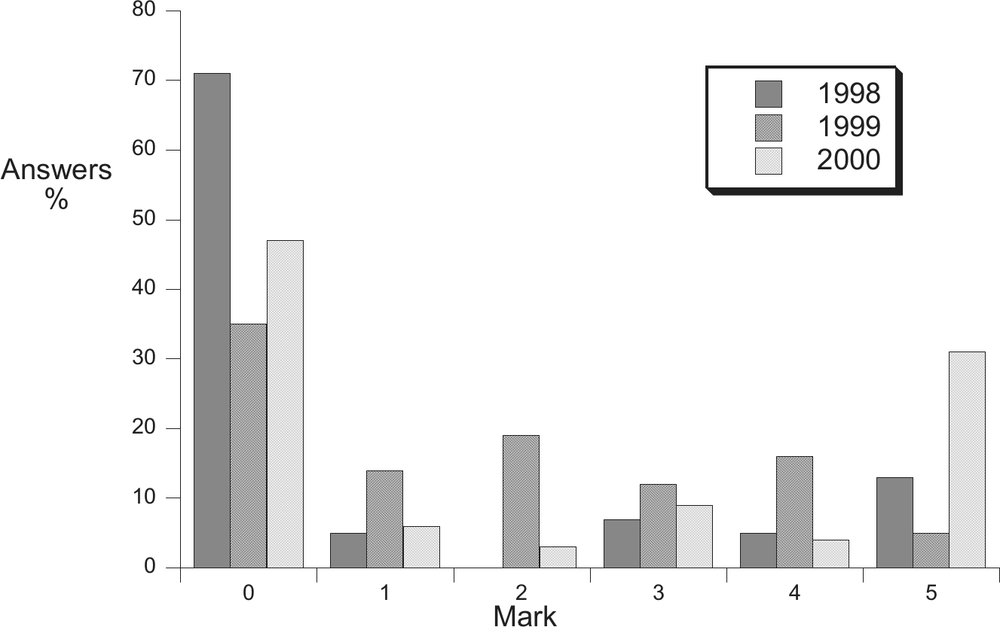
Figure 8.4. Distribution of exam scores over the three years
Although the question was recycled, the marker was not; new markers assessed the 1999 and 2000 exams using their own marking schemes. The differences in the patterns of marks (Figure 8.4), which are all statistically significant, are more startling than would be expected from the evidence of the changes in the categories alone. The shift, from 1998 to 1999, towards the more correct or ‘congruent’ category of answer was accompanied by a decrease in the number of students who got a mark of at least 3 out of 5 (Table 8.2) and an increase in the mean mark. These opposing trends in marks statistics are a consequence of the different patterns of distribution of the marks (Figure 8.4). It is also notable that the official marking schemes were different. Unlike the case in 1998, the markers in 1999 and 2000 generated their own marking schemes which were quite different in character. The scheme for 1999 consisted of an outline for a model answer, suggesting a holistic approach to marking, whereas the scheme used in 2000 was in the more conventional style of allocating marks for pieces of an answer. All three markers had previous experience of marking first year papers. For more details see Sharma et al. (2005). The reasoning patterns and criteria used by markers clearly warrant further investigation.
Table 8.2. Comparison of marks and congruent answers
| 1998 | 1999 | 2000 | |
|---|---|---|---|
| Mean mark ± standard error | 1.07 ± 0.13 | 1.73 ± 0.11 | 2.10 ± 0.14 |
| Students with 3, 4 or 5 marks | 24% | 20% | 35% |
| Answers in the congruent category 3.3 | 22% | 46% | 38%88 |
A new focus: Markers and marking
The realisation that a phenomenographic view of students’ answers and the marks that they get for those answers are poorly correlated – divergent even – redirected the focus of our project to the process of marking itself. Working with another undergraduate student researcher, we embarked on some alternative analyses of our original sample of scripts to see if we could find some characteristics of good and poor answers as seen by the original marker of the 1998 class. Recall that the original study showed that the marker found a much bigger difference between the answers from two classes than that revealed by our phenomenographic categories.
We set up some hypotheses about features of the answers, other than simply being right or wrong, which might influence the mark awarded. We identified two factors that may independently influence the mark: fluency in the jargon of physics (for which we coined the term ‘PhysicsSpeak’) and the use of diagrams. There are some extraneous factors that could influence the outcome of the marking. For example, standard marking practice was to work through the bundle of scripts from each class separately, so that the marker would be unavoidably aware of the class for each student. The first step in a finer analysis of the answers was to type them all, with scanned diagrams where appropriate, into a computer database. In order to study the role of PhysicsSpeak we used computer scripts to identify and tally individual words and phrases, with automatic allowance for incorrect spelling and other trivia. From those tallies we selected items that we recognised as part of PhysicsSpeak and looked for differences in usage of those items between the two classes. Figure 8.5 shows the most popular items – those that were used in more than 20% of all answers, together with some related phrases. The most popular PhysicsSpeak words were the equality symbol and ‘gravity’. Note that the word gravity did not appear in the exam question but it had emerged as a key word in the earlier description of the phenomenographic categories.
We calculated probability values for a chi-squared test to see whether the use of each term by students in the two classes was different. There are only a few significantly different items; p-values of 0.05 or less are marked on the plot. The most significant difference in usage is the numerical part of the value of the quantity known as g at Earth’s surface (9.8), which was about twice as popular with the Fundamentals students but it turns out that numbers have nothing to do with a good answer in this case.
Both groups liked using the abstract noun acceleration but shied away from the verb forms of the same idea, more so the Fundamentals students. Figure 8.5 also shows associations between items of PhysicsSpeak and marks. Now we see clearly that the best marks are associated with the verb ‘accelerate’ and with the concept of free-fall, terms that were used to describe the phenomenographic category 3.3 (table 8.1). We concluded that although there are differences in the use of PhysicsSpeak between the classes they are not sufficient to explain all the differences in marks. We also found a small trend to higher marks for more wordy answers, a trend which was the same for both classes.
The hypothesis that the inclusion of diagrams in an answer is associated with higher marks is supported by the data in Table 8.3. On average, pictures are associated with an advantage of about one mark. Of course this may be saying no more than that diagrams are an important part of a good answer, but we also found that the more experienced Regular students draw more diagrams than their colleagues in the Fundamentals class; 40% of Regular students in our sample included at least one picture compared with only 16% of the Fundamentals sample. 89
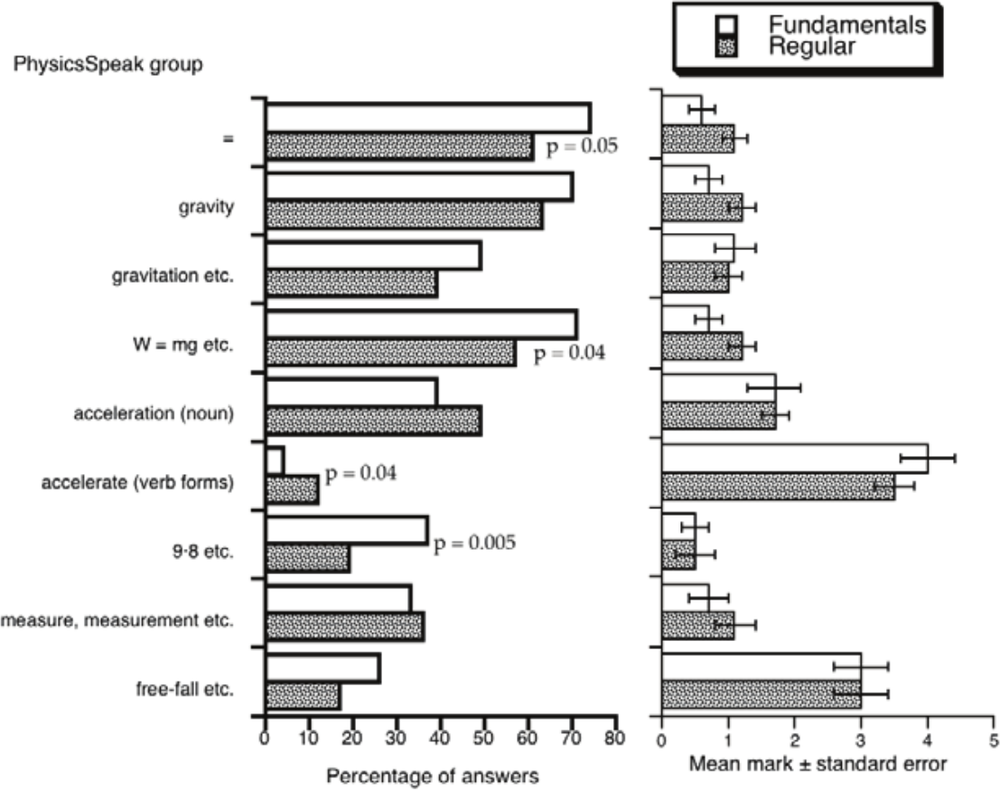
Figure 8.5. Frequency and marks for selected PhysicsSpeak phrases
In looking for other factors which may have contributed to the difference in the marks distributions for the two classes, we scrutinised individual answers for evidence of features that may have produced low marks for Fundamentals students, but could find none.
In summary, we think that we have identified some general features of students’ answers, other than straightforward correctness, that contribute to good marks, but we still do not understand all the reasons why a phenomenographic approach did not produce a strong distinction between the two classes whereas the exam marks did.
Table 8.3. Diagrams and mean marks
| Fundamentals | Regular | Both classes | |
|---|---|---|---|
| Answers with pictures | 1.4 ± 0.5 | 2.0 ± 0.3 | 1.8 ± 0.2 |
| Answers without pictures | 0.9 ± 0.2 | 0.9 ± 0.2 | 0.9 ± 0.2 |
| Totals | 1.0 ± 0.2 | 1.4 ± 0.2 | 1.2 ± 0.1 |
Work in progress
We have data from a recent fourth use of the astronaut question in the exam for the Fundamentals course and, for the first time, the first-year Advanced course. All answers 90from both classes are being analysed using the existing phenomenographically-derived framework. This time we have better control of variables: the scripts were marked by the same person who assessed the 1998 papers and he was given the same marking scheme. Our analysis uses copies of the scripts from the two classes that have been mixed into a random sequence, with all evidence of the mark awarded and the student’s class removed. (Those precautions were not taken in our original study because, at that stage, we were not interested in either the marks or the student’s course.) When the categorisations have been completed we will then look at the marks and repeat our earlier studies on correlations between categories and marks, differences between classes, the use of PhysicsSpeak, the value of diagrams and other features.
Discussion
The apparent discrepancy between our category analysis and exam marking in making comparisons between different classes led us to wonder if our category analysis was missing something. Granted that the phenomenographic approach did not consider correctness, were there some other factors that it missed but nevertheless influenced the exam marker? We have some preliminary evidence that some items in the technical language of physics may be important, independently of correctness, but we need to do more work on that idea. We also have evidence that the use of diagrams in answers helps in getting marks, but that idea needs to be tested in a wider context, using different questions.
The fact that the most common broad category across all three years is the absence of gravity in space reinforces a theme that emerges from the whole body of misconceptions research: most students hold some very robust alternative conceptions, which persist even when teachers confront such supposed misconceptions directly. (Confrey, 1990, pp. 10, 43-44, 46). It does seem, however, that the first repetition of the exam question in 1999 was associated with a considerable shift in conceptual understanding. Exactly how that may have happened we do not know, but if the connection between the recycling and improved understanding is real then we have a new research question: precisely how do students use problems from past exam papers? Do they merely use them as a guide to topics for study, as suggested by Entwistle and Entwistle (2003), or do they actually work through the problems? Our results suggest that there may be a significant number of students who do practice answering the old questions. We advocate a more detailed study of students’ approaches to preparing for physics exams. A study like that needs to be based initially on interviews and surveys with follow-up studies to evaluate the success of the students’ strategies – connecting their exam answers with their study methods.
Finally, although it is clear that there are significant differences in the way that answers across the three years are spread among the phenomenographic categories, it is plausible that part of the variation in the patterns of marks may be attributable to differences in markers and marking practices, not just to differences in students’ answers. That hypothesis raises some research questions which, we think, have not been covered well enough in the literature to date. Although the general problem of inter-marker reliability has been recognised for many years (Cox, 1967; Elton & Johnston, 2004) we believe that there is a need for some deeper studies on the actual, rather than ideal, principles and practices of marking exams, with specific reference to physics. Although it can be argued that there are better ways of assessing learning (Gibbs & Simpson, 2004) we can assume that physics exams will be used for a while 91yet. There is a need to find out what experienced teachers and markers actually do when they evaluate answers to qualitative-reasoning questions like our example of the astronaut’s weight. We need to discover whether there are self-generated principles that guide the behavior of markers and, if those principles do exist, to what extent they match the wisdom of guides to good academic practice such as that by Biggs (1999). Such questions may be answered by collecting information directly from experienced markers about the ways in which they evaluate a variety of selected answers.
Implications for teaching, learning and assessment
Quite apart from the variations in our results, the initial analysis for the classes of 1998 certainly produced insights into students’ conceptions and those insights influenced the members of the project team who were also teachers and examiners of the Fundamentals course. Discussions among the teaching team led to revision of the content of those lectures and workshop tutorials which dealt with concepts of weight, gravity and orbital motion, with particular effort to counteract the idea that there is no gravity out in space. For example, lecturers introduced examples using extra concepts, such as buoyancy and the vacuum, which were explored in relation to the topic of free-fall. On a broader scale, insights from our analysis of reasoning patterns about the exam question was one of the stimuli that led to the development of interactive learning activities in our large lecture classes using classroom quizzes about gravity and other topics. Since our department acquired an electronic classroom response system, those quizzes have become a regular part of our teaching, but the design and content of the quizzes would not have been the same without the understandings gained from this research project. We think that the act of doing research on students’ understanding almost inevitably leads to a more learner-focused approach to teaching.
Analysis of exam answers using the techniques described here can be applied and extended by practicing teachers in many areas of physics and the other sciences. It has potential as a useful tool for understanding students’ thinking, with consequent improvements in teaching and learning. Phenomenography, in particular, can produce complete, organised, summaries of the variety of students’ reasoning about specific important topics. We consider the analysis of assessments to be a more authentic way of capturing variations in students’ conceptions than those studies which ask students to respond to questions designed by an external researcher.
Furthermore, such analyses may be used to inform badly-needed studies of the details of marking practices. An independent value-free set of answer categories may provide a reference framework for evaluating patterns of marks and marking practices. For example a high degree of coherence between categories of answers and marks or a marking scheme might be interpreted as an indicator of validity.
We also suggest that, contrary to received wisdom, the practice of repeating judiciously selected exam questions (such as those requiring reasoning rather than recall of facts) and analysing the consequences can be a tool for monitoring genuine improvements in the amount of learning that takes place within a course, whether those changes are caused by improved teaching or by greater student awareness about important examination topics (Entwistle & Entwistle, 2003).
We plan to continue the project with a view to collecting concrete evidence, of the kind respected by physicists and other scientists, about what actually happens in examinations. One of our ultimate aims is to drive an evidence-based process of change in the way that we, and other science departments, conduct examinations. 92
Acknowledgements
Rosemary Millar collaborated on the phenomenographic analysis. Undergraduate students Martyn Cole, Andrew Smith and Aaron Whymark did much of the phenomenographic analysis as part of their third-year physics projects. Andrew Roberts worked on the project under two summer vacation scholarships for undergraduates. We thank other members of the Sydney University Physics Education Research Group for their comments and useful criticisms.