2
Australian demographic prospects, 2004–2050
Introduction
This chapter focuses on the potential demographic directions for Australia over the next 50 years. It also addresses key social and economic issues related to the transformations taking place in the make-up of Australia’s population. These issues include the ageing of the population, future labour supply and the age structure of the labour force. As with most developed countries of the world, ageing is inevitable in the future direction of the Australian population but, as this chapter demonstrates, changes in demographic pathways may make a significant difference to the extent of future ageing. Given these trends, this should be a key national policy issue for Australia and should be central to economic, social and governmental strategies and considerations. However, despite the Australian Government’s Treasury making reference to ‘the three Ps’ – ‘participation, productivity and population’ – as being key influences in Australia’s economic future, it has tended, in its policy approaches, to emphasise participation and productivity rather than population (Department of Treasury, 2002).
There is a tendency for economists and planners to ignore the ‘third P’, population, because they work on the assumption that future demography is ‘exogenous’ to the economic models upon which planning is based. This effectively means that future demography will not be affected by future economic trends. Instead future demography is extrapolated from trends in past demography and then becomes the ‘front end’ of complex economic planning models. The implicit assumption of this approach is that the economy is expected to adjust to whatever future demography there turns out to be. Population policy in this context becomes an irrelevance. However, concern about 34the lack of a national ageing population policy was emphasised by an Australian Productivity Commission press release announcing its 2005 report ‘Economic Implications of an Ageing Australia’ which stated that, “in the absence of other policy actions to reduce fiscal pressure, taxation levels would need to rise by 21 per cent by 2044–45, or the debt burden of ageing would become twice as large as Australia’s GDP”. The Productivity Commission called for policy responses on a broad front and at all levels of government (2005b).
In contrast to the standard approach of economists, historical analysis of demographic trends shows plainly that demographic behaviour is strongly influenced by the contemporary economic and social situation. For example, in Australia in the early 1930s, the fertility rate fell to a very low level and international immigration was close to zero. A similar situation occurred in the mid-1970s. When the economy is unfavourable, births are delayed and immigration dwindles. When the economy is strong, birth rates rise and new migrants are attracted.
Rather than future estimates of demography being predetermined inevitably and inexorably by past trends in demography, they should be made in consort with envisaged future economic, social and environmental trends. If the Australian economy were to go into steady decline over the next 50 years, we could expect that population growth rates would be much lower than if the economy were to remain strong throughout that period. We cannot predict the timing of economic fluctuations (recessions and booms) but, at least, long-term demographic projections should be consistent with a clearly stated position about broad economic and social futures. Those who wish to assess the accuracy of demographic projections can then evaluate the reliability of this position. This is the basis of an argument for Australia to abandon the notion that its future demography is pre-determined and to evaluate, within the bounds of probability, what demographic futures are likely as an integral component of desired longer-term economic, social and environmental goals.35
The future economic and social setting in Australia
The likely demographic future described in this chapter is based on the assumption that, in broad terms, the Australian economy will be strong across the coming decades. This is both the likely and the desirable future. This outcome is likely because sustained economic development of the two Asian giants, China and India, will underwrite continued economic growth of the Australian economy. The inevitable shift from oil-based energy to other energy forms will also be beneficial to Australia in the global context. Of course, Australia’s continued economic strength is desirable because it will bring improved future living standards for Australians and increased wealth that can be applied to the improvement of environmental, economic and social infrastructure.
In summary the likely domestic implications of this future are:
- Substantial increases in standard of living. The Treasury’s 2002 Intergenerational Report projected a doubling of the living standards of Australians between 2002 and 2040. This was confirmed by the 2005 Productivity Commission report: Economic Implications of an Ageing Australia.
- Major investment in new physical infrastructure. Infrastructure development has been neglected to a large extent in Australia since the 1970s. Massive new investment is required to address environmental degradation including greenhouse gas emissions, water supply, the transformation from an oil-based economy, and transportation and communications inefficiencies. Of course, this would need to be undertaken with a strong regard to short-term fiscal responsibility.
- A considerable demand for labour for the construction of new physical infrastructure, and new demands for service workers arising from increased living standards and the ageing of the population as ageing of Australia’s 36population is inevitable, whatever reasonable assumptions are made about Australia’s future demography.
- Substantial new investment in education and training infrastructure. This will be required to service the needs of the expanding economy and to deal with the rapidity of change in technology. We can comfortably predict that technology changes in the next 50 years will be faster than ever before in human history. The inevitable substantial changes in the way we live our lives, because of global warming, changes in energy forms, advances in water supply and sewerage, transport and communications, will demand highly skilled technological workers. Any country that is lacking in the highly sophisticated skills that will be needed to adapt new technologies to local environments runs the risk of failing to capture its share of global capital investment.
- Changes in social institutions to enhance social cohesion and the capacity for all Australians to share in the increased wealth of the country. Social disharmony is an obvious threat to economic progress. It can be addressed through changes in the structure of the tax-transfer system and through investment in social infrastructures such as health systems, early childhood education and care, community services and aged services. The capacity for workers to combine their work and caring responsibilities across their lifetime will be an important component of this outcome.
Labour supply: the essential integrating component
The essential link between demographic and economic futures is labour supply. The neo-classical economic model sees labour supply largely as an effective (elastic) response to labour demand. Potential workers will contribute more or less of their supply to the labour market depending upon the demand 37signals of the market, especially the level of wages. This model may have been relatively accurate in the past 30 years, but that was a time in which the potential labour supply grew rapidly because of immigration, the labour-force entry of the baby boom generation and the extension of the labour market to include much larger numbers of women. Between 1970 and 2003, the Australian labour force increased by around 85 per cent. On present population and participation trends, the future growth of labour supply will be considerably slower, between 10 and 20 per cent over the next 50 years (McDonald & Kippen, 2001; Productivity Commission, 2005a). Fundamentally, this turnaround in labour potential is the result of the high fertility baby-boom years being succeeded by 30 years of below replacement levels of fertility. Future labour supply is likely to be much less responsive to changes in labour demand than has been the case in the past 30 years.
With low unemployment and projected very slow growth of labour supply, particularly the supply of young technically-skilled workers, future labour supply is likely to be relatively inelastic to demand (giving rise to inflationary pressures) unless longer term planning of labour supply is in place. We cannot increase labour supply now by increasing the birth rate 25 years ago; we cannot increase the supply of workers with a particular skill now by increasing the training intake for that skill five years ago. While Australian immigration policy has been relatively responsive to immediate labour demand, the increasingly competitive international market for skills increases the unreliability of depending solely on short-term immigration policies to address labour shortages.
Without being explicit about precise numbers, a strong growth in labour demand will be an obvious effect of a strong Australian economy over the coming decades. Without a major increase in potential labour supply, Australia will not be able to undertake the massive physical infrastructure projects that it needs to improve the degraded environment, convert to non-oil based energy, improve water supplies and sewerage and eliminate 38transport and communications inefficiencies., Australia will also not be able to provide the number of service workers required by a wealthier and ageing population. Without an emphasis on young skilled workers, Australia will not be able to assimilate new technology as rapidly as needed.
The future of fertility in Australia
Future fertility trends depend upon more than past fertility trends. Five factors will be important for the future:
- Changes in the timing of births (the age of women when they have babies)
- Changes in young people’s values, preferences and assessments of personal risks
- Changes in the characteristics of the population
- Institutional changes (work and family, gender roles)
- Economic trends and assessments by young people of economic risks
Timing
Over a period of about 30 years, first births have been delayed in Australia to ever-later ages. This has occurred mainly through a spread of the distribution of first births across a much wider range of ages than was the case at the end of the 1960s. A sizable proportion of first births still occur under age 25 (28 per cent of women aged 25 in 2001 had had a first birth) and so there remains scope for a continuation of the fall in fertility rates under age 25. This would tend to reduce the annual fertility rate as births are pushed out to some future year. On the other hand, there is recent evidence that women are having first births at a somewhat greater rate at all ages in their thirties. This means that a tendency to delay the first birth well into the thirties among more educated women may be reversing to some extent. This will tend to increase annual fertility as births are brought 39forward in time. Australian data on births by birth order are weak and this makes analysis of future trends very speculative. At best, current trends suggest that the falls in rates under age 25 will be at least balanced by the rises in the early 30s, producing a slight rise in annual fertility rates. Such a rise was already evident in 2005.
Values changes
As yet there is little evidence of a strong change in values amongst Australians towards having no children at all and the dominant value of a preference for two children remains (Weston & Qu, 2004). Data on young people’s assessments of economic or personal risk are not readily available. However, the current long years of good economic times are a positive sign. Skilled labour shortages have also improved the economic outlook of the present generation of potential young parents. Finally, buoyed by the good times that have prevailed across their late teens and 20s, ‘generation Y’ are reputedly risk takers. Thus, from the perspective of values, we might expect Australian fertility to remain at least around its present level of 1.8 births per woman.
Changes in characteristics
In each successive generation, Australian women have become more highly educated and have been employed for a longer period before having their first child. This means that, when making a decision about having a baby, an individual woman’s own human capital is much higher than it was for women in the past in Australia. Higher human capital means greater opportunity cost (lost income) from withdrawing from the labour force for a time. This is the logic that explains the fall in individual fertility as a woman’s human capital level rises. A society-wide trend to higher human capital means that the aggregate level of fertility would also be expected to fall. This situation can be altered through strong government and private employer support, such as child care and generous parental 40leave provisions, for the combination of work and family. For example, in Nordic countries today where such work-family supports are very evident, the differences in fertility rates by education level of women have disappeared (Kravdal, 2001). Indeed, in these countries, the more highly educated women are beginning to have more children than their lesser-educated counterparts because their family income levels are higher. In Australia, however, the work-family balance remains problematic, and we could not expect the Nordic situation to arise in the near future. Also, Australian women are more likely than their Nordic counterparts, to want to work on a part-time basis, and the opportunities exist to do so. The new industrial relations arrangements could reduce the differences in fertility between Australian women because they are likely to have a greater effect upon women in jobs requiring a lower level of human capital than upon other women. All in all, these changes are likely to be a dampener on future Australian fertility.
There are other characteristics that potentially alter the course of fertility, such as ethnicity, religion and urban-rural residence. Overall, however, while these characteristics are associated with fertility, there seems to be a balance between their positive and negative effects on fertility. Thus, their impact can be largely ignored.
Institutional changes
In this discussion, institutional changes refer to the ways that society is organised that enhance or reduce the capacity of individuals to have children. The present Australian Government has demonstrated strong policy support of families by greatly increasing the level of government financial benefits received by those who have children (Howard, 2006). The new Maternity Payment is an outstanding example. There have also been gradual changes in the availability of child-care although child-care reform is the main type of institutional reform presently required in Australia in dealing with the work-family balance problem. Finally, workplace arrangements have shifted 41over the past 30 years in ways that are very favourable to the combination of work and family. Changes here include the ready-availability of part-time work in most jobs, flexible working hours, family leave, paid maternity leave (for about 40 per cent of the work force) and unpaid parental leave. The relatively high level of minimum wages has also played a role in enabling partnered women to work part-time but still earn sufficient income to meet the family needs. There is little question, however, that institutional changes have had a positive effect on Australian fertility in recent years. As mentioned above, the new industrial relations arrangements could reverse this favourable trend, but this is as yet unclear. There is also an argument that institutional changes have a greater effect because they change the psychology of childbearing; such changes provide to young people confidence that the social contribution of having children is valued.
The economic cycle
It is a lesson of history that a downturn in the economic cycle will reduce fertility rates. Until recently, economic cycles themselves have been taken for granted – what goes up must come down. However, in very recent years, some economists have questioned whether the amplitudes of these cycles will be as large as they have been in the past – on the grounds that we are now better able to manage the economy than we used to be. I am not so confident that a large crash is off the agenda, but I am confident that our capacity for avoiding it has increased. Accordingly, for long-term fertility projections, the best assumption that we can make is that economic circumstances will continue to improve. This is consistent with the projections of future living standards made in two significant recent government reports, the Treasury’s Intergenerational Report (2002) and the Productivity Commission’s Economic Implications of an Ageing Australia (2005a). Both of these reports estimate that living standards in Australia will be almost double their present levels in 40 years’ time. 42
In summary, it is expected that fertility in Australia will not fall to the very low levels now prevailing in many European and East Asian countries. The more likely outcome is that in the future the fertility rate will remain around an average of about 1.8 births per woman. Note that this has been the average, with only minor fluctuations, for the past 30 years. Barring an immediate economic downturn, I expect a rise in Australian fertility in the short term.
The future of mortality in Australia
Mortality in the future will be related to our capacity to control causes of death through both curative and preventative measures. This in turn will be related to changes in aspects of lifestyle (smoking, alcohol consumption, diet, exercise, etc) and to advances in medicine. As death rates in Australia continue to be strongly related to economic circumstances, the future state of the economy and the distribution of its successes or failures will also play a role.
Over the past 30 years, life expectancy in Australia has been rising at the rates of around three years per decade for men and 2.5 years per decade for women. Similar trends have been observed in other advanced countries. There is hot debate among demographers as to whether this rate of improvement will continue into the future indefinitely or whether it will slow down. The argument that it will slow down is based on the notion that most of the potential for future falls in mortality is at the oldest ages, say, 80 years and over. A life saved at these ages adds much less life expectancy of life at birth than a life saved at age 60. Furthermore, it is argued that, as each cause of death is brought under increasing degrees of control, it becomes harder to make the next improvement because avoidance or cures for remaining diseases are more intractable. On the other hand, it has been argued that expectation of life has been improving at an approximately linear rate for some 200 years and there is little reason to expect that this trend cannot continue. The weight of opinion among Australian demographers is that the 43future is likely to look like the past: that is, the rate of improvement in life expectancy over the past three decades is likely to continue into the future (Booth & Tickle, 2004). This implies that official government projections (‘the medium variant’) greatly underestimate future expectation of life: life expectancy for women in 2050 is more likely to be 95 years than 88 years. The effect, about seven percentage points added to the proportion aged 65+ by 2099, will be felt largely beyond 2040.
Future migration levels
As argued above, so long as the Australian economy continues to be strong, the demand for labour is very likely to exceed its supply based on present levels of immigration. New demand for service workers including retail workers will be driven by increases in living standards and the ageing of the population. The building of new infrastructure will be very demanding of engineers and skilled trade workers. Similar workers will be required by the expanding mining industry. In a multiplicative way, the larger population will generate higher housing demand, resulting in higher demand for construction workers. All of these changes in turn will create demand for managers, accountants, computer programmers and so on. While Australia needs to focus on training Australian residents across all of these required skills, inevitably – as has been the case in Australia since the Second World War – high levels of immigration will be required to meet the demand. Canada, a country most similar to Australia in terms of migration policy and settlement patterns, has recently announced that it intends to increase its immigration intake to 300,000 per annum within five years (Beach et al, 2003).
The Australian Government reacted to these developments by increasing the size of its skilled migration program to its highest level ever in 2005-06 (98,000) and it has recently announced that the target will remain at that high level in 2006-07 (Department of Immigration 2006). The intake in the ‘family’ category was also increased in 2006 to 46,000. Thus, with the inclusion of the 44refugee and humanitarian intake, the total permanent migration program now numbers almost 160,000 per annum. On top of this, the number of temporary immigrants in Australia, most of whom have the right to work, has increased dramatically. Working holiday makers now number 104,000 per annum.
At the same time, young skilled Australians are being attracted to overseas countries at an increasing rate. Permanent departures from Australia have doubled from around 30,000 per annum a decade ago to 60,000 in 2005. The majority of immigrants are young Australians rather than former immigrants. Many are highly skilled. Most go to the United States and the United Kingdom. There is now a global labour market for skilled workers and the competition for them between countries and companies will become increasingly intense in the future. Nevertheless, Australia is heavily engaged in developing new approaches to the recruitment of skilled immigrants. As a result, it is expected that Australian will be able to recruit the immigrants it needs. Hence, for the reasons outlined above, it is anticipated that Australia’s annual net immigration over the next 50 years will average out at about 50 per cent higher than its recent levels – that is, about 150,000 per annum. In a population projection, this could be implemented by increasing the level of annual net immigration by 2000 per annum every year for the next 50 years.
Three indicative projections of Australia’s population
Based on the above discussion, three indicative projections of Australia’s population are given below:
The Base Projection
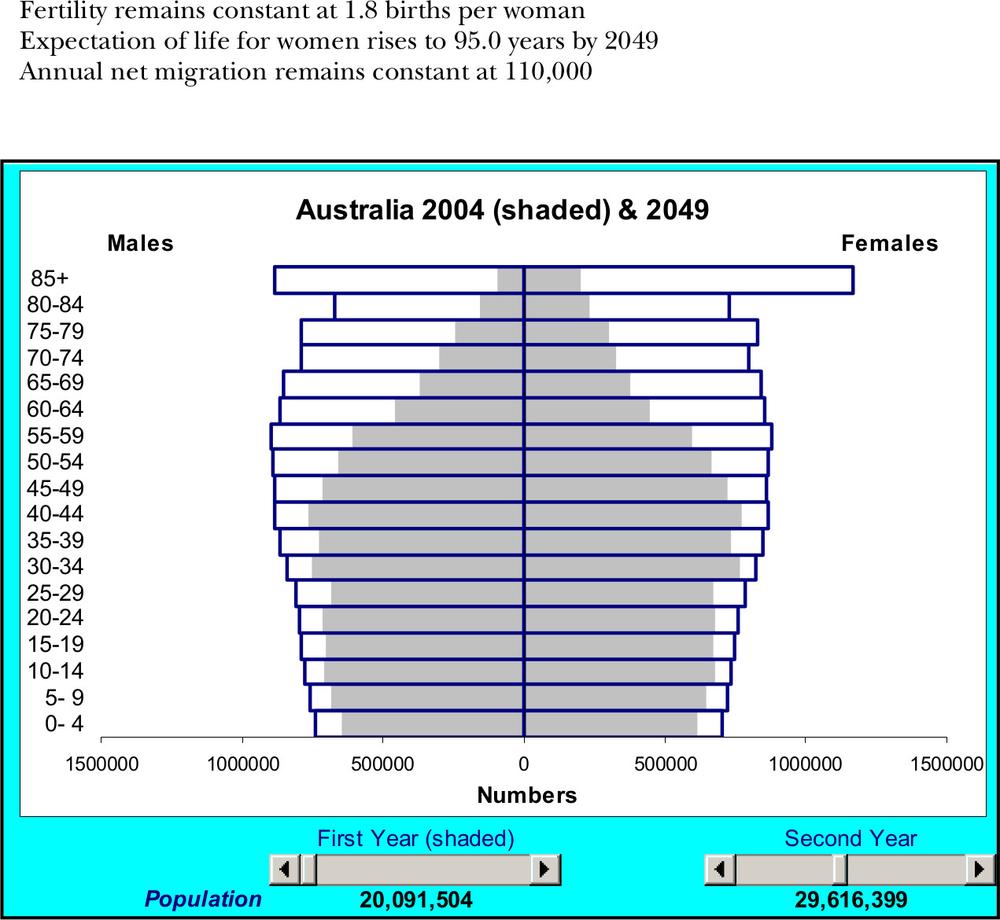
In this projection, the Australian fertility rate is assumed to remain constant, on average, at 1.8 births per woman from 2005 to 2049. Life expectancy is projected to rise on a roughly linear basis throughout the period and reach 95.0 years for women in 2049. Finally, annual net immigration is assumed to remain flat 45at its present level of around 110,000. The age distribution of immigrants and emigrants is assumed to remain unchanged. Under these assumptions, the total population of Australia would increase from 20.1 million in 2004 to 29.6 million in 2049. The age distribution of the projected population is compared with the 2004 age distribution in Figure 2.1.
Figure 2.1. The Base Projection
46
The Low Projection
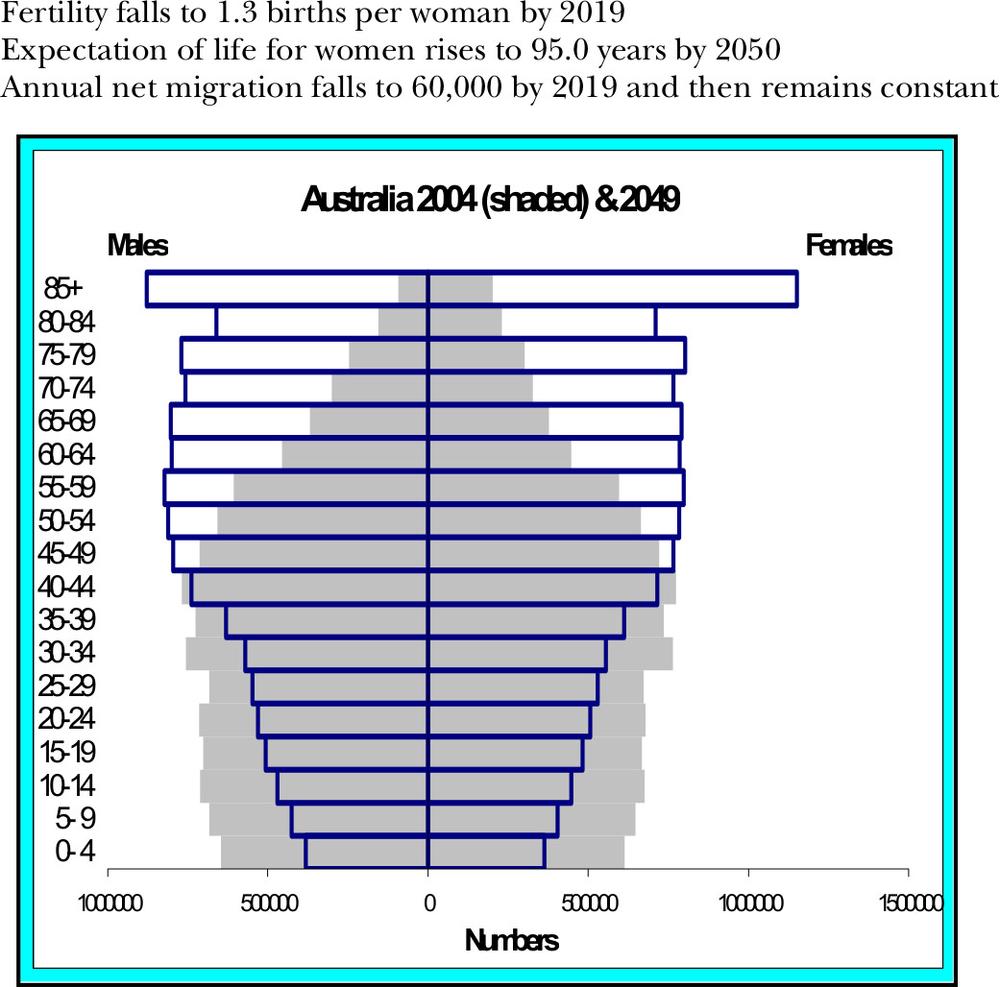
In this projection, the Australian fertility rate is assumed to fall to 1.3 births per woman from 2005 to 2019 and to remain constant at 1.3 thereafter. This is a scenario that reflects the very low fertility rate now evident in many European and East Asian countries. Life expectancy is projected to rise on a roughly linear basis throughout the period and reach 95.0 years for women in 2049. Finally, annual net migration is assumed to remain flat at its present level of around 110,000. The age distribution of immigrants and emigrants is assumed to remain unchanged. Under these assumptions, the total population of Australia would increase from 20.1 million in 2004 to 23.9 million in 2049. The age distribution of the projected population is compared with the 2004 age distribution in Figure 2.2.
Figure 2.2. The Low Projection
47
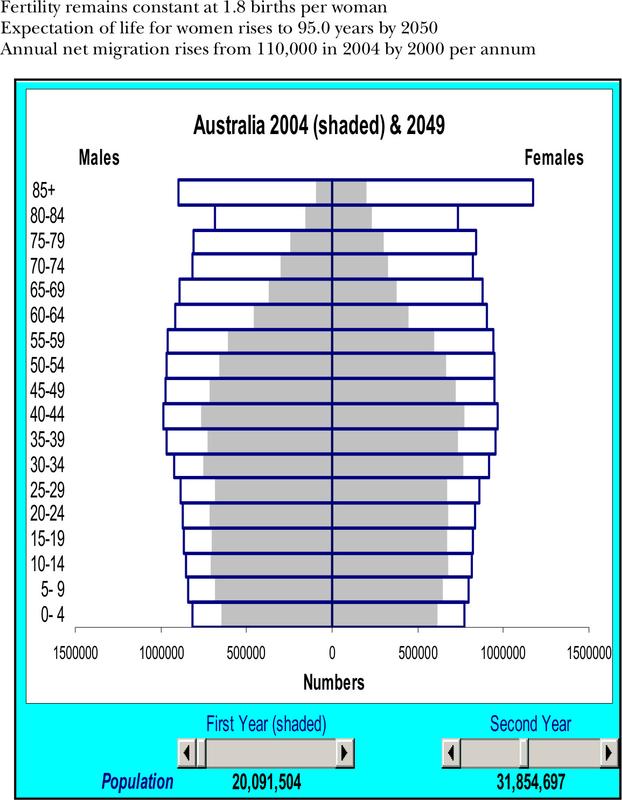
Figure 2.3. The High Projection
The High Projection
In this projection, the Australian fertility rate is assumed to remain constant, on average, at 1.8 births per woman from 2005 to 2049. Expectation of life is projected to rise on a roughly 48linear basis throughout the period and reach 95.0 years for women in 2049. Finally, annual net migration is assumed, on average, to increase by 2000 per annum from an initial level of 110,000. The age distribution of immigrants and emigrants is assumed to remain unchanged. Under these assumptions, the total population of Australia would increase from 20.1 million in 2004 to 31.9 million in 2049. The age distribution of the projected population is compared with the 2004 age distribution in Figure 2.1 previous.
Under the Base Projection, the numbers in each age group in 2049 would be a little higher than they were in 2004 up to about age 50. Above age 50, the numbers in 2049 would increase gradually as age increases to become considerably larger at the oldest ages than they were in 2004. Under the Low Projection, the numbers in each age group by 2049 would be much lower than in 2004 at the young ages, but would become roughly the same as in 2004 by about age 50. Thereafter, the numbers at older ages follow the same path as the Base Projection with increasingly greater numbers at older ages as age increases. Finally, under the High Projection, the result would be rather similar to that of the Base Projection, except that the numbers at the younger ages (under age 50) would be somewhat larger at each age than was the case for the Base Projection.
Table 2.1, following, shows the results from the three projections for two important demographic indicators. The first shows a period of the increase in the numbers over 45 years in the important workforce ages, 25–39 years. These ages are important because they are the ages when the acquisition of the latest high technology skills is at their highest. In the Base Projection, the numbers increase by 14.7 per cent compared with 26.9 per cent for the High Projection. For comparative purposes, note that in the 45 years leading up to 2004, the numbers in this age group increased by 102 per cent. Thus, each of these two projections involves a massive fall in the labour force growth to which the Australian economy has become accustomed. It is for this reason, in combination with the arguments above about future 49demand for labour, that the High Projection is considered the most likely outcome for Australia. Comparing the Base and High Projections on the second indicator, 28.2 per cent of the population would be aged 65 years and over in 2049 while the percentage would be a little lower at 26.9 per cent for the High Projection.
Table 2.1. Two demographic indicators from the indicative projections
| Projection | % increase in population aged 25–39, 2004 to 2049 | % of population aged 65 and over in 2049 |
| Base | 14.7 | 28.2 |
| Low | -20.5 | 32.2 |
| High | 26.9 | 26.9 |
In contrast to the Base and the High Projections, the results of the Low Projection are dismal: a 20.5 per cent fall in the number at ages 25–39, and 32.2 per cent of the population aged 65 years and over by 2049. These are the kinds of outcomes that many countries in Europe and East Asia are now actively trying to avoid. For Australia, such population outcomes would be associated with poor economic outcomes as people reduced their fertility in response to poor economic conditions and as the number of immigrants fell and the number of emigrants rose. The Low Projection is clearly an undesirable scenario for the future
50
References
Beach C, Green A and Reitz J eds., 2003. Introduction. In Canadian Immigration Policy for the 21st Century. Kingston, Ontario: John Deutsch Institute, Queens’ University.
Booth H and Tickle L, 2004. Beyond three score years and ten: prospects for longevity in Australia. People and Place, 12 (1), pp 15–27.
Department of Immigration 2006. Fact Sheet 20. Canberra: Commonwealth of Australia.
http://www.immi.gov.au/media/fact-sheets/20planning.htm
Department of Treasury, 2002. Budget Paper No 5: Intergenerational Report 2002–03. Canberra: Commonwealth of Australia.
Howard J, 2006. Transcript of the Prime Minister The Honourable John Howard Address to the Menzies Research Centre, Theatrette, Parliament House, 18 April 2006. Available from: http://www.pm.gov.au/media/index.cfm?type=2 [accessed 20 April 2006].
Kravdal O, 2001. The High Fertility of College Educated Women in Norway: An Artefact of the Separate Modelling of Each Parity Transition. Demographic Research, 5 (Article 6), pp 187–216.
McDonald P and Kippen R, 2001. Labour Supply Prospects in 16 Developed Countries, 2000–2050. Population and Development Review, 27 (1), pp 132.
Productivity Commission, 2005a. Economic Implications of an Ageing Australia. Canberra: Productivity Commission.
Productivity Commission, 2005b. Long Term Ageing is Today¹s Policy Challenge. Media Release, 14 April 2005. Canberra: Productivity Commission. Available from: http://www.pc.gov.au/study/ageing/finalreport/mediarelease.html [Accessed 14 August 2007] 51
Productivity Commission, 1999. Policy Implications of the Ageing of Australia¹s Population Conference. Conference Proceedings, Canberra: Productivity Commission. Available from: http://www.pc.gov.au/research/confproc/ageing/index.html [accessed 14 August 2007].
Weston R and Qu L, 2004. Dashed hopes? Fertility aspirations and expectations compared. Family Matters, 69 (Spring/Summer), pp 1017.