Chapter 2
METRICS OF ENVIRONMENTAL SUSTAINABILITY, SOCIAL EQUITY AND ECONOMIC EFFICIENCY FOR EMPLOYMENT LOCATION AND COMMUTING
A definition of a sustainable urban transport and land use system that is supported by decision makers is one that provides access to goods and services in an efficient way for all inhabitants of an urban area, protects the environment, cultural heritage and ecosystems for the present generation, and does not endanger the opportunities for future generations to reach at least the same welfare level as those living now (May et al., 2001: p. 12). Objectives for sustainability include economic efficiency, protection of the environment, and equity and social inclusion.
The scope of this chapter is employment location and commuting for the journey-to-work travel from origins in the outer western suburbs of Sydney to all other destinations, and journey to home from major employment centres such as Parramatta. The equity aspect of urban development, as measured by accessibility to land uses, has been a long-standing research theme of one of the authors (Black, 1975, 1977, 1979, 1992; Black and Conroy, 1977). However, in this chapter we have formulated a model of accessibility and sustainability that is introduced for the first time for comment and critique. Before presenting the results of the metrics, we outline NSW Government initiatives with decentralised employment location in metropolitan Sydney since 1948. This is followed by an evaluation of the outcomes of metropolitan employment location policy that aims to promote more equitable and sustainable regional outcomes.
An international collaborative research project on polycentric employment formation and its transport implications in member countries of the East Asian Society for Transportation Studies (EASTS) that includes Australia applied analytical methods that were first tested for robustness and relevance with a case study of Istanbul (Alpkokin et 28al., 2008). The outcomes expected from this comparative study of 11 Asian and Australian cities include a better understanding of the dynamics of decentralisation of employment, multi-centric formations and associated commuting patterns (Alpkokin et al., 2007). The study would further illuminate policy making on socially, environmentally and economically sustainable urban development (Black, 2006), including land use policies that encourage employment creation in the right places, and the role of public transport serving those centres (Klug et al., 2007).
A Sydney case study (Black et al., 2007) not only applied a common, collaborative methodology, but also stimulated us to introduce innovation with the definition of additional metrics (Doust, 2008). Metrics and indicators are used by planners to describe the direction of social, economic or natural conditions in a metropolitan system. Metrics differ from indicators in that they are measures of performance rather than judgements of performance (Blakely et al., 2006). The topic of employment generation and its urban location is a key issue. Interviews with stakeholders (elected politicians, city government employees, private sector infrastructure providers, and community leaders) in the largest global cities of the world found that 81% of stakeholders cited the economy and employment as the most important issue driving decision-making (Lofthouse, n.d.: p. 6) and that transport was the most serious challenge facing the city’s infrastructure (Lofthouse, n.d.: p. 21). The metrics we have developed are based on the three pillars of sustainability: environmental sustainability, social equity, and economic efficiency. Analysis is undertaken for small geographical areas (traffic zones) that entail measurements of accessibility to jobs from residential areas, accessibility from major employment centres to the labour force, and greenhouse gas emissions from motor vehicles in the journey to and from work (plus the embodied greenhouse gas emissions from road construction and maintenance).
Metropolitan employment location policy
There have been strategies in Sydney for the suburbanisation of employment (see Figure 7) into centres since its first spatial plan received the Royal Assent in 1951. The County of Cumberland Planning Scheme was dubbed ‘Sydney’s great experiment’ by Winston (1957: p. 42), who wrote of the transport problems of centralised employment: 29‘The greatest part of Sydney’s traffic problem therefore consists in the movement of workers over comparatively long distances from their homes in the suburbs to and from the centre of Sydney’.
Figure 7: Spatial plans for metropolitan Sydney, 1948–2005
| Plan | Published | Base Population |
Forecast Population |
| County of Cumberland Planning Scheme | 1948 | 1,702,000 (1947) |
2,297,000 (1980) |
| Sydney Regional Outline Plan | 1968 | 2,500,000 (1966) |
4,750,000 (2000) |
| Sydney into its Third Century | 1988 | 3,364,858 (1986) |
4,467,500 (2011) |
| City of Cities: A Plan for Sydney’s Future | 2005 | 3,825,000 (2005) |
5,000,000 (2031) |
When endorsing the decentralised employment strategy of this plan, the Sydney Region Outline Plan (State Planning Authority, 1968: p. 17) confirmed the biggest single urban problem was ‘the great and increasing concentration of employment in the metropolitan city centre’.
Major employment nodes in the suburbs have been key characteristics of all spatial and strategic plans. (For details of the first three plans, see Spearritt and DeMarco, 1988: pp. 55–57). The current metropolitan plan – City of Cities: A Plan for Sydney’s Future (2005) – is a whole of government document endorsed by the Cabinet (NSW Government, 2005). It envisages five major ‘harbour and river’ cities, 10 specialised centres plus 11 major centres with employment by the year 2031. The cities designated as major centres are: the CBD, North Sydney, Parramatta, Penrith and Liverpool.
The Metropolitan Strategy is significant because it embodies real and significant policy decisions by the government, including the implementation mechanisms to translate the Plan with 231 actions that are intended to meet sustainability targets for social, economic and physical land uses. These mechanisms include the Metropolitan CEO’s 30group and the linkage between the Metropolitan Strategy, the State Infrastructure Strategy and the State Budget process. It is a whole of government strategy, adopted by cabinet as the planning and development framework for the next 25 years.
The Employment Lands Task Force looks at policy, demand for and supply of land, analysing trends across industry sectors, and reports annually to ministers. The NSW Government Centre’s Policy aims to:
- Establish employment capacity targets for strategic centres.
- Cluster business and knowledge-based activities in strategic centres.
- Establish a Stronger Centres Initiative and strengthen management.
- Use government assets and investment to support centres.
- Ensure sufficient sites for commercial offices in strategic centres.
- Concentrate activities near public transport.
- Support centres with transport infrastructure and services.
- Protect and strengthen the primary role of economic corridors.
Evaluation of metropolitan employment location policy
The current NSW Government believes that the centres policy has been successful. According to the government, centres policies have reduced pressure on central Sydney, created a second CBD at Parramatta, upgraded the public transport network serving those centres, and concentrated major retail developments in subregional centres. As noted by Bob Meyer in an article outlining the success of the centres policy in the Sydney Morning Herald (2nd November, 2007), concentration of employment in centres served by rail encourages a greater use of public transport and will serve the future metropolitan region in a more sustainable way. Intuitively, this is a highly defensible strategy to overcome the well-articulated problems of suburban sprawl and car-dependency (Newman and Kenworthy, 1999). Parramatta was nominated as Sydney’s second Central Business District (CBD). Through centres policy support since the late 1960s, Parramatta has grown from around 10,000 jobs to around 40,000 jobs. Around 35% of 31work trips to Parramatta centre are by public transport – the highest share for centres outside those in and around central Sydney.
The County of Cumberland Planning Scheme nominated 16 ‘District’ centres for a future population of 2.3 million. The Sydney Region Outline Plan was preoccupied with organising peripheral and corridor growth with the CBD, two subregional centres – Parramatta and Campbelltown town centres – and Blacktown, Chatswood, Mount Druitt, Penrith and Camden as other key centres. Sydney into its Third Century, for a population of 4.5 million, had 3 regional centres (CBD, North Sydney, and Parramatta) and 16 subregional centres (Wyong, Gosford, Hornsby, Rouse Hill, Blacktown, Mount Druitt, Penrith, Liverpool, Campbelltown, Bringelly, Wollongong, Sutherland, Hurstville, Bankstown, Burwood, and Bondi Junction).
Only about one quarter of the regional employment share was located in these major centres in 1981 (NSW Department of Planning, 1988: p. 48). Therefore, it is instructive to examine where changes in jobs density have taken place from 1981 to 2001 (the most recent census data at the small geographical scale of a traffic zone). If the spatial plans have been effective, we would anticipate that substantial jobs might be created in the designated employment centres and in the outer suburbs.
Figure 8: Employment density changes by traffic zone, 1981–2001
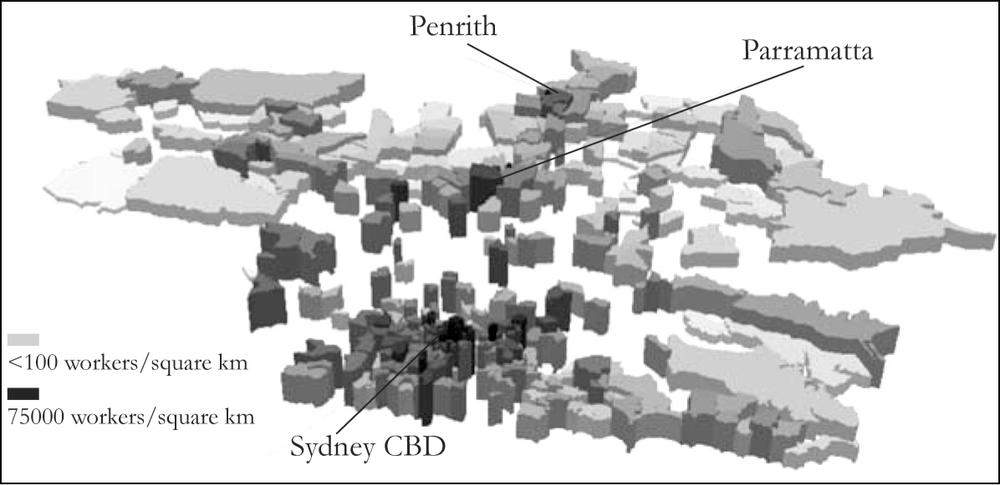
Source: Black et al. (2007): p. 1318 32
Another way to track the employment change across a region over time is to make a rank-size plot of the logarithm of the number of jobs in each zone of the metropolitan area, or employment density in each zone. As shown in Figure 9, rank-size distributions are plotted from census data for 1981, 1991 and 2001, where the spatial unit of analysis is the traffic zone. An estimate is made for its shape in 2031 according to planning targets in the Metropolitan Strategy and various assumptions. The assumption is that the travel zone forecasts for 2031 can be extrapolated from the 2001 census travel zone employment densities in proportion to the NSW Government forecast for change in respective SLA employment densities from 2001 to 2031. For the Sydney wide data of Figure 9, this is considered an appropriate estimate.
Figure 9: Distribution of employment in traffic zones, 1981–2031
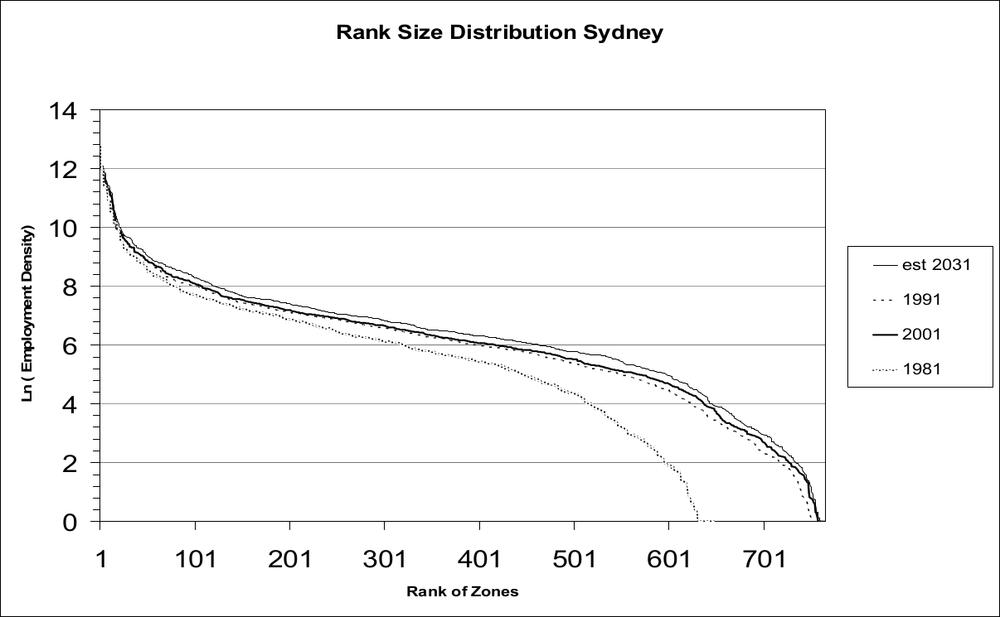
Source: Black et al. (2007: p. 1317) using census journey to work surveys
In the 20 years from 1981 to 2001, there has been an increase in the employment density in all zones. Higher density zones have shown the least change over this period, whilst the biggest change has occurred in lower density zones between 1981 and 1991. Relatively little change has occurred between 1991 and 2001. The rank-size distribution estimated 33from government plans show a continuance of the current trend with slight increases in employment density.
The deterioration in environmental sustainability in the outer suburbs is of major concern especially since 40% of new housing will be in these outer urban release areas by 2031. Jobs have lagged behind residential expansion at the metropolitan fringe. This can be demonstrated by considering the ratio of resident workers to locally available jobs within selected outer Statistical Local Areas (SLAs) of metropolitan Sydney from 1961 to 1996 (Suthanaya and Black, 2001). A ratio of unity (one) is a home-work balance. All areas have a deficit of locally available jobs. For example, Penrith (SLA 6350) – one of the designated major centres in successive metropolitan strategies – shows a continuously deteriorating balance over time with a value of 1.7 at the 2001 Census of Population and Housing.
These imbalances between the spatial, residential and employment markets result in increasingly long commuting distances for outer suburban workers. For example, the mean journey-to-work trip length of workers living in Penrith (55 km from CBD) in 2001 was 26 km (the metropolitan mean distance was about 18 km). This can be compared with a mean of 6 km for residents of the City of Sydney, and 8 km for residents of North Sydney. To complete the comparative picture for the other two major employment centres designated under the metropolitan strategy: Parramatta (23 km from the CBD) has a mean trip length of 16 km, and Liverpool (32 km from the CBD) a mean trip length of 19 km. Are these empirical results a function of outer suburban workers preferring to travel longer distances to get to work?; or, is it a function of poorer accessibility to job opportunities?
Selecting the example of Penrith, Figure 10 shows how the degree of ‘self containment’ of local labour markets has been reduced, especially in the period 1961 to 1981. The table shows for three census years – 1961, 1981 and 2001 – the percentage of workers who live in Penrith who complete their journey to work (find a place of employment) on reaching the specified proportion of all metropolitan job opportunities (accessibility to jobs). In 1961, Penrith was a largely independent town serving its predominantly rural and agricultural hinterland. Almost three-quarters of the workers worked locally within the Penrith SLA (on reaching 5% of metropolitan jobs). By 1981, this percentage had 34dropped to 50% on reaching 5% of metropolitan jobs. In 1981 and 2001, the change was slight: there was a minor increase in those working ‘locally’. For instance, on reaching half of the metropolitan job opportunities in 1981 and in 2001, 90% had found a workplace in 2001, 6% more than in 1981. Similar patterns have been identified for other outer western suburbs and a full interpretation of changes in commuter travel will be undertaken in future work.
Figure 10: Employment in Penrith, 1961–2001
| Year | 5% jobs* |
10% jobs |
20% jobs |
30% jobs |
50% jobs |
75% jobs |
| 1961 | 70% | 77% | 82% | 85% | 86% | 95% |
| 1981 | 50% | 60% | 70% | 75% | 84% | 97% |
| 2001 | 54% | 58% | 68% | 78% | 90% | 97% |
Shows percentage of workers living in Penrith and finding a job given the specified percentage of metropolitan jobs reached, 1961–2001. * cumulative % of metropolitan jobs reached from Penrith. Source: Analysis of Census of Population and Housing, journey to work tabulations based on Ton (1989) and Cheung and Black (2005)
Equity, sustainability and economic efficiency
Urban policy directs public resources and therefore policy can influence urban development in certain directions. In the case of pursuing the policy objective of centres employment formation, urban policy is about defining and promoting suitable locations for major employment relocation and growth, and the transport links and services to those locations. Three locational variables are at work – jobs, housing and transport – which together determine the type and level of a person’s employment opportunities. Equity has been one dimension of the spatial planning of Australian cities (Alexander, 1981). The Federal Australian Labor Party has also been concerned with equity issues in general, and the belief that many inequities in urban areas could be alleviated by the public sector and by urban planning measures (Whitlam, 1975; Alexander, 1981: p. 145). The Hawke Federal Labor Government was 35also interested in redressing problems of ‘locational disadvantage’ in Australian cities (Black, 1992).
Contemporary urban policy in Australia is now concerned with the problems of the sustainability of cities (for example, House of Representatives Standing Committee on Environment and Heritage, 2005; Black, 2006) with the ‘triple bottom line’ outputs from proposed developments in terms of economic efficiency, inter- and intra-generational equity, and environmental sustainability. National and international research in urban transport has aimed to define sustainability in more operational terms (see, for European cities, Minken et al., 2002; Spiekermann and Wegener, 2003; for Japanese cities, Kachi et al., 2005; and for Australia, Lennox and Turner, 2005) and to recommend to policy makers appropriate metrics that measure progress towards sustainability (Hidas and Black, 2001; Black et al., 2002; European Commission, 2004, 2007).
Research by Doust (2008) has formulated two novel relationships that involve the three pillars of urban sustainability: a link between equity (accessibility to employment) and environmental sustainability (greenhouse gas emissions in travel to work); and a link between economic efficiency (accessibility to labour markets from employment centres) and environmental sustainability (greenhouse gas emissions in travel from place of employment to home). Thus, we are concerned with accessibility and commuter travel from discrete locations (traffic zones), either as residential areas or as employment centres. Calculations of accessibility (equity and efficiency) are made for specific zone to zone pairs, where the census journey to work travel data identifies the homework or work-home desire lines, and TRANSCAD (commercially available GIS software widely used by transport planners) allows this traffic to be assigned to a representation of the transport network. In this chapter, as we only present the findings for all commuters by private transport, only the road network is used for the analysis. Greenhouse gas emissions by private transport per unit distance is estimated from authentic data on emissions rates plus the embodied energy (and emissions) in road construction and maintenance. 36
Employment location efficiency
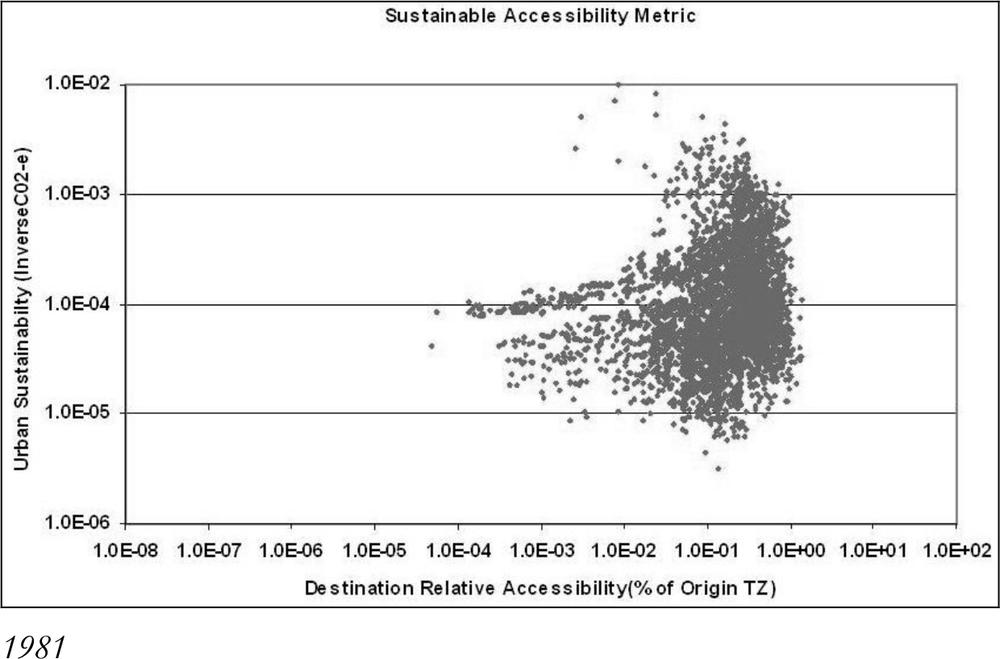
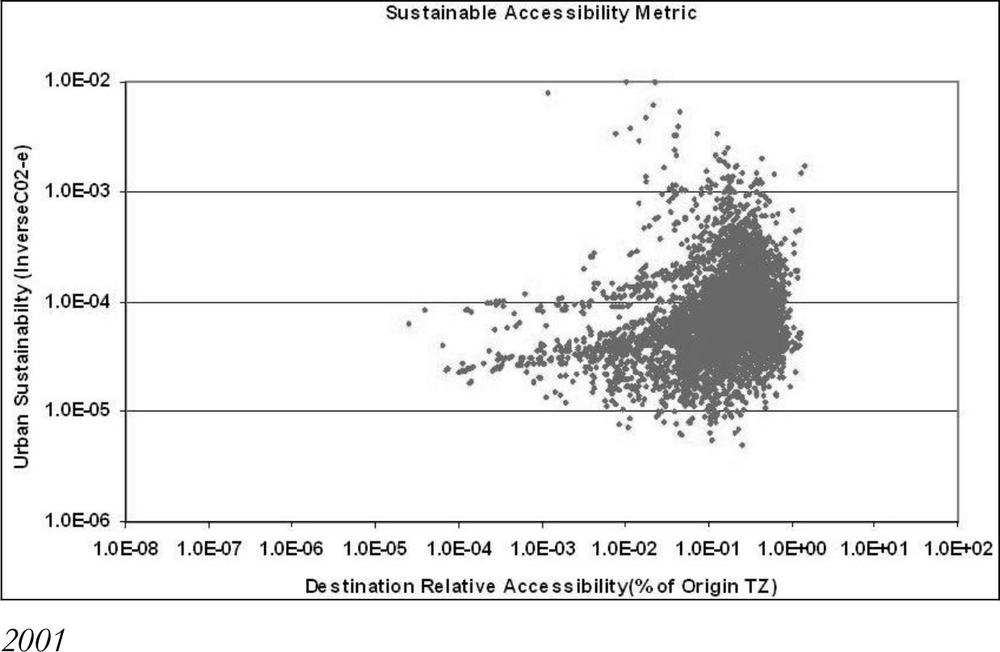
Figure 11 provides a series of visualisations of the environmental sustainability and accessibility to workforce for the centre employment travel zones in the Penrith ‘River City’ precinct. Figure 12 provides the same visualisations of the Sydney ‘global city’ for comparison. The visualisations are for car-based trips to all travel zones with worker residences right across the Sydney Metropolitan Area. Each travel zone pair is represented by a metric point. The census year data sets for 1981 and 2001 are plotted in these figures, to allow interpretation of the spread and distribution in environmental sustainability – accessibility space and the changes across a twenty-year timeframe. The plot scale is logarithmic for both the environmental sustainability and the relative accessibility measures.
Each scatter plot visualisation in Figures 11 and 12 represents the relative accessibility measure plotted with an urban environmental sustainability measure (1/CO2-e) for each travel zone pair. Over the 20-year timeframe from 1981 to 2001, a reduction in environmental sustainability is noticeable for both centres. However, a greater reduction in the Penrith environmental sustainability is evident. This is consistent with a larger increase in vehicle kilometres for the journey to work travelled in the outer areas of Sydney over the same timeframe (see Suthanaya and Black, 2001). In comparison to the Sydney centre employment zones, the Penrith scatter plot displays a similar degree of spread (left to right) in relative accessibility, at least four orders of magnitude.
These visualisations confirm that the Sydney Centre employers have a wide choice of workforce zones with comparable accessibility. The Penrith Centre, however, is at a disadvantage by comparison with only a third of the number. Industry and business at Penrith may be less than optimally efficient as a result of a less accessible workforce and difficulties in attracting and retaining labour. 37
Figure 11: Visualisations of centre sustainability, Penrith
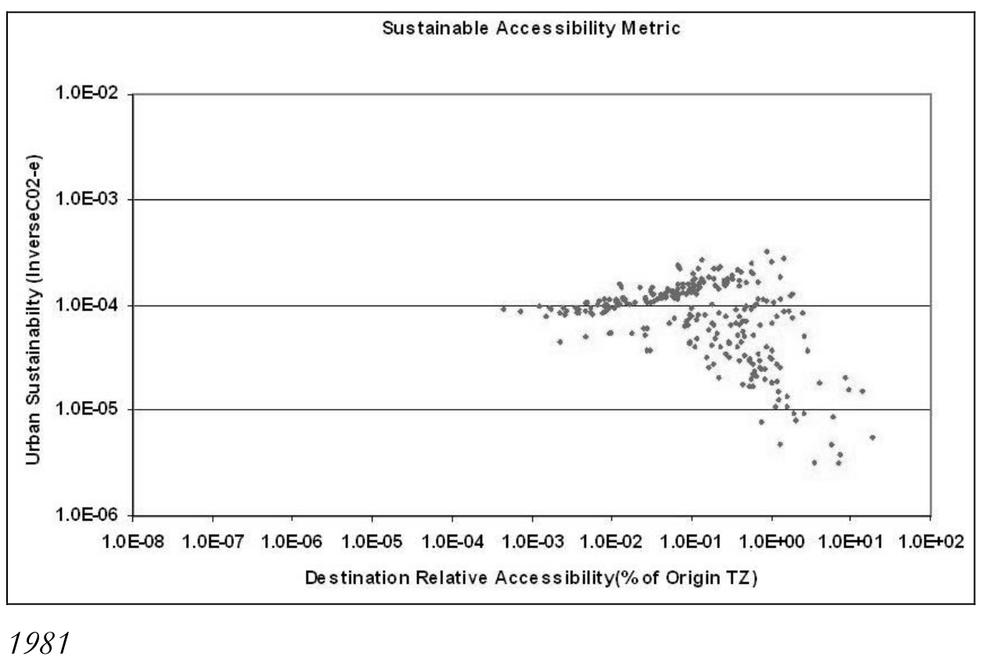
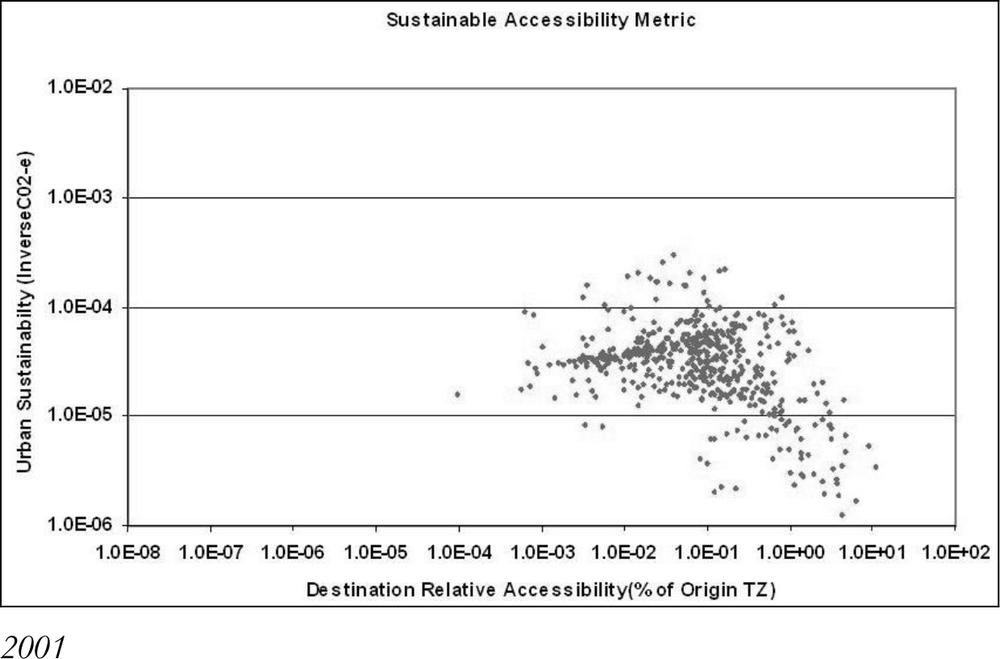
Figure 12: Visualisations of centre sustainability, Sydney
Conclusions
Metrics are an objective measure of truly sustainable performance outcomes, which, when applied with visualisation tools, make it easier to see if policy objectives have been met. As part of a larger study funded by EASTS-IRCA from 2005–2007, we have examined some of the changes that have taken place in metropolitan Sydney since 1945 and have commented on plans for employment centres in 2031. We have applied rank-size distributions over time for employment density across zones of Sydney, and three-dimensional plots using TRANSCAD GIS software for a visualisation of job growth from 1981 to 2001.
New metrics of sustainability have been introduced in this chapter and illustrated with particular reference to the outer metropolitan suburbs of Sydney. These metrics are based on accessibility from home to job opportunities (equity); accessibility to labour markets from major employment centres (economic efficiency); and greenhouse gas emissions in the journey-to-work travel by car (environmental sustainability). These metrics allow an assessment of past trends in urban development and those projected under various planning scenarios, which will be the topic of ongoing research. Further research will aim to undertake a stratified analysis by occupation type or industry category so as to identify ‘where the spatial mismatch of jobs and housing will be least for workers with the lowest ability to pay for transport’ (Maher et al., 1981: p. 131).
NSW Government policies and strategies have been an integral component of the Sydney metropolitan region’s spatial plans from 1948 to 2005 to encourage a suburbanisation and clustering of employment formation in Sydney. The government claims that the centres policy has been successful but careful analyses of data from 1961 to 2001 from the Census of Population and Housing and from the NSW Transport Data Centre presented in this chapter suggest a more cautious interpretation of the success of the centres policy in Sydney. Land use policies that encourage employment creation in the right places in major centres, and policies for public transport technologies serving those centres and parking control, can contribute to more sustainable urban areas. Mean trip lengths for the journeys to work can be contained to polycentric employment centres and there are greater prospects for more of those journeys being made by public transport, cycling and walking. 40
The CBD and North Sydney continue to be major employment centres and are likely to increase their importance as globalisation continues and more future jobs in the new economy will be located in the ‘global arc’. Parramatta, as the second CBD, has grown relatively slowly following the County of Cumberland Planning scheme and subsequent plans. As major centres designated under the 2005 metropolitan strategy, both Liverpool and Penrith have been modest performers as polycentric nodes in a suburban landscape increasingly characterised by low-density sprawling employment.
Notes
The authors are members of ICRA-003 supported by the Eastern Asia Society for Transportation Studies International Collaborative Research Activity. The principal researchers are Professors Yoshitsugu Hayashi (Nagoya University) and John Black. The authors thank: Dr Pelin Alpkokin, Technical University of Istanbul, and colleagues at Nagoya University, for the collaboration on the development of some of the analytical computer software used in preparing this paper; Karl Ikaunieks for assistance with the scatter plot algorithm; the NSW Ministry of Transport, Transport Data Centre for providing the Census of Population and Housing Journey to Work Tabulations; and Dr Bruno Parolin, Faculty of the Built Environment, University of NSW, for access to the TRANSCAD 4.5 licence.
41
References
Alexander, I. (1981) ‘Post-war metropolitan planning: goals and realities,’ in P. Troy (ed.) Equity in the city. Sydney: George Allen & Unwin, pp. 145–171.
Alpkokin, P., Black, J., Kato, H. and Vichiensan, V. (2007) ‘Poly-centric employment formation in mega-cities: analysis from APEC-TR collaborative research.’ Journal of the East Asia Society for Transportation Studies. vol. 7: pp. 1446–1459.
Alpkokin, P., Cheung, C., Black, J. and Hayashi, Y. (2008) ‘Dynamics of clustered employment growth and its impacts on commuting patterns in rapidly developing cities.’ Transportation Research Part A: Policy and Practice. 42(3): pp. 427–462.
Black, J. (1975) Some equity aspects of urban development: abstract of key concepts. Abstract of paper to Urban Biology Group, Australian National University, Canberra, May 1st 1975.
Black, J. (1977) Public inconvenience: access and travel in seven Sydney suburbs. Canberra: Australian National University.
Black, J. (1979) ‘Changes to employment accessibility in Sydney,’ in K. O’Connor (ed.), Proceedings: third annual meeting of the regional science association (Australian and New Zealand Section), pp. 118–129.
Black, J. (1992) ‘Journey to work and access to transport with particular reference to locational disadvantage on the outer fringes of major Australian cities,’ in Transport disadvantage: trends and issues, discussion papers prepared for the Department of Prime Minister and Cabinet, vol. 1(31).
Black, J. (2006) ‘Sustainable urban transport technologies and policies: a research perspective,’ in Dialogues in Urban Planning, Sydney. The Planning Research Centre at the University of Sydney, pp. 4–20.
Black, J., Cheung, C., Doust, K., Shabtay, O. (2007) ‘Metrics of changes to major employment centres: analyses of spatial plans for Sydney 1948–2031.’ Journal of East Asia Society for Transportation Studies. vol. 7: pp. 1311–1325.
Black, J. A. and Conroy, M. M. (1977) ‘Accessibility measures and the social evaluation of urban structure.’ Environment and Planning, A., vol. 9: pp. 1013–1031.
Black, J., Páez, A. and Suthanaya, P. (2002) ‘Sustainable urban transportation: performance indicators and some analytical 42approaches.’ Journal of Urban Planning and Development, American Society of Civil Engineers. 128(4): pp. 184–209.
Blakely, E. J., Bista, S., Leng, E., Khan, A., Woodcock, S., Raskall, P., Searle, G., Maganov, P., Deeming, S., Bliss, J., Gardiner, W., Morrison, K., Southall, L. and Richardson, R. (2006) Essential Sydney: benchmarking our city. Published by the Sydney Morning Herald, July 2006.
Cheung C. and Black J. (2005) ‘Spatial interaction models for the journey to work: a reappraisal of the intervening opportunities model applied in the 1960 Chicago Area Transportation Study based on developments in computing technologies’, Proceedings of the 9th International Conference on Computers in Urban Planning and Urban Management, presented at the University College London, 29 June to 1 July, 2005 (Conference CD-Rom).
Doust, K. (2008) ‘Metrics of environmental sustainability, social equity, and economic efficiency in cities’. Unpublished PhD thesis, University of New South Wales (submitted).
European Commission (2004) Expert group on sustainable urban transport plans: final report deliverable D4. Brussels: European Commission.
European Commission (2007) Sustainable development indicators. Brussels: European Commission.
Hidas, P. and Black, J. (2001) ‘SMART targets for sustainable transport: a review of international and local (NSW) practice.’ Transport Engineering in Australia. 7(1&2): pp. 77–92. House of Representatives Standing Committee on Environment and
Heritage, Parliament of Australia (2005) Sustainable cities. Canberra: House of Representatives.
Kachi, N., Hayashi, Y., Kato, H. and Black, J. (2005) ‘Making cities more compact by improving transport and amenity and reducing hazard risk.’ Journal of the Eastern Asia Society for Transportation Studies. vol. 6: pp. 3819–3834.
Klug, S., Alpkokin, P., Black, J. and Hayashi, Y. (2007) ‘Policies for employment centers in metropolitan regions.’ Journal of Eastern Asia Society for Transportation Studies. vol. 7: pp. 1417–1432.
Lennox, J. and Turner, L. (2005) State of the environment report on human settlements: stocks and flows indicators. Canberra: CSIRO Sustainable Ecosystems for Department of the Environment and Heritage. 43
Lofthouse, G. (ed.) (n.d.) Megacity challenges: a research project conducted by GlobeScan and MRC McLean Hazel Sponsored by Siemens. Munich: Siemens A G.
Maher, C., O’Connor, K. and Logan, M. (1981) ‘Employment opportunities,’ in P. Troy (ed.) Equity in the city. Sydney: George Allen & Unwin, pp. 123–144.
May, A. D., Matthews, B. and Jarvi-Nykanen, T. (2001) ‘Decision making requirements for the formulation of sustainable urban land use: transport strategies’. Unpublished paper. 9th World Conference on Transport Research, Seoul, 22–27 July, Conference CD-Rom.
Minken, H., Jonsson, D., Shepherd, S. P., Järvi, T., May, T., Page, M., Pearman, A., Pfaffenbichler, P., Timms, P., and Vold, A. (2002) Procedures for recommending optimal sustainable planning of European city transport systems – deliverable No.2 evaluation tools, January 2002.
Newman, P. and Kenworthy, J. (1999) Sustainability and cities: overcoming automobile dependency. Washington DC: Island Press.
NSW Department of Planning (1988) Centres policy. Unpublished paper.
NSW Government (2005) NSW Government’s metropolitan strategy – city of cities: a plan for Sydney’s future (CD-Rom).
Spearritt, P. and DeMarco, C. (1988) Planning Sydney’s future. Allen & Unwin, in conjunction with NSW Department of Planning, Sydney.
Spiekermann, K., and Wegener, M. (2003) ‘Modelling urban sustainability’. Proceedings of the 8th Conference on Computers in Urban Planning and Urban Management (CUPUM’03), Sendai. (CD-Rom).
State Planning Authority (1968) Sydney Region Outline Plan. Sydney: State Planning Authority.
Suthanaya, P. and Black, J. (2001) ‘Urban form and journey to work travel behaviour using census data for 1961–1996.’ Journal of the East Asia Society for Transportation Studies: Environment and Safety. 4(5): pp. 27–42.
Ton, T. T. (1989) Dynamics of Journey-to-Work Travel Response in Local Government Areas of Sydney. Unpublished MEngSc Project, School of Civil Engineering, University of New South Wales.
Whitlam, E. G. (1975) Chifley Memorial Lecture, University of Melbourne, 14th August 1975.
Winston, D. (1957) Sydney’s great experiment: the progress of the County of Cumberland Plan. Sydney: Angus and Robertson.