3
Attitudes to immigration and asylum seekers in Australia: contested territory or an opportunity for right-wing populism?
Attitudes to immigration and asylum seekers in Australia
This chapter deals with trends in Australian attitudes to immigration and asylum seekers. It does so by considering an important political development: the return of the populist right to Australian politics, primarily in the form of a revived One Nation. The return of One Nation is not surprising given wider global events – voter support for nationalist and anti-immigration parties in Europe, the influence of anti-immigration sentiment on the United Kingdom’s decision to leave Europe, and the disquieting success of Donald J. Trump’s campaign in the 2016 presidential elections in the United States. One Nation’s fortunes have depended on political opportunities available to it and indeed, its ability to maintain a coherent party organisation. However, its success in the 2016 federal Senate elections (and improved polling since) raises questions about One Nation’s prospects.
The goal of this chapter, then, is to make sense of three related developments. These are the return of One Nation to politics, the changing character of opposition to immigration, and the role of sociocultural and economic insecurities in explaining this opposition. One Nation, as the main vehicle of popular-right expression, has been weakened over the years by party disorganisation, the difficulties of maintaining small-party representation given Australia’s electoral systems, and competition from the Coalition, particularly on border protection. However, its revival demands a fresh round of analysis.
My task here is to consider the role of public opinion and social attitudes in creating opportunities for parties like One Nation. It makes sense to focus on patterns in attitudes to immigration as an important factor in the shifting fortunes of populist right politics without making the strong assumption that political opportunities can be neatly ‘forecast’ from trends in public opinion. Even though the international literature finds solid evidence of the association between anti-immigration sentiment and support for the populist-right (Rydgren 2008, 740), it is also clear there are other significant influences on the political opportunities for the populist right (Mudde 2013, 6). These factors are also highlighted in what follows here.
In considering recent polling evidence,1 I shall argue that trends in support for immigration levels and changing patterns of opposition to asylum seekers probably limit electoral opportunities for right-wing populism for the time being. There is now a significant constituency for high migration in Australia and a genuine partisan divide over Australia’s handling of asylum seekers. The latter fact points to difficulties governments face in either liberalising or making tougher conditions for asylum seekers.
Recent commercial polling that suggests a substantial minority of Australians support a ban on so-called ‘Muslim immigration’ should be interpreted in this light. Attempts to alter the immigration mix along these lines will embolden some. However, these kind of policies also encounter public opinion constraints and resistance from social movements, both of which were still in formation two decades ago.
A resurgent populist right in the land of multiculturalism?
The near-absence of populist right political representation in Australia over the past decade is remarkable given developments in Europe and elsewhere. In searching for explanations, one can start with the pressures faced by minor parties like One Nation in a two-party system that makes sustaining parliamentary representation difficult. Next, one might consider the organisational dysfunction of One Nation as a factor. However, the Coalition’s ability to appeal to populist voters through its immigration and national security policies is another consideration. Indeed, the evidence internationally suggests that the mainstream right, not the populist right, has been chiefly responsible for tougher immigration policies (Mudde 2013, 12). In any case, I will argue that underlying trends in Australian attitudes to immigration and asylum seekers over the past decade or so have not been particularly favourable to parties seeking to exploit anti-immigration politics.
As Mudde points out, the politics of race and immigration is a complex, multidimensional space. A relevant starting point, especially for a country like Australia with a migration program that is both large and culturally diverse, is to see whether support for multiculturalism has remained high. Governments have remained committed to a broadly multicultural policy framework, though that support has become more qualified in some contexts. Markus’ (2016) intensive opinion research on this subject has not detected any decline in support for multiculturalism on a direct measure – ‘Multiculturalism has been good for Australia’ – with over 80 per cent agreement for successive survey years (2016, 50). However, another measure in the Australian Election Study (AES) 2016 hints at some fraying. The proposition that ‘immigrants make Australia more open to ideas and cultures’ measures the role of migration in achieving openness and diversity – two features of multiculturalism. On that measure, total support has also been high – in the 75 per cent–81 per cent range between 1996 and 2007. Since 2010, however, it has fallen, now sitting in a range between 69 per cent and 73 per cent (Cameron and McAllister 2016, 101).
Australia compared internationally
A society broadly committed to multiculturalism can still find reasons to oppose immigration – for example, when joblessness is high. One commonly used barometer of immigration sentiment asks respondents about their feelings towards the level of immigration. How do Australians compare on this score?
Data from nine rich countries presented in Table 3.1 suggests that Australians support current immigration levels. A minority (42 per cent) prefer lower immigration – the lowest of these nine countries selected for this comparison. Anti-immigration sentiment is higher elsewhere – a staggering 79 per cent of UK respondents, 62 per cent of Belgian respondents, and 60 per cent of French respondents want lower immigration. Moreover, two of the countries mentioned have significantly lower net migration rates than Australia (see last column of the Table).
However, a closer look at this data adds nuance. There is evidence that a relatively high number of those Australians opposed to immigration have strong views about it. Some 24 per cent want immigration reduced a lot. On that measure, Australia’s anti-immigration population jumps to a higher place on the list.
Table 3.1 also presents data from a WIN/Gallup (2016) poll conducted in 69 countries about approval of foreign workers. Here, Australian support for migration appears more qualified. Net approval for these workers is at a sobering minus 22 per cent. Still, the balance of opinion in Australia was more favourable to foreign workers than in Belgium (minus 49 per cent) and in France (minus 37 per cent), and was similar to the opinions of voters in the Netherlands and in the United Kingdom (minus 21 per cent and 28 per cent respectively). However, Australian opinion was considerably less favourable than that recorded for voters in Sweden (+27 per cent), Germany (+5 per cent), the United States (+5 per cent), and Denmark (minus 11 per cent).
Finally, Table 3.1 gives some basic data on the performance of major right-wing populist parties in these nine countries. With the exception of Denmark, the countries where the populist right is electorally stronger than in Australia tend to have stronger preferences for reducing immigration. Nevertheless, the relationship is not particularly strong, and is likely mediated by other considerations such as voting systems and the responsiveness of mainstream parties to anti-immigration agendas. One might consider the impact of Howard-era immigration policies and Donald Trump’s repositioning of the Republicans as examples of such responsiveness.
As noted, immigration sentiment offers only some insight in accounting for populist right voter support. To the extent that it does have explanatory value, the data suggests that overall Australian attitudes to immigration are not particularly hostile, especially when cast in comparative terms. Still, around a quarter of Australians want much-reduced immigration and attitudes to foreign workers are fairly ‘cool’. These results suggest there is a considerable electorate for populist right politics centred on immigration, even if these issues are not running ‘white hot’ as they are in some parts of Europe. However, recent moderation in hostility to immigration levels helps explain why populist right-wing politics in Australia have been less successful in the past decade than it was in the anti-immigration 1990s.
Table 3.1: Major populist right party vote (main house of parliament) and attitudes to immigration in selected rich democracies.
| Populist right vote last national election (%) (or poll) | Reduce immigration (total) % | Reduce immigration (a lot ) % | Net support for foreign workers % | Net migration rate (per 1,000 pop; 2016) | |
|---|---|---|---|---|---|
| Denmark | 21 | 43 | 21 | -11 | 2.1 |
| United Kingdom | 15 | 79 | 57 | -21 | 2.5 |
| France | 14 | 63 | 48 | -37 | 1.1 |
| Sweden | 13 | 60 | 29 | 27 | 5.4 |
| The Netherlands | 13 | n/a | n/a | -28 | 1.9 |
| Germany | 11 | 49 | 24 | 5 | 1.5 |
| Belgium | 5 | 62 | 48 | -49 | 5.6 |
| Australia | 3 | 42 | 24 | -22 | 5.6 |
| USA | -- | 43 | 19 | 5 | 3.9 |
Sources: Column 1: for Australia’s populist right classification, see footnote 2. For other classifications, refer to the most recent national election Wikipedia pages for: Belgium (2014; combined vote for VB/Flemish Interest and PP/People’s Party); Denmark (2015; DF/Danish People’s Party); France (2012; National Assembly elections; FN/ National Front); The Netherlands (2017; PVV/Party for Freedom); Sweden (2014; Sweden Democrats); the United Kingdom (2015; UKIP); and refer to the ‘Opinion polling for the next German federal election, 2017’ Wikipedia page (poll average of January to March 2017 polls for the AFD (Alliance for Germany). Columns 2 and 3: data on preferences for reducing immigration comes from ISSP (2015) (country samples ranging from N=904 to N=2,202) and AES 2016 (N=2,818; weighted). Column 4: data from WIN/Gallup (2016). Question: ‘Generally speaking do you think the immigration of foreign workers is a good thing or a bad thing for [insert your country]’. Sample sizes approximately N=1,000 in each country. Column 5: estimated net migration rates for 2016; CIA (2016).
Immigration and populist right electoral performance in Australia
In Australia, favourable conditions for a strong anti-immigration force in politics – that is, widespread voter resistance to immigration levels – peaked in the post-recessionary 1990s (Markus 2016, 39; Cameron and McAllister 2016, 100). One Nation emerged out of this, achieving its strongest performance in the 1998 elections in its ‘heartland’ state of Queensland. It gained almost 23 per cent of the primary vote and 11 of 89 seats. Nevertheless, One Nation made only minor headway elsewhere in gaining parliamentary representation.
Since the early 2000s, anti-immigration sentiment weakened considerably for reasons explored in the rest of this chapter. Not surprisingly, the populist right – as a distinct political force – disappeared from Australian politics for a decade. Even at their strongest, populist right parties in Australia have never gained above 10 per cent of the vote for the main chamber of parliament at a national election, something achieved in a number of European countries. Still, One Nation polled well in the 15 House of Representative seats it contested in 2016 (averaging 13 per cent per cent of the primary vote) and populist right parties achieved around 6 per cent of the vote in the Senate (mainly votes for One Nation) (see Green 2016).
Why this partial revival? First, the political cycle mattered. Right-wing disappointment with a first-term Coalition government that replaced its conservative-populist prime minister, Tony Abbott, fomented a protest vote in 2016. Second, political opportunities were enhanced by Prime Minister Turnbull’s decision to call a double dissolution election in July 2016, making it easier for One Nation to win its four Senate seats. Third, international politics is favouring both leftist and right-wing populist movements, with the latter amplifying the kind of anti-immigration and now anti-Muslim rhetoric that One Nation promotes.
Just as these factors help explain One Nation’s success in elections and in recent polling, they hint at limits to the party’s future performance. Its relatively poor result in the Western Australian state election of March 2017 (a primary vote of 4.9 per cent, no seats in the Legislative Assembly, and three in the Legislative Council) is a reminder of the fragility of its appeal, its organisational vulnerability, and the patchy charm of its long-time party leader. In November 2017, despite a resurgent primary vote, One Nation gained only one seat in the Queensland state election, well short of their 1998 performance.
Conditions for longer-term and broader success of a party like One Nation depend on more than favourable short-term opportunities. Robust party organisation, even greater electoral salience of its core issues, and a broader appeal to Labor and Coalition voters would all count. The fact that anti-immigration politics in Australia – as we shall see, the bread-and-butter issue for One Nation – has lost force since the 1990s, and also invites greater public contestation when it returns, suggests that conditions for populist mobilisation may not be as easy to obtain.
Does hostility to immigration distinguish voters on the populist right?
Judging from recent elections, One Nation and other populist right parties continue to appeal to a significant minority of Australian voters. What policy differences distinguish their voters? And does anti-immigration sentiment feature as strongly in their support as I have suggested? These questions have been analysed using a large post-election survey conducted by VoxPop Labs. Shaun Ratcliff’s research presented in Chapter 2 suggests that a ‘representation gap’ on social issues – on asylum seekers, for example – played a central role in populist right vote choice in 2016 (see also Marr 2017, who cites McAllister’s research). However, Ratcliff also finds that general beliefs about the (poor) state of the economy, and to some extent personal economic insecurity, drove voters to these parties.
Here, we can add to Ratcliff’s findings by considering a much smaller (but randomly selected) sample of around 120 voters who voted for one of the populist right parties according to AES 2016.2 This is a small sample size, so we look for large differences that are likely to be statistically significant as well as sociologically meaningful. As the data presented in Table 3.2 shows, these voters overwhelmingly disagreed with Malcolm Turnbull replacing Tony Abbott as prime minister in 2015 (85 per cent disapproval). This is direct evidence that the new prime minister was rejected by the Coalition’s right flank.
Table 3.2 also shows that not all social issues drive support for these parties with equal force. The results make clear that attitudes to immigration and race – asylum seekers, the number of migrants, and Aboriginal rights – strongly differentiate this voter bloc, with perceptions of government control by ‘big interests’ featuring similarly. It is not too much of a stretch to suggest that issues of immigration and big interests merge for many in this group, culminating in a world-view asserting that multiculturalism has been ‘forced’ on Australia from above (see Marr 2017, 57).
However, populist right voters do not appear to oppose other forms of social progress. Most express support for same-sex couples having the same rights as others (58 per cent) and most do not believe equal opportunities for women have gone too far – even though they are more conservative on both questions than other voters. Moreover, just as Ratcliff finds with the VoxPop Labs data, the AES 2016 sample of populist right voters also express greater dissatisfaction with the economy and higher levels of personal economic insecurity.
What is clear is that both the VoxPop Labs and AES data point to issues of race and immigration as the strongest points of differentiation between populist right voters and everyone else. Public opinion in this area appears to be central to explaining prospects for right-wing populism in Australia.
Table 3.2: Attitudes and demographics of populist right voters versus all other voters, %.
| Populist right voters (n=120) | All other voters (n=2,698) | Gap## | |
|---|---|---|---|
| Attitudes | |||
| Disapprove of Turnbull replacing Abbott | 85 | 50 | +35 |
| All boats carrying asylum seekers turn back | 78 | 46 | +32 |
| Prefer lower immigration | 71 | 40 | +31 |
| Government run by a few big interests | 82 | 54 | +28 |
| Aboriginal rights gone too far | 51 | 27 | +24 |
| Self-identified working class | 59 | 39 | +20 |
| Very dissatisfied with state of economy# | 33 | 15 | +18 |
| Big business has too much power | 89 | 73 | +15 |
| Household finances worse in last 12 months | 48 | 34 | +14 |
| Same-sex couples equal rights | 59 | 71 | -12 |
| Equal opportunities for women gone too far | 21 | 9 | +12 |
| Very difficult to find another job next 12 months | 47 | 36 | +11 |
| Demographics | |||
| Born in Australia | 89 | 77 | +12 |
| Aged under 40 years | 26 | 35 | -9 |
Source: Australian Election Study 2016 (weighted).
Notes: # ‘Very dissatisfied’ coded as 0–2 on a 10-point scale where 0 is very dissatisfied and 10 is very satisfied. ## All the differences between populist right voters and ‘All other voters’ are significant on bivariate Gamma tests at p<0.05 using unweighted data.
Trends in Australian attitudes to immigration
As data presented in the previous section suggests, populist right voters are distinguished by their hostility to immigration and asylum seekers. However, they also express higher levels of dissatisfaction with politics generally, and they have higher levels of economic insecurity than other voters. So do these findings suggest that the revival of One Nation is an indication of rising hostility to immigration in general and to migrants and asylum seekers in particular?
To answer this question, let’s go back to 1996, and focus initially on opinions about the level of immigration.3 At the time of the Keating Labor government’s defeat, a very high 63 per cent of Australians wanted to reduce immigration, according to AES 1996. (See Table 3.3.) This hostility had remained even after the Labor government had slowed the rate of immigration following the recession of 1991–92 (see Sherrell and Mares 2016). Moreover, this negative sentiment persisted well into the period of economic recovery.
Strong anti-immigration sentiment in Australia in the 1990s is a reminder of how recessions can undermine immigration, even after economic growth is restored. This is a problem for the UK and Europe, almost a decade after the beginnings of the Global Financial Crisis (GFC). The ability of a weak economy to stir up anti-migrant sentiments tends to be understated in the literature, which emphasises sociocultural backlash (Inglehart and Norris 2016, for example). We cannot explore this problem in detail here, but both types of explanations appear to matter. As Markus’ analysis for Australia shows, preferences for reduced immigration over time track extremely closely to the level of unemployment (2016, 39; Goot and Watson 2005, 184).
Over the course of the 2000s, voter demands for lower immigration started to fall away. In fact, support for reduced immigration fell to around 35 per cent in 2004 before trending up again over the next decade. Explanations for acceptance of immigration levels must centre on Australia’s improved economic and employment performance, especially during the resources boom. This is an argument highlighted in Goot and Watson (2005: 184) and in Meagher and Wilson (2006). As Table 3.3 shows, voter assessments of general job insecurity improved between 1998 and 2007. Voters believing it would be ‘very difficult’ to find another job fell sharply from 42 per cent to 14 per cent over that time. Greater support for immigration levels also tracks Australian Bureau of Statistics unemployment/underemployment measures (Table 3.3) – consistent with Markus’ findings.
At the same time, fewer voters believed that ‘immigrants take jobs away from people who are born in Australia’. The number of respondents agreeing with this statement declined from 41 per cent in 1996 to 29 per cent in 2007. Perceptions that ‘immigrants increase the crime rate’ also declined, from 52 per cent to 37 per cent in 2016. This decline tracked the falling incidence of crime throughout the 2000s (Weatherburn 2016). It is likely therefore that employment and crime conditions helped stabilise support for immigration numbers. Moreover, increases in (personal) job insecurity in the 2010s have not yet translated into rising perceptions that immigrants take jobs.
Improved employment and crime rates have probably weakened the immigration backlash. But could changes in immigration levels or the type of immigration have also played a role? As Table 3.3 shows, the net migration rate in fact rose during the Howard era, and stayed high during the early Rudd years. Claiming, therefore, that greater acceptance of immigration levels was a ‘thermostatic’ response (Wlezien 1995) to reduced immigration levels is inconsistent with the facts.4
Numbers are only one part of the puzzle. The type of immigration may also concern voters. Authors like Goot and Watson (2005: 184) as well as former prime minister Tony Abbott claim Coalition policies restored confidence in immigration (Shanahan and Kelly 2010).5 The argument goes as follows: once the Howard government encouraged skilled migrants over family resettlement (Phillips 2006), confidence rose.
This hypothesis is hard to explore without data on whether voters endorsed, or even recognised, this policy shift. However, the detail may not have mattered. There are reasons to expect such a shift in voter sentiment – without assuming voters knew such detail. Building on earlier analysis (Goot and Watson 2005, 182), Table 3.3 shows the Coalition leading Labor on the immigration issue in five of the last seven elections for which there is data.6 Their leads ranged from 12 per cent to 27 per cent. It follows that voters are more accepting of immigration numbers when their preferred ‘manager’ of this program is in power. By contrast, Labor has not held a decisive lead on immigration at any of these elections.
The Coalition’s long-standing lead on immigration policy relates to its ability to frame immigration politics. This applies not only to immigration and ‘border protection’ policies when in office, but to the pursuit of immigration themes when Labor governs. Opposition Leader Tony Abbott relentlessly pursued Labor over renewed boat arrivals after Labor in government dismantled the Pacific Solution. Labor policy was reframed as a loss of control over Australia’s borders at a time of global risk and insecurity.
Table 3.3: Drivers of anti-immigration sentiments, 1996–2016.
| 1996 | 1998 | 2001 | 2004 | 2007 | 2010 | 2013 | 2016 | Change | |
|---|---|---|---|---|---|---|---|---|---|
| Reduce immigration | 63 | 48 | 37 | 35 | 46 | 52 | 41 | 42 | -21 |
| Immigrants take jobs | 41 | 37 | 35 | 30 | 29 | 35 | 35 | 30 | -11 |
| Immigrants increase crime rate | 52 | 47 | 47 | 41 | 43 | 43 | 40 | 37 | -15 |
| Immigrants make Australia more open | 79 | 80 | 75 | 81 | 78 | 69 | 73 | 70 | -9 |
| Measure of job insecurity# | -- | 42 | 36 | 24 | 14 | -- | 33 | 37 | -- |
| ABS unemployment measure* | 15.8 | 15.5 | 14.3 | 12.7 | 11.0 | 13.0 | 14.3 | 14.8 | -1.0 |
| Net migration rate## | 0.58 | 0.43 | 0.71 | 0.50 | 1.12 | 0.79 | 0.94 | 0.80 | +0.32 |
| Coalition lead on best on immigration | +26 | -3 | +27 | +18 | -2 | -- | +16 | +12 | -14 |
| Incumbent party at federal election | Labor | Coal. | Coal. | Coal. | Coal. | Labor | Labor | Coal. |
Source: AES 1996–2016 (weighted for 2010–2016).
Notes: Most AES data is taken from Cameron and McAllister (2016, 40). # AES data on job insecurity for AES 1998–2007 is a general measure of voter assessment of difficulty in finding a job while AES 2013–2016 data measures personal difficulty; see Appendix Table 3.A1 for details.
* Derived combined unemployment and underemployment statistics (seasonally adjusted) for quarterly data closest to the date of respective federal elections, and available from Australian Bureau of Statistics, Labour Force 6202.0 Excel files (Spreadsheet 22).
## Phillips et al. (2010) and author calculations from (ABS) 3101.0 Australian Demographic Statistics (Sept. 2016).
One further possible factor in greater acceptance of immigration levels relates to political learning. The ongoing contest over immigration in the public sphere encouraged by activists has ‘educated’ the public. The result has been the emergence of a constituency in favour of asylum seekers and high levels of immigration. There is now international evidence to support this hypothesis, in that immigration attitudes are becoming more polarised over time (Bohman and Hjerm 2016). The clear implication here is that partisan politics is becoming central to the shaping of support and opposition to immigration.
The story is slightly more complex than one stressing partisanship. When we look at trends in attitudes to immigration levels, they actually appear to be losing some of the partisan character. By contrast, attitudes to asylum seeker arrivals, discussed further in the next section, are becoming more partisan.
Table 3.4 shows that, between 1996 and 2016, there have been particularly large falls in anti-immigration preferences among respondents aged under 40 years and among those living in big cities (30 and 27 percentage-point declines respectively). Some of the fall can be attributed to the shifting social demography of the younger electorate as it acquires even more education: the views of younger Australians overlap considerably with the pro-immigration preferences of the university-educated cohort.
Coalition voters have become significantly more accepting of current immigration levels. Again, compositional change may play some role here. For example, some of the Coalition’s most strongly anti-immigration voters defected to populist right parties in 2016. This had the effect of shifting average Coalition voter preferences on immigration in a liberal direction.
So, in sum, One Nation’s return does not appear to be the product of rising opposition to immigration levels. Its return appears to have had its basis in short-term political opportunities, perhaps without the sustaining ‘resource’ of widespread anti-immigration feeling.
Table 3.4: Patterns of opposition to immigration levels (1996 v 2016) and boat arrivals (2001 v 2016), %.
| Opposition to current immigration levels | Opposition to asylum seekers (turn back boats) | |||||
|---|---|---|---|---|---|---|
| 1996 | 2016 | change | 2001 | 2016 | change | |
| Voting | ||||||
| Overall | 63 | 42 | -21 | 62 | 48 | -14 |
| Labor | 53 | 38 | -15 | 53 | 38 | -15 |
| Coalition | 71 | 46 | -25 | 75 | 64 | -11 |
| Greens | -- | 11 | -- | 32# | 10 | -22 |
| Populist right* | -- | 71 | -- | 85# | 78 | -7 |
| Demographics | ||||||
| Women | 65 | 41 | -24 | 61 | 40 | -21 |
| Men | 62 | 43 | -19 | 63 | 55 | -8 |
| University degree | 42 | 25 | -17 | 38 | 34 | -4 |
| No degree | 68 | 51 | -17 | 78 | 56 | -22 |
| Age under 40 | 65 | 35 | -30 | 55 | 32 | -23 |
| Born in Australia | 67 | 43 | -24 | 64 | 47 | -17 |
| Large city | 60 | 33 | -27 | 55 | 42 | -13 |
| Middle class | 56 | 33 | -23 | 57 | 41 | -16 |
| Working class | 70 | 51 | -19 | 66 | 56 | -10 |
| Battlers* | 76 | 52 | -24 | 64 | 54 | -10 |
Sources: AES 1996 (N=1,797), 2001 (N=2,010), 2016 (weighted).
Notes: # sample size<100. * For populist right parties’ classification in 2016, see footnote 3; in 2001, populist right voters are One Nation voters in either the House of Reps or Senate. * Battlers defined as McAllister and Makkai do in Chapter 6.
Trends in Australian attitudes to asylum seekers: the unsettled politics of offshore detention policies
Since 2001, the Coalition has taken a ‘hard-line’ position towards asylum seekers who arrive by boat, offshore detention, and visas for asylum seekers (Kelly 2017 summarises the Coalition’s position). The electoral payoff was significant. Prime Minister Howard’s response to the Tampa incident and policy of offshore detention helped win back One Nation voters at the 2001 elections (McAllister 2003). With Labor coming to adopt policies of offshore detention, creating bipartisan support for Australia’s hard-line approach, it might follow that the public remains overwhelmingly committed to this policy consensus. In fact, by 2016, the policy of boat turnbacks no longer attracted majority support, and stood at 48 per cent (see Table 3.4; Figure 3.1). Opposition to the policy has climbed to around one third of the voting population since 2013 (Cameron and McAllister 2016, 96).7
What has produced this shift in public opinion, and what groups of voters have shifted most? Women have shifted against the turnback policy more than men have, with support falling a dramatic 22 percentage points between 2001 and 2016. There is now a clear gender divide on this policy question in keeping with other findings in Chapter 5. Not surprisingly, younger voters (under 40 years) have also moved more sharply away from boat turnbacks than older voters. Voters without a university degree have also shifted in the same direction, with the gap between degree-educated voters and those without degrees narrowing sharply from 40 per cent in 2001 to 22 per cent in 2016. This result may be an indication that the politics of opposing hard-line asylum policies has moved beyond the ‘university campus’, as it were, and now has broader influence on centre-left voters, particularly women. But working-class and ‘Battler’ voters (see Chapter 6) have shifted less on turnbacks – 10 per cent declines for both groups. Working-class and battler men remain on balance supporters of these tough policies.
Table 3.4 also reveals much sharper polarisation by party on asylum seeker policy. Coalition and One Nation/populist right voters maintain agreement with boat turnbacks by large majorities (64 and 84 per cent respectively). Labor voters agree less (38 per cent) and Greens voters are sharply opposed (10 per cent agree). When attitudes to immigration levels and boat turnbacks are compared, we can also see the particular impact of the politics of asylum seeking in operation. Table 3.4 suggests that, by 2016, there are now relatively small partisan divides between Labor and Coalition voters about the level of immigration. By contrast, the political divides on refugees are large and expanding.
In 2001, a sizeable share of voters who supported immigration opposed asylum seeker arrivals. They were more inclined to see asylum seekers as a separate problem from immigration – speculatively, what Howard-era policy tried to establish. By 2016, attitudes were in closer alignment. Voters who support immigration levels are now more likely to reject hard-line asylum policies. And the same goes for the tightening relationship between those who reject current immigration levels and support tough asylum policies. This ‘convergence’ is depicted in Figure 3.1. A simple measure (Gamma scores) that tracks consistency of individual voter opinion between the two survey items rose from 0.58 in 2001 to 0.69 in 2016.8
Figure 3.1 Opinions about lower immigration and turning back asylum boats start to converge, 2001–2016, %.
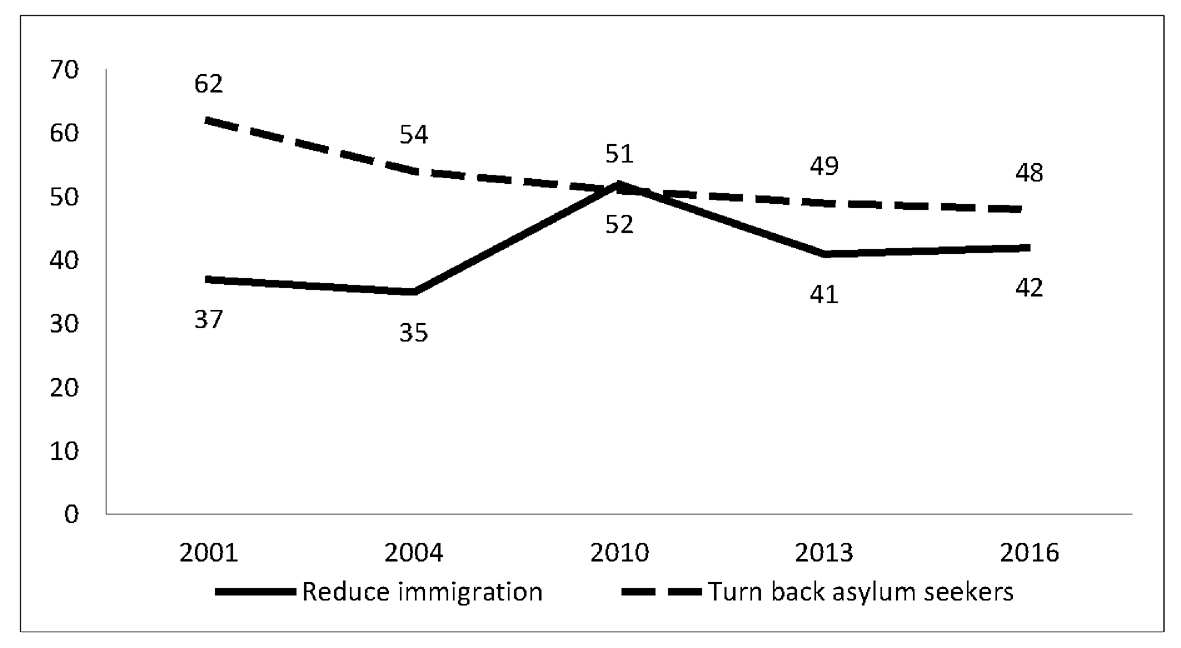
Source: AES 2001–4; 2010–16 (weighted).
Labor, the working class, and asylum seekers
Political polarisation over asylum policy has had its largest impact on the Labor Party. The Coalition have consistently embraced a ‘hard-line’ policy on asylum seekers and the Greens have opposed this policy consistently and vociferously (Wilson 2016). By contrast, Labor has struggled to define itself consistently on these issues since then Labor leader Kim Beazley yielded to Prime Minister Howard’s decision to turn back the Tampa, begin offshore detention, and excise Australian territorial islands from the nation’s migration zone (Phillips and Spinks 2013). However, the Rudd Labor government did end up dismantling the Pacific Solution. This decision invited attack from the Coalition, who blamed the policy for causing a rapid increase in boat arrivals, numbers of people in detention, and deaths at sea. In 2013, Kevin Rudd decided to reverse Labor’s earlier ‘liberal’ position in his very short second term as prime minister. He effectively endorsed a Coalition approach to this issue via the construction of an offshore detention centre on Manus Island.
Why so much policy instability from Labor? As we shall see, the reasons for this go beyond criticisms of political indecision. Labor’s uncertainty over the issue emerges from the policy preferences of its long-time electorate of working-class voters, as Table 3.5 illustrates. Overall, in 2016, Labor won self-identified working-class voters by 9 points – not a particularly large margin in historical terms, but still a handy lead. However, when we consider Labor’s two-party vote from a smaller sample of working-class voters who support boat turnbacks, Labor’s vote drops by a substantial 9.5 points (see column 2). To be expected, Labor does much better among working-class voters who support redistribution of income (60 per cent voted ALP). But when we look at working-class voters who support both turnbacks and redistribution, we see that Labor’s two-party vote stays at just 50 per cent (column 4).
Labor’s hesitation, then, emerges out of bitter electoral experience with more liberal asylum policies and the reaction to these policies by an important voter base. The ALP’s troubles on this issue have not ended there. Middle-class, left-leaning voters prefer the Greens’ unambiguous opposition to asylum policies over Labor’s more accommodating and at times unclear position.
Table 3.5: House of Representatives vote in 2016 among self-identified working-class voters by attitudes to boat turnbacks and redistribution.
| Working-class (WC) voters | WC voters agreeing with boat turnbacks | WC voters agreeing with redistribution | WC voters agreeing with both | |
|---|---|---|---|---|
| Coalition | 37 | 46 | 31 | 42 |
| Labor | 42 | 36 | 46 | 40 |
| Greens | 7 | 2 | 8 | 2 |
| Populist right | 5 | 7 | 6 | 7 |
| Other | 10 | 10 | 10 | 9 |
| Labor (two party) | 54.5 | 45 | 60 | 50 |
| N | 927 | 555 | 555 | 329 |
Source: AES 2016 (weighted).
Notes: Self-identified measure of working class. For populist right parties in 2016, see footnote 3. Author’s estimate of the Labor two-party vote. Sample weighting produced a much high ‘Other’ vote, but the two-party Labor votes on unweighted and weighted samples varied very little.
In suggesting that asylum seeker politics is polarised into two constituencies, I am not claiming these groups are of equal size, or that public opinion does not sway against the direction of policy in the ways that Wlezien (1995) and Stimson (2004) have suggested. Indeed, it appears to do just that. For example, a substantial minority of voters appear to have rejected the hard-line Pacific Solution in the lead-up to the 2007 defeat of the Howard government. But voters eventually rejected Labor’s liberal approach after 2007, forcing the ALP government into humiliating retreats that culminated in its election-eve Manus Island proposals of 2013.
As the breakdown of voter attitudes in the two Essential polls presented in Table 3.6 shows, part of the electorate does react against the policy direction of the ruling party. The first poll was taken under Labor just before Kevin Rudd resigned as prime minister in 2010. A clear majority of voters believed that the Labor government was ‘too soft’ on asylum seekers (65 per cent agreed). This was a view shared by practically all Coalition voters (90 per cent) and a majority of ALP voters (56 per cent).
The second poll was taken in November 2016 during Malcolm Turnbull’s time as prime minister. It is clear that the public had shifted substantially again, this time in reaction to the Coalition’s Operation Sovereign Borders, which Malcolm Turnbull preserved as prime minister. While most Coalition voters believed that their government had got it ‘about right’, Labor and Greens voters on balance considered the policy ‘too hard’. In Labor’s case, those results produced a net lead for ‘too hard’ of 14 per cent in 2016, but this lead was dramatically higher among Greens at 40 per cent.
So clearly, as well as following distinctly partisan patterns, elements of the public react to the asylum policies of the government of the day. In Labor’s case, it was vulnerable to widespread perceptions that it was ‘too soft’ after dismantling the Pacific Solution. In the Coalition’s case, reports of inhumane conditions in offshore detention and breaches of international law upset centre-left voters. The result is that a substantial electorate unhappy with tough policies emerges during Coalition rule.
Table 3.6: Agree that the government is too hard (soft) on asylum seekers, %.
| April 2010 poll under Labor (under PM Rudd) |
Most recent poll under Coalition (November 2016) | |||||
|---|---|---|---|---|---|---|
| Too hard | Too soft | Net too hard | Too hard | Too soft | Net too hard | |
| Overall | 6 | 65 | -59 | 23 | 24 | -1 |
| Coalition | 3 | 90 | -87 | 9 | 22 | -13 |
| Labor | 6 | 56 | -50 | 37 | 23 | +14 |
| Greens | 24 | 25 | -1 | 54 | 14 | +40 |
Source: Essential Poll 2010 (6 April; N=1,009); 2016a (8 November; N=1,008).
Notes: Questions: ‘Do you think the Federal Labor government is too tough or too soft on asylum seekers or is it taking the right approach?’ (6 April) and ‘Do you think the Federal Liberal/National Government is too tough or too soft on asylum seekers or is it taking the right approach?’ (November 8).
Explaining resistance to immigration levels and asylum seekers: regression analysis
To further explore demographic and attitudinal factors that shape public opinion on immigration levels and boat turnbacks, we can specify regression models that capture likely influences. The two dependent variables are statements on (i) the immigration level and (ii) agreement with boat turnbacks. Demographics in the models include: gender, age in years, income (measured on a 22-point scale), education (university degree/none), self-identified class status (working class/not), religiosity (frequency of attendance; 6-point scale), and location (lives in big city/does not). To test the impact of voting and job insecurity, two dummy variables are specified: the first captures Coalition voting (versus all others), and the second is a 4-point measure of voter difficulty in finding a new job in the next 12 months. For details, see Appendix Table 3.A1.
Attitude scales are included in the extended-model scenarios for both statements (see Models 2 and 4 in Table 3.7). The first is a 20-point scale constructed out of four items on voters’ assessments of characteristics of immigrants (increase crime, take jobs, good for the economy, and make Australia open to ideas and cultures). The second captures voter concern about law and order threats (stiffer sentences for law-breakers). And the third captures voter concern over fiscal threats (prefer lower taxes to more social spending).9 Again, refer to Appendix Table 3.A1 for details. The hypotheses explored here are that negative views of immigration levels and boat arrivals depend on particular threats from immigrants (i.e. taking jobs) as well as beliefs about associations between migration and threats to law and order and fiscal stability.
A standard way of modelling dependent variables as 5-point Likert scales is to specify ordered logit models. However, these models performed poorly on the test of parallel lines, so they were re-specified as partial proportional odds models (Williams 2005). These models allow the specified relationship between some of the independent variables and the response variable to vary by the level of the independent variable. Analysis was undertaken in Stata/IC14.2 using gologit2 software and an ‘autofit’ modelling option. The results are presented in Table 3.7.
Supporters of reduced immigration (Model 1) are likely to be working-class self-identifiers, experience job insecurity, be less religious, and earn lower incomes. Although coefficients vary, supporters of reduced immigration are also more likely to be Coalition voters, not hold degrees, and live outside big cities. Overall, this profile suggests that lower-income, insecure voters who live outside large cities – i.e. the kind of voters who are attracted to One Nation – are most likely to seek reduced immigration.
When attitudinal measures are included, they dominate the results as presented in Model 2, rendering most demographic variables insignificant. Not surprisingly, holding negative views about immigrants is the most powerful predictor of preferring lower immigration. However, preferences for stiffer sentences for law-breakers and preferring lower taxes are also strong predictors. Results can be interpreted as suggesting that voters who prefer reduced immigration see immigrants as contributing to crime, greater social expenditures, and more competition for jobs. Immigration is thus construed as a very broad threat to social and economic security.
Turning to support for refugee boat turnbacks (Model 3 and 4), a similar picture emerges. However, there are differences too. Men, low-income earners, working-class identifiers, Coalition voters, and respondents outside big cities are all significantly more likely to approve of turnbacks, with older voters and non-degree holders tending in a similar direction in most comparison scenarios. Again, attitudinal responses dominate Model 4 when they are included, but importantly, men remain significantly more likely to support turnbacks.
To summarise, the demographics of respondents seeking lower immigration and boat turnbacks are similar. Based on these findings, we can surmise that these voters see immigrants and asylum seekers as a threat to security across several dimensions. By contrast, support for current immigration levels emerges from a different electorate made up of the city-dwelling educated middle class. Supporters of liberal refugee policies also have these characteristics but that ‘coalition’ of support weakens significantly among Coalition voters and men.
Considering the contrasting features of these constituencies, it makes sense to interpret the conflict as a sociocultural one, between the ‘cosmopolitan’ outlooks of younger, educated cosmopolitans and the ‘white ethnocentrism’ of an older regional Australia. But economic and employment insecurity plays a role in shaping attitudes, especially attitudes towards boat turnbacks (Models 3 and 4).
Table 3.7: Ordinal regression models on immigration levels and asylum turnbacks.
| Panel 1: Reduce level of immigration | ||
|---|---|---|
| Model 1 | Model 2 | |
| Demographics | ||
| Female | -0.16 | -0.11 |
| Older | 0.00 | 0.01 |
| Income | -0.01 | -0.00 |
| Degree | -0.67** | -0.08 |
| Working class ID | 0.53** | 0.14 |
| Religiosity | -0.05* | -0.07** |
| Live in big city | -0.56** | -0.31** |
| Coalition voter | 0.58** | 0.12 |
| Job insecurity | 0.18** | 0.06 |
| Attitudes | ||
| Law and order scale | -- | 0.16** |
| Lower taxes scale | -- | 0.17** |
| Immigration scale | -- | 0.56** |
Source: AES 2016. Notes: Dependent variable is 5-point scale from ‘Increase a lot’ through to ‘Decrease a lot’; *p<0.05; **p<0.01; Pseudo R-squares: Model 1: 0.06 (n=1,996); Model 2=0.26 (n=1,958); intercept values not reported.
| Panel 2: Approve of turning back boats carrying asylum seekers | ||
|---|---|---|
| Model 3 | Model 4 | |
| Demographics | ||
| Female | -0.62** | -0.72** |
| Older | 0.01** | 0.02** |
| Income | -0.02* | -0.01 |
| Degree | -0.64** | -0.07 |
| Working class ID | 0.52** | 0.11 |
| Religiosity | -0.01 | -0.03 |
| Live in big city | -0.23** | 0.09 |
| Coalition voter | 1.28** | 0.94** |
| Job insecurity | 0.16** | 0.08 |
| Attitudes | ||
| Law and order scale | -- | 0.43** |
| Lower taxes scale | -- | 0.31* |
| Immigration scale | -- | 0.38** |
Source: AES 2016. Notes: Dependent variable is 5-point scale from ‘Strongly approve’ through to ‘Strongly disapprove’; *p<0.05; **p<0.01; Pseudo R-squares: Model 1: 0.09 (n=1,986); Model 2=0.24 (n=1,950); intercept values not reported.
Varieties of anti-immigration politics: 457s and ‘Muslim immigration’
Lastly, we consider public opinion on two important topics in the recent immigration debate: temporary labour migration and, to adopt crude political shorthand, ‘Muslim immigration’. As noted earlier, Australians are not particularly resistant to immigration in comparative terms. This may reflect better post-GFC economic conditions in Australia. However, as is apparent from results in Table 3.1, public opinion on ‘foreign workers’ in Australia was more negative.
Why is the presence of foreign workers a problem for some voters? The use of short-term 457 visas grew over time. In Western Australia, 457s were focused on mining and construction, but across Australia, demand for 457s in 2013 was expanding fastest in industries such as accommodation and food services and retail trade (Larsen 2013). The countries of origin of 457 visa holders in 2013 included India (21 per cent), the United Kingdom (19 per cent), Ireland (10 per cent) and the Philippines (6 per cent) (Larsen 2013). Supporters claim that temporary work programs give business flexibility to meet demand for labour where there are shortages and gives foreign workers opportunities to earn better wages and use their skills. Critics point to exploitative practices by unscrupulous employers who they say use the scheme to undercut wages and working conditions. They also highlight the availability of unemployed locals. Voter apprehension is evident. An Essential Poll from November 2016 indicated that 64 per cent of Australians would support ‘Government legislation to reduce the number of overseas workers being brought to Australia under short-term 457 visas’ (Essential Poll 2016b). The Turnbull Government’s reforms to temporary work visas in 2017 must be read in this light.
Table 3.8 offers insight into the contours of unpopularity of 457s. Asking about migration priorities, Essential Poll data suggests that Labor voters are more concerned about the use of ‘foreign workers under short term (457) visas each year’ (29 per cent). Just 26 per cent of Labor voters nominated ‘the arrival of asylum seekers by boat each year’. By contrast, Coalition voters prioritised concerns about asylum seekers over 457 migration by an overwhelming margin, 51 per cent to 19 per cent. Greens voters were least likely to have any concern (32 per cent); among those who did, most chose the ‘overall increase in Australia’s total population’ option (25 per cent).
The figures point to the varieties of anti-immigration themes in Australian society. Coalition and populist right voters resist immigration for reasons of both security and ethnocentrism. Labor voters are more resistant to immigration for reasons of employment threat – perhaps both the job competition it implies and the threat to wages and conditions from exploitative elements of migration schemes. Greens voters are most resistant to immigration for reasons of environmental threat, i.e. the impact of population growth in fragile ecosystems. Given the increasing publicity and concern about abuses under the 457 visa system, immigration politics in Australia may well focus in future years on the extent of labour-based migration and the limited protections for workers available under these schemes (Kelly 2017). Indeed, the Turnbull government’s decision to modify this scheme in 2017 is the first direct evidence of this impact.
Finally, to the politically charged question about the migration of people who express a Muslim faith or originate from so-called ‘Muslim countries’. An Essential Poll from September 2016 found 49 per cent support in response to the question, ‘Would you support or oppose a ban on Muslim immigration to Australia?’ The finding attracted major attention in politics and the media. A subsequent Essential Poll from February 2017, taken at the time of the Trump administration’s proposed ban, found a lower 41 per cent support in response to the question, ‘Would you support or oppose the Australian government instituting a similar ban on people from Muslim countries from entering Australia?’ These results suggest a substantial minority of Australians are prepared to consider more exclusionary migration policies. Presumably, these results are a response to ongoing violent conflicts and terrorist action internationally, and to the populist politics they have fortified.
Table 3.8: Voter immigration concerns: boat arrivals versus foreign workers, %.
| Total | Labor | Coalition | Greens | |
|---|---|---|---|---|
| The arrival of asylum seekers by boat | 36 | 26 | 51 | 17 |
| The use of foreign workers under short-term (457) visas | 21 | 29 | 19 | 18 |
| The overall increase in Australia’s total population | 20 | 22 | 16 | 25 |
| None of them | 17 | 18 | 10 | 32 |
| Don’t know | 6 | 5 | 4 | 8 |
Source: Essential Poll (2016b; N=1,012).
Markus (2016) disputed Essential’s findings on Muslims in his annual Mapping Social Cohesion report, challenging both the methodology (online panels produce socially undesirable responses) and the question selected for this poll. Markus agrees that negative opinions about Muslims are relatively high – in his research, around 25 per cent of the population offer such opinions. But his study finds lower hostility towards Muslims than implied by Essential. Moreover, he notes the stability in Australian attitudes towards Muslims over the past few years (2016, 44). Taking due note of Markus’ observations about panel surveys, one might add that Markus’ question asks about Muslims in general, and not about Muslim immigration. Accordingly, the question may not fully capture public desire to limit further immigration from these groups in the current political climate.
Table 3.9: Attitudes to multiculturalism and Muslim immigration, %.
| Total ‘positive’ response | Total ‘negative’ response | Net ‘positive’ response | |
|---|---|---|---|
| Multiculturalism has been good for Australia # | 83 | 12 | +71 |
| Immigrants make Australia more open to ideas and cultures * | 69 | 10 | +59 |
| Overall, has multiculturalism (that is, the acceptance of people from different countries, cultures and religions) made a positive or negative contribution to Australian society? ## | 61 | 23 | +38 |
| Is your personal attitude positive, negative or neutral towards Muslims? # | -- | 25 | -- |
| Are you concerned about the number of Muslim people in Australia? (total not concerned=column 1; total concerned=column 2) ## | 42 | 53 | -11 |
| Please say whether you support or oppose Muslim immigration (total support=column 1; total do not support=column 2) ** | 59 | 32 | +27 |
| When a family applies to migrate to Australia, should it be possible for them to be rejected purely on the basis of their religion? (should not be rejected=column 1; should be rejected=column 2) ## | 56 | 24 | +32 |
| Would you support or oppose a ban on Muslim immigration to Australia? (oppose=column 1; support=column 2) ## | 40 | 49 | -9 |
| [2011] In your view, should the Australian government exclude Muslims from our migrant intake? (no=column 1; yes=column 2) ## | 55 | 25 | +30 |
Sources: # Markus (2016c: 50; N=1,002); ## (in order) Essential Poll (2016c; N=1,000); Essential Poll (2016d; N=1,000); Essential Poll (2011; N=1,082); * AES 2016 weighted; **Morgan Poll 2016 (N=656).
Table 3.9 offers insights into the range of opinions about multiculturalism, Muslims, and so-called ‘Muslim immigration’. The sources are the AES, Essential Polls, and the Morgan Poll, as well as Markus’ own research. What is obvious is the extent of variation in responses on similar themes, noting as Markus does the influence of question wording and survey mode. Essential polling, for example, tends to produce the most populist opinion on immigration questions.
The three questions on multiculturalism test opinion about the benefits rather than the principles of multiculturalism (refer to the first three rows of the table). Although the results differ depending on polling agency and the question asked, there is a clear tendency in the data. Most Australians affirm these benefits, with agreement ranging from 61 per cent (Essential) to 83 per cent (Markus).
However, for responses on Muslims and Muslim immigration, the results reflect more serious variation and inconsistency in voter sentiments (refer to the final six rows of the table). Essential detected majority concern (53 per cent) in 2016 about the numbers of Muslims in Australia. But these kind of results bear some similarity to poll results from the 1980s that highlighted alarming resistance to so-called ‘Asian immigration’ (see Markus 2016 who also cites Murray Goot’s work on these polls). Once a real force in public opinion, attitudes to immigrants from Asian backgrounds no longer shape either debate or policy rhetoric to the same extent.
What about attitudes to Muslim immigration? Neither survey item presented in the table produced majority support – an important finding in itself. However, it is clear that, as in the US under the Trump administration, such a policy proposition has substantial minority support. Essential’s polling altered the wording of its question about banning Muslims between 2011 (see final row) and 2016 (see second last row). This change prevents direct comparisons. Still, at least some of the increase in support for such a ban between 2011 and 2016 represents a hardening in attitudes, independent of changes to question wording. It is likely the product of the increased salience of the issue, aided by political events and the emergence of political entrepreneurs on the populist right.
Conclusion
I conclude this chapter by returning to the tasks set out at the beginning. The first is to make an assessment of the relationship between immigration attitudes and opportunities for right-wing populism in Australia, particularly expressed through One Nation. There seems little doubt that strong anti-immigration feeling was a major factor in the emergence of One Nation in the late 1990s. Moreover, attitudes to immigration and race continue to distinguish voters attracted to right-wing populist parties in Australia.
These observations, however, leave us with a puzzle – to explain the revival of One Nation at a time when the available survey evidence suggests a substantial shift away from strongly anti-immigration sentiment in the community and even a slow decline in approval of boat turnbacks. Two possible explanations emerge. The first is that political opportunities, relating to both the leadership of the federal Coalition and ongoing external threats posed by violent extremism, revived voter interest in One Nation, particularly in Queensland. The second is that One Nation’s recovery has been only partial, perhaps because the Party has lacked the ‘resource’ of widespread anti-immigration feeling needed to capitalise on short-term political opportunity and to overcome its organisational problems.
Certainly, this chapter has pointed to evidence that underlines the continuing importance of anti-immigration and anti-asylum seeker sentiment in Australian politics, with voters associating immigration with ‘threats’ of various kinds. Bi-partisan support in favour of tough asylum policies is the best evidence of the power of a solid constituency that holds these sentiments, especially when it is mobilised by political parties. However, broader shifts in attitudes across the community indicate that, at least for the time being, there is a larger constituency in favour of current immigration levels and more liberal asylum policies than there was two decades ago. Public opinion on immigration in Australia, I speculate, may have undergone a period of ‘political learning’ as a result of debate and protest on both sides, and as a result, it is now more contested political and policy territory. Still, it remains to be seen whether this larger pro-immigration constituency would hold together, especially if anti-immigration sentiment is stimulated by a slowdown in wages growth and related cost of living pressures.
References
Australian Bureau of Statistics (2016). Australian Demographic Statistics, September 2016. Catalogue No. 3101.0.
Australian Election Study (2016). The AES series: 1996–2016. http://www.australianelectionstudy.org/voter_studies.html.
Bohman, Andrea and Mikael Hjerm (2016). In the wake of radical right electoral success: a cross-country comparative study of anti-immigration attitudes over time. Journal of Ethnic and Migration Studies 42(11), 1729–47.
Cameron, Sarah M. and Ian McAllister (2016). Trends in Australian political opinion: results from the Australian election study, 1987–2016, ANU: School of Politics and International Relations. http://www.australianelectionstudy.org/publications.html.
Central Intelligence Agency (2016). Net migration rate. https://www.cia.gov/library/publications/the-world-factbook/rankorder/2112rank.html.
Essential Poll (2010). Federal Labor’s approach to asylum seekers. 6 April. http://www.essentialvision.com.au/too-soft-or-too-tough-on-asylum-seekers-9.
Essential Poll (2011). Muslim migrants. 28 February. http://www.essentialvision.com.au/muslim-migrants.
Essential Poll (2016a). Too soft or too tough on asylum seekers. 8 November. http://www.essentialvision.com.au/too-soft-or-too-tough-on-asylum-seekers-9.
Essential Poll (2016b). 457 visas. 22 November. http://www.essentialvision.com.au/457-visas.
Essential Poll (2016c). Contribution of multiculturalism. 11 October. http://www.essentialvision.com.au/contribution-of-multiculturalism-4.
Essential Poll (2016d). Ban on Muslim immigration. 21 September. http://www.essentialvision.com.au/ban-on-muslim-immigration.
Goot, Murray and Ian Watson (2005). Immigration, multiculturalism and national identity. In Australian social attitudes: the first report. Shaun Wilson et al., eds. 182–203. Sydney: UNSW Press.
Goot, Murray and Ian Watson (2011). Population, immigration and asylum seekers: patterns in Australian public opinion, Department of Parliamentary Services (Pre-election Policy Unit). Canberra: Parliamentary Library.
Green, Antony (2016). One Nation support at the 2016 federal election. http://blogs.abc.net.au/antonygreen/2016/07/one-nation-support-at-the-2016-federal-election.html.
Hainmueller, Jens and Michael J. Hiscox (2010). Attitudes toward highly skilled and low-skilled immigration: evidence from a survey experiment. American Political Science Review 104(1), 61–84.
Inglehart, Ronald F. and Pippa Norris (2016). Trump, Brexit, and the rise of populism: economic have-nots and cultural backlash. Faculty Research Working Paper Series, John F. Kennedy School of Government (RWP16-026), August. https://research.hks.harvard.edu/publications/getFile.aspx?Id=1401.
ISSP Research Group (2015). International Social Survey Programme: National Identity III – ISSP 2013. GESIS Data Archive, Cologne. ZA5950 Data file Version 2.0.0 https://dbk.gesis.org/dbksearch/sdesc2.asp?ll=10¬abs=&af=&nf=&search=&search2=&db=e&no=5950.
Kelly, Paul (2017). The next populist showdown is all about immigration. Australian. 4 March. http://www.theaustralian.com.au/opinion/columnists/paul-kelly/next-populist-showdown-is-all-about-immigration/news-story/2bd84bdb6c3c5be77c3e67683d8dab3a.
Larsen, Gareth (2013). The subclass 457 visa: a quick guide. http://www.aph.gov.au/About_Parliament/Parliamentary_Departments/Parliamentary_Library/pubs/rp/rp1314/QG/Subclass457Visa.
Markus, Andrew (2016). Mapping social cohesion: the Scanlon Foundation surveys 2016. Melbourne: Monash University, ACJC, Faculty of Arts. http://scanlonfoundation.org.au/wp-content/uploads/2016/11/2016-Mapping-Social-Cohesion-Report-FINAL-with-covers.pdf.
Marr, David (2017). The white queen: One Nation and the politics of race. Quarterly Essay 65, 1–102.
McAllister, Ian (2003). Border protection, the 2001 Australian election and the Coalition victory. Australian Journal of Political Science 38(3), 445–63.
Meagher, Gabrielle and Shaun Wilson (2006). After Howard’s decade, is Australia more conservative? Australian Review of Public Affairs. http://www.australianreview.net/digest/2006/02/meagher_wilson.html.
Morgan Poll (2016). Majority of Australians support Muslim and asylum seeker immigration. 25 October. http://www.roymorgan.com/findings/7017-australian-views-on-immigration-population-october-2016-201610241910.
Mudde, Cas (2013). Three decades of populist radical right parties in Western Europe: so what? European Journal of Political Research 52(1), 1–19.
Phillips, Janet (2006). Skilled migration to Australia. http://www.aph.gov.au/About_Parliament/Parliamentary_Departments/Parliamentary_Library/Publications_Archive/archive/Skilledmigration.
Phillips, Janet, Klapdor, Michael and Simon-Davies, Joanne (2010). Migration to Australia since federation: a guide to the statistics. http://www.aph.gov.au/About_Parliament/Parliamentary_Departments/Parliamentary_Library/pubs/BN/1011/MigrationPopulation#_Toc270677557.
Phillips, Janet and Harriet Spinks (2013). Immigration detention in Australia. http://www.aph.gov.au/About_Parliament/Parliamentary_Departments/Parliamentary_Library/pubs/BN/2012-2013/Detention.
Rydgren, Jens (2008). Immigration sceptics, xenophobes or racists? Radical right-wing voting in six West European countries. European Journal of Political Research 47: 737-765.
Shanahan, Dennis and Paul Kelly (2010). We must restore confidence: Tony Abbott. Australian, 10 August. http://www.theaustralian.com.au/national-affairs/we-must-restore-confidence-tony-abbott/news-story/400c351e9433bbb2fa4618755890b115.
Sherell, and Mares, Peter (2016). How many migrants come to Australia each year? Inside Story. http://insidestory.org.au/how-many-migrants-come-to-australia-each-year.
Stimson, James (2004). Tides of Consent. Cambridge: Cambridge University Press.
Weatherburn, Don (2016). Is crime getting worse in Australia? The Conversation. http://theconversation.com/election-factcheck-is-crime-getting-worse-in-australia-60119.
Williams, Richard (2005). Gologit2: a program for generalized logistic regression/partial proportional odds models for ordinal dependent variables. http://www.stata.com/meeting/4nasug/gologit2.pdf.
Williams, Richard (2016). Understanding and interpreting generalized ordered logit models, The Journal of Mathematical Sociology 40:1, 7–20, DOI: 10.1080/0022250X.2015.1112384.
Wilson, Shaun (2016). Labor, the Greens, and the union movement. In How to vote progressive in Australia, Dennis Altman and Sean Scalmer, eds. 203–29. Melbourne: Monash University Publishing.
WIN/Gallup International (2016). WIN/Gallup International’s global poll shows the world is divided on immigration. http://www.wingia.com/web/files/richeditor/filemanager/Immigration_Press_Release_EOY_2015__Finalized_Draft.pdf.
Wlezien, Chris (1995). The public as thermostat: dynamics of preferences for spending. American Journal of Political Science 39(4), 981–1000.
Appendix 3.1
Table 3.A1: Questions in Australian Election Studies series.
| Questions/statements | Scale |
|---|---|
| All boats carrying asylum seekers should be turned back | Strongly agree – Strongly disagree (5 points) |
| Do you think the number of immigrants allowed into Australia nowadays should be reduced or increased? | Increased a lot – Reduced a lot (5 points) |
| Immigrants increase the crime rate | Strongly agree – Strongly disagree (5 points) |
| Immigrants are generally good for Australia’s economy | Strongly agree – Strongly disagree (5 points) |
| Immigrants take jobs away from people who are born in Australia | Strongly agree – Strongly disagree (5 points) |
| Immigrants make Australia more open to new ideas and cultures | Strongly agree – Strongly disagree (5 points) |
| Do you approve or disapprove of the way the Liberal Party handled the leadership change in September of last year, when Malcolm Turnbull replaced Tony Abbott? | Strongly approve – Strongly disapprove (4 points) |
| Please say whether you think the change has gone too far, not gone far enough, or is it about right? [Aboriginal land rights/Equal opportunities for women] | Gone much too far – Not gone nearly far enough (5 points) |
| Would you say the government is run by a few big interests looking out for themselves, or that it is run for the benefit of all the people? | Entirely run for the big interests – Entirely run for the benefit of all (5 points) |
| How does the financial situation of your household now compare with what it was 12 months ago? | A lot better – A lot worse (5 points) |
| On the whole, how satisfied are you with the present state of the economy in Australia? | Scale 0–10 where 0 is extremely dissatisfied and 10 is extremely satisfied |
| Do you personally favour or oppose same sex couples being given the same rights to marry as couples consisting of a man and a woman? | Strongly favour – Strongly oppose (4 points) |
| Big business in this country has too much power | Strongly agree – Strongly disagree (5 points) |
| If you lost your job, how easy or difficult would it be to find another job in the next 12 months? | Very easy – Very difficult (4 points) |
| In your community these days, how easy is it for someone who is trying to find a job to get a good job at good wages? | Very easy – Very hard (4 points) |
1 This survey of public opinion cannot hope to replicate the detailed analysis of polling and data available in Markus (2016) or Goot and Watson (2011). Instead, my main goal is to identify changing patterns of support and opposition to immigration as a way of making sense of opportunities for the growth of right-wing populism.
2 In the AES 2016 sample, populist right voters were identified by any vote in either the House or Senate for the following parties that were classified as having populist right-wing positions in one or more of these areas: race and immigration, Muslims/Islam, law and order, and economic and military nationalism. These parties were: One Nation; Citizens Electoral Council of Australia; Shooters, Fishers and Farmers; Katter’s Australian Party; Rise Up Australia; Derryn Hinch Justice Party; Jacquie Lambie Network; and the Australian Liberty Alliance. The populism of some of these parties is highly politically eclectic (but generally tends to right-wing themes) and the category of populist right used here is not synonymous with extreme right. The corresponding ‘populist right’ vote data in Table 3.1 has been extracted from the Official Results for the House of Representatives at the 2016 federal election (http://results.aec.gov.au/20499/Website/HouseStateFirstPrefsByParty-20499-NAT.htm).
3 For a detailed overview of polling on immigration levels, see Goot and Watson (2011, 20–28).
4 Rising opposition to immigration levels during Labor’s term in office that followed, especially in 2010, may suggest a lagged response to surging migration during the Howard years, but this shift may have been a general response to perceptions of immigration levels under Labor rule.
5 It is certainly the case that ‘skilled migrant’ immigration attracts high voter support (77 per cent) but not significantly more supported than ‘family reunion’ immigration at 75 per cent (see Morgan Poll 2016).
6 Note that there are no figures for 2010.
7 Goot and Watson (2001, 37) comment on the considerable variation of opinions on asylum seeker policy that appears to depend on the question and framing of the question. No doubt, these variations also reflect the genuinely conflicted positions in the opinions of some voters.
8 Gamma (scaled between 0 and 1) measures the level of consistency in responses to the respective items on immigration levels and asylum seekers for individual respondents. A higher Gamma score means more consistency i.e. respondents who want immigration ‘reduced a lot’ more consistently also strongly approve of boat turnbacks.
9 These threat hypotheses are derived from the formulations discussed in Hainmueller and Hiscox (2010), who write of various types of threats that voters fear from migration (job competition and a fiscal burden).