2
Minor and populist parties in Australia: does economic insecurity or a ‘representation gap’ drive support?
Minor and populist parties in Australia
At the beginning of the 21st century, a larger proportion of the world’s population lived in democracies than at any other time in recorded history. Less than two decades later, in many of these democracies trust in leaders, parties and in the institution of democracy itself are at the lowest point they have been in decades (see for instance Cameron and McAllister 2016, 74–5, on trust in Australian political institutions; Heatherington and Rudolf 2015 on the United States; and Armingeon and Ceka 2014 on trust in the European Union). In some cases, nations’ democratic systems are themselves under threat of breaking down (Diamond 2011). This environment creates a breeding ground for insurgent candidates and parties running against the establishment and traditional politics. This chapter examines the role that economic insecurity and poor issue representation play in voters’ support for these kinds of parties.
The growing vote for minor parties and populist candidates in recent years throughout much of the democratic west has been particularly pronounced since the economic shock of the Global Financial Crisis (GFC). In the United States, Donald Trump first captured the Republican nomination and then the presidency in 2016 with ‘anti-system’ and anti-immigrant rhetoric; and from the left, Bernie Sanders came close to winning the Democratic nomination with a platform aimed primarily at reducing the influence of corporate elites and economic inequality. Neither candidate had been a long-term member of their party. Across Europe, the average share of the populist vote in national and European parliamentary elections has increased from approximately 5 per cent in the 1960s to more than 10 per cent in recent years (Inglehart and Norris 2016). This success includes the formation of government in Greece by the populist-left Syriza, which gained office in 2015 in opposition to the austerity measures imposed on the country by its creditors, the European Union and the International Monetary fund. Similarly, in recent years, the perennial (almost) breakthrough party in France, the National Front, has seen a resurgence in support, with its leader Marine Le Pen campaigning on a mix of protectionist economics and opposition to mass immigration; at the same time, an entirely new party captured the presidency and the National Assembly. In the United Kingdom, Nigel Farage led the populist right United Kingdom Independence Party (UKIP) to win its first seats in the British Parliament with an anti-Europe and anti-immigration manifesto; and, with elements of the centre-right Conservative Party, UKIP helped achieve victory for the anti-EU vote in the 2016 ‘Brexit’ referendum. In many cases, these have been political successes that would have been difficult for most scholars and commentators to imagine a few short years ago.
Australia is not immune from the appeals of populism, or new parties challenging the status quo. As Figure 2.1 shows, the share of the vote gained in the Senate by non-major parties and candidates has gradually increased over several decades, burgeoning in 2010 following the GFC and consequent low wages growth (Australian Bureau of Statistics, 2017, Table 1). This high level of minor party support was maintained at the 2013 and 2016 elections.1 This growth, if it continues, may change the electoral balance in favour of a more fragmented party system, making governance more complicated and potentially affecting policy outcomes.
In this chapter, I explore the large vote received by these parties in the Australian Senate at the 2016 election. I examine how this record-high minor party vote may have resulted from a combination of economic insecurity and poor issue representation. Voters who feel the major parties are not providing them with acceptable economic outcomes and policy settings consistent with their preferences are behaving ‘rationally’ by supporting other parties. Although not all the parties and candidates included here are populist in nature, many are. Those that are not populist frequently represent a protest against the established centre-left Labor Party and centre-right Liberal–National Coalition parties, which between them have (in various forms and incarnations) formed the national governments of Australia since 1901.
Figure 2.1 Vote share of minor parties and independents in the Australian Senate, 1949–2016.
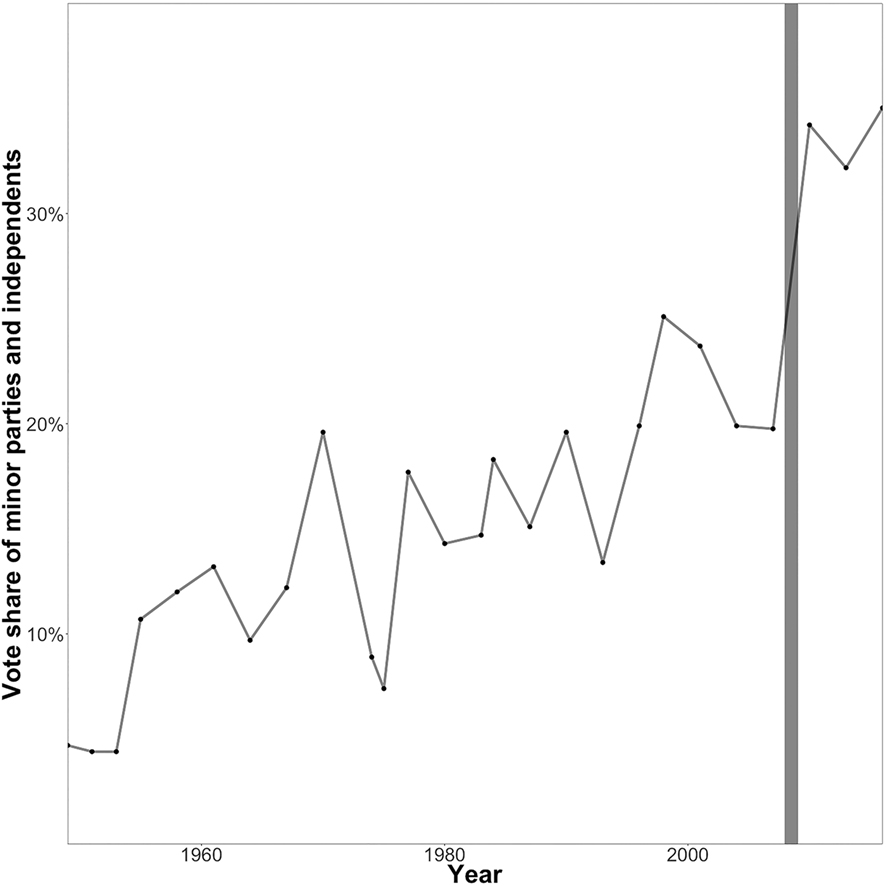
Source: Australian Electoral Commission.
Notes: Each point represents the results of a Senate election. The dark vertical bar represents the approximate period of the global financial crisis.
I use the term minor parties generally to refer to parties not aligned with the established political parties that form government in Australia. Although a substantial literature has grown addressing these types of political actors, there is no single authoritative account with which to classify them. Many of the studies concerning anti-establishment and protest politics focus on populism. However, this term also lacks a widely accepted definition. Mudde (2007) argued that populism was an ideological phenomena, with the ‘nation’ forming the core of the ideology, around which there are three broader features: nativism, authoritarianism, and the championing of the (perceived) general will of ‘the people’ over the preferences of the ‘elite’. Conversely, Moffitt and Tormey (2014) described populisim as a political style – rather than any particular sets of ideologies or policies – which can be used by actors from the far left to the far right, and includes appeals to the people (versus elites), focuses on crises, breakdowns and threats, and involves a rejection of traditional political norms and language.
In this chapter, I examine all non-major candidates and party groups that contested the 2016 Australian Senate election. These parties have been included on several criteria. These include a rejection of either the style or substance of the major parties’ positions (or both). They also focus on issues or policy positions that they see as ‘underrepresented’ by the major parties. These foci include the advocacy of environmentally and socially progressive policies (the Greens) and opposition to free trade, regional economic stagnation, and the decline of manufacturing (the Nick Xenophon Team). They also include opposition to high immigration and the ongoing arrival of asylum seekers (One Nation) and the loss of traditional morality and the diminished role of Christianity in society (Christian parties including Family First and the Christian Democrats). Minor parties also take opposing positions on the welfare state, which is seen as being either too generous (the Liberal Democrats), or not generous enough (the Greens again).
Several explanations help to provide an understanding of the increased support of these parties and candidates in Australia, and other representative democracies, in recent years (or in some cases, decades). One of these is that these parties and candidates represent a temporary ‘glitch’ in the system. In this view, the successes of Donald Trump in the United States, UKIP in the United Kingdom, and One Nation in Australia are an aberration – the result of short-term factors that will dissipate shortly after emerging. However, the relative longevity of the National Front in France, green parties in Germany and Australia, and similar parties in other democracies, suggests this may not be the case. An alternative view suggests new parties, occupying different niches in the political ecosystem, reflect deeper, longer-term social and economic trends.
Economic insecurity as an explanation
One of the most commonly cited reasons for the growth of populist and authoritarian parties, and others challenging the status quo, is the rise in economic insecurity in Western democracies. This phenomenon is often seen as the result of slowing growth and increasing inequality, which places strains on democratic legitimacy and systems of government. The difference between consistent economic growth (three years or more in a row) and malaise (two years of contraction) has been found to increase the probability that a state will revert from a democratic to non-democratic system from less than 1 to nearly 8 per cent (see Przeworski, Alvarez, Cheibub and Limongi 2000, 9). This is not to suggest that the parties I am examining here are anti-democratic, or that established democracies are necessarily at risk, but to highlight the stresses that economic stagnation can place on the established norms and traditions that are required to maintain democratic systems. Beyond slower economic growth, several mature liberal democracies have seen a decline in manufacturing employment, an erosion of trade union membership, and the withdrawal of progressive welfare safety nets (Hacker 2006). These economic changes impact upon voters’ perceptions of whether the existing economic and political system is working in their interest.
In a context of shrinking employment opportunities for blue-collar workers and those with fewer formal qualifications, voters with lower levels of economic security (driven by their education and work history, as well as location) may perceive their livelihoods as precarious or declining. This insecurity may, in turn, reduce trust in the established parties to provide outcomes that meet these voters’ expectations. As this form of economic insecurity grows, new parties that are separate from the existing establishment (and therefore able to escape responsibility for any of its shortcomings) can appeal to voters – particularly the less advantaged – by shifting the blame for the financial and consequent social distress of these groups onto others. For example, populism may encourage perceptions that voters exist in a state of ‘zero-sum competition’ with immigrant groups for resources (a frequent target of the populist right), and that free trade reduces their employment opportunities (a claim made by both the populist left and right). Protectionist trade policies, reduced immigration, and the return of manufacturing jobs are offered as panaceas. With centre-left parties generally unwilling or unable to promise the same (relatively) simple-sounding solutions, this account argues, some economically insecure voters have directed their support towards populist parties (see, for instance, Albertazzi and McDonnell 2008; Betz 1994; Ramiro and Gomez 2016). These longer-term trends are likely exacerbated by severe financial crises, which further erode confidence in established political and economic systems, and increase the support of the far right in particular (Funke, Schularick and Trebesch, 2016).
In the Australian context, there have been claims that economic insecurity was one of the significant causes of the rise of the populist One Nation Party between 1996 and 1998 (Turnbull and Wilson 2001). The rapid increase in minor party support in the Australian Senate in 1990 – immediately prior to the beginning of Australia’s worst recession since the Great Depression – and again since 2010 following the GFC, shown in Figure 2.1, supports this assertion. However, this has also been disputed (Goot and Watson, 2001a), and there are other plausible explanations.
Sociocultural explanations
Support for populist protest parties can also be seen as a response to cultural and social change (Inglehart and Norris 2016). According to this account, growth in postmaterialist politics concerning the environment and gender equality, changes in the nature and level of immigration, and increasing social liberalism, incite negative responses from those who disagree with, or feel excluded by, these shifts in social norms. These constituencies include older voters, men, those with lower levels of education, and traditionally dominant groups. These groups sense either that their privileges are being supplanted, or that traditional norms are being undermined (see for instance Inglehart 1990; 1997; Norris 2005).
Frequently, this conflict manifests around concerns about immigration. Goot and Watson (2001b), for instance, see support for One Nation in Australia as primarily a product of racial tensions and a backlash against large-scale Asian immigration. This concern about high levels of immigration and multiculturalism may be the result of perceived competition for tangible resources – employment opportunities, public services and goods – that new arrivals may pose (Campbell 1965; Sherif 1967; Sherif and Sherif 1953). Those most likely to view immigration as a source of competition for scarce resources – and therefore oppose it – include voters without barriers to competition in the employment market. This group includes workers in occupations that do not require specific qualifications (manual occupations, for instance), and who have generally lower incomes.
Concerns about immigration may also derive from social or cultural rather than economic drivers. These are based on the belief that high levels of immigration (and the existence of out-groups more generally) are a threat to the dominant culture (covered by symbolic threat theory, see Blalock 1967; Key 1984 [1949]), as well as the status of the ‘in-group’ in the social hierarchy. These threat perceptions largely relate to the idea that immigrants change the societies they join (described by social dominance theory, see Sidanius and Pratto 1999). It may be that they challenge the dominance of established groups, or that through their mere presence they fundamentally alter the composition of the host society (Sides and Citrin 2007, 491). This effect is particularly strong when the perceived cultural distance between the country of origin and the host society is large (Vala, Pereira and Ramos 2006, 136), which may be mediated by more or less contact with different groups, and the resulting propensity to stereotype and perceive threat from difference (Allport 1954).
In this view, concern about immigration, multiculturalism, and ethnic difference can be the result of socialisation and a lack of positive interaction with out-groups. In support of this theoretical framework, several studies in Australia and elsewhere have found that older voters – who were socialised with different norms concerning immigration – are more likely to oppose immigration (Goot 1993; McAllister 1993). Additionally, there are indications the association between education and support for immigration is as much a product of the socialisation involved in attaining higher levels of education as of the labour market advantages these voters possess (Hainmueller and Hiscox 2007, 437; Sides and Citrin 2007; Wilkes, Guppy and Farris 2008).
Issue representation and support for minor parties
In a context where the established political parties fail to provide policy offerings that are seen to reduce the economic insecurity felt in some parts of society, and which address the concerns of those voters opposed to social change and high levels of immigration, parts of the electorate may feel poorly represented by the political system. This problem creates conditions in which minor parties thrive. Associated with this hypothesis, there has been a growing critique that established parties are no longer willing or able to properly represent the policy interests of different groups in society (Mair 2013; Marsh and Miller 2012). Research from the US and Australia has indicated that, rather than responding to the policy preferences of all parts of the electorate equally, the policy positions adopted by political elites, and public policy outcomes themselves, are more likely to favour the preferences of affluent voters (Bartels 2010; Giger, Rosset and Bernauer 2012; Gilens 2012).
A possible outcome of the outsized influence that economic and cultural elites have on party policy has been the general acceptance of markets as the primary resource allocation mechanism in society. In recent years, a number of scholars, including political scientist Peter Mair (2013, 72) and philosopher Michael Sandel (2012), have raised concerns about this embrace of market economics, and Bob Birell and others have critiqued Australia’s immigration program, which they characterise as primarily serving the interests of business and higher-income professionals (Birrell 2006; Birrell and Healy 2003). These scholars and commentators argue that by failing to provide alternative solutions to problems of economic management, established parties have reduced the functionality (and legitimacy) of liberal representative democracy itself.
With the economic policies of the established parties constrained to market solutions in a range of areas, and social change occurring at a relatively fast pace across several domains in recent decades, there exists the potential for some members of the electorate to feel economically insecure and socially excluded. Even if this group is relatively small, it provides a pool from which some minor and populist parties may recruit voters. Similarly, others may not believe change has occurred fast enough, providing parties supportive of social change (such as the Greens) a base. According to the ‘responsible party’ model, political parties must take stable and clearly differentiated policy positions to provide effective representation (Adams 2001; Esaiasson and Holmberg 1996; Schmitt and Thomassen 1999). If they do not, it becomes difficult for voters to place these parties within a coherent issue space, and therefore decide which party best represents their preferences (Converse 1975; Schmitt and Thomassen 1999; van der Brug 1999). Elements of the literature have found that voters tend to be more satisfied when parties better represent their policy interests (Brandenburg and Johns 2014) and actually provide substantive alternatives (Laver 2011).
A lack of issue representation by the established government-forming parties may result in a dissatisfied electorate,2 one that is willing to show its displeasure through the ballot box. One outlet for expressing dissatisfaction is anti-establishment, populist and insurgent parties. In Australia, New Zealand and Canada, supporters of minor parties on both the left and right expressed higher levels of dissatisfaction with democracy in their country than other voters (Bowler, Denemark, Donovan and McDonnell 2017).
Data sources and measures for economic insecurity
Given the literature documented above, we expect a strong positive relationship between voters’ perceived economic insecurity and the probability they would support a populist, protest or other minor party. More economically insecure voters – those stating that their own economic situation and the state of the wider economy are worse – should be more likely to support these parties, with variation across different types of minor parties. Assuming voters are ‘utility maximisers’ with bounded rationality (see, for instance, Popkin 1991), they should be expected to support the party most likely to govern closest to their preferences – therefore, voters who have issue preferences farther from the policy positions of the established parties are defined as less well represented. When they are poorly represented across a few policy areas – measured here as the average distance between their preferences and the positions of both the Coalition and Labor Party across several issues – they should be more willing to support populist or minor parties taking policy positions closer to their preferences.
These ideas are tested using a novel dataset, collected through an online study of approximately 50,000 voters run by Vox Pop Labs, conducted during and immediately after the 2016 Australian federal election (with respondents recruited through the Vote Compass voter engagement tool during the campaign; see Vox Pop Labs 2016). These data are unique for Australia, in both their sample size and content. They include responses on the positions of both voters and the established parties (Coalition and Labor) on a set of 30 issues, which allows for the measurement of the distance between voter issue preferences and the positions taken by the parties across a range of policy areas. Five questions were also included on economic security, allowing for different dimensions of economic ‘stress’ to be measured. These are then used to model voter behaviour as an outcome of these (and other) factors. Additionally, the large sample provides the opportunity to examine patterns in the support for Australia’s smaller political parties, which might otherwise be difficult to examine in a standard sample with 2,000 observations or less. These are then organised into seven parties or party groups: the Greens (n=19,234); other Minor parties on the left (n=2,635); the Nick Xenophon Team (n=6,429); other parties and independents in the political centre (n=2,384); Libertarians (n=501); the Christian right (n=696); and, the ‘Populist and protest right’ (n=1,839).3 The specific coding of parties into groups can be found in Appendix 2.1.
Table 2.1: Voter economic insecurity (sociotropic and personal).
| Variable | Dimension 1 (sociotropic) | Dimension 2 (personal) |
|---|---|---|
| Economy, next 12 months | .73 | .21 |
| Economy, next 5 years | .80 | .20 |
| Family, next year | .42 | .47 |
| Family, past year | .20 | .95 |
| Good time to buy | .40 | .32 |
Source: Vox Pop Labs post-election survey data.
Notes: Loading of economic security items onto latent traits in an exploratory factor analysis with varimax rotation. Each row in this table represents a survey item. The columns show how strongly these load onto the two economic security dimensions estimated by this analysis. The first column represents sociotropic security and the second personal economic security. A high positive loading of an item on a dimension indicates an issue strongly separates respondents with preferences with high and low security. A value close to zero indicates an item that does a poor job of doing so.
To better understand the effect of economic insecurity on the Australian electorate at the 2016 federal election, five questions were included in the Vox Pop Labs online post-election study. They were: (i) Do you think that during the next 12 months Australia will have good times financially or bad times? (measured on a 2-point scale); (ii) Would you say that you and your family are better or worse off than you were a year ago? (3-point scale); (iii) Do you think now is a good or a bad time to buy major household items? (2-point scale); (iv) Looking ahead, which of the following two scenarios would you say is more likely – Australia will have continuous good times during the next 5 years or so, or Australia will have periods of widespread depression or unemployment? (2-point scale); and (v) Do you think that a year from now, your family will be better off financially, worse off or about the same as now? (3-point scale).
Latent perceptions of economic insecurity are estimated using a two-dimensional factor analysis, with the factor scores produced along each dimension scaled to have a mean of 0 and a standard deviation of 1. The two dimensions are shaped by sociotropic economic insecurity (dimension 1), including the general financial situation of Australia as well as perceptions of the economic situation in the next five years; and perceptions of personal economic security (dimension 2), which were driven by respondents’ retrospective views of their own financial situation. (Responses to questions about whether it was a good time to buy a major household appliance and about expectations of their financial situation loaded about equally onto both dimensions.)
These two measures of economic insecurity can be understood as products of voters’ opportunities and lived experiences. To better understand this, the average insecurity scores (derived from this factor analysis) for different demographics are displayed in Figure 2.2, with the horizontal lines around the midpoint representing 95 per cent confidence intervals. The dashed vertical line is the overall population average. To improve accuracy, these data were weighted using age, sex, industry, geography (federal electoral division), education, religious affiliation, and both previous and current vote choice.
Figure 2.2 Economic security by demographic group.
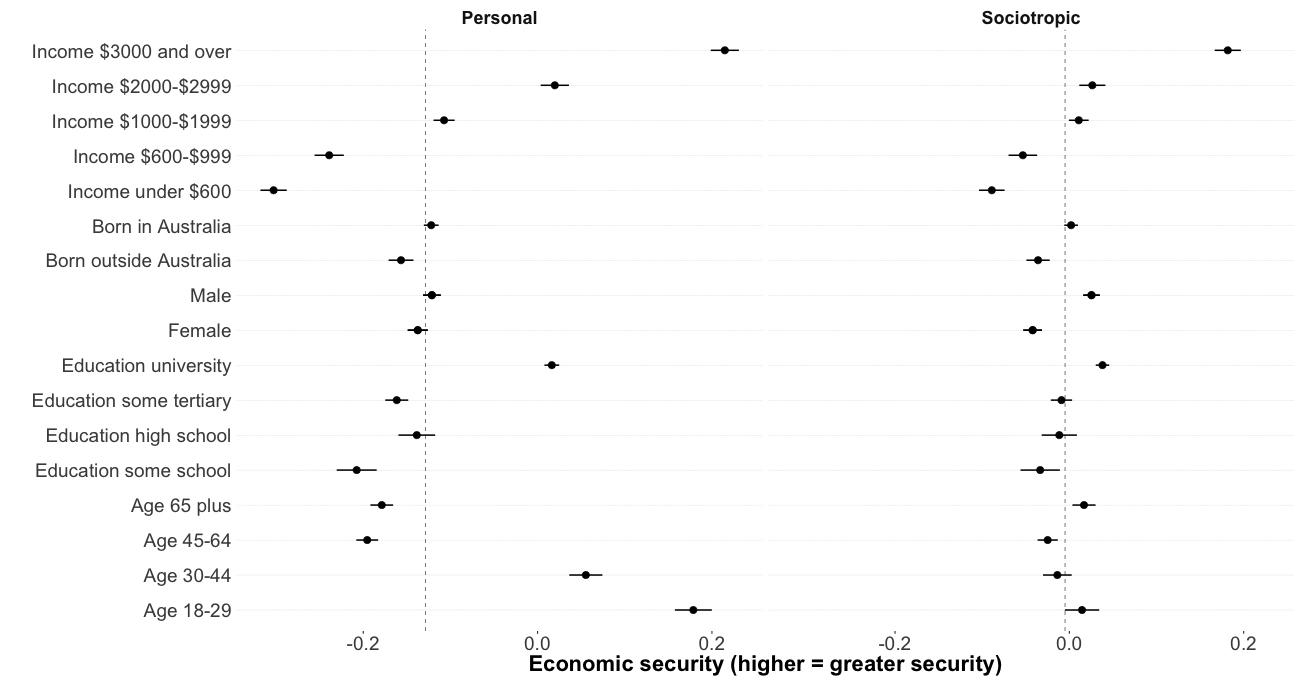
Source: Author’s analysis of Vox Pop Labs post-election survey data.
Notes: Exploratory data analysis of economic insecurity by socioeconomic variables. Each closed circle represents the weighted mean level of security for each group. Horizontal error bars are 95 per cent confidence intervals. The dashed vertical line is the overall weighted mean economic security across the entire population.
Figure 2.3 Economic insecurity by urban geography and state.
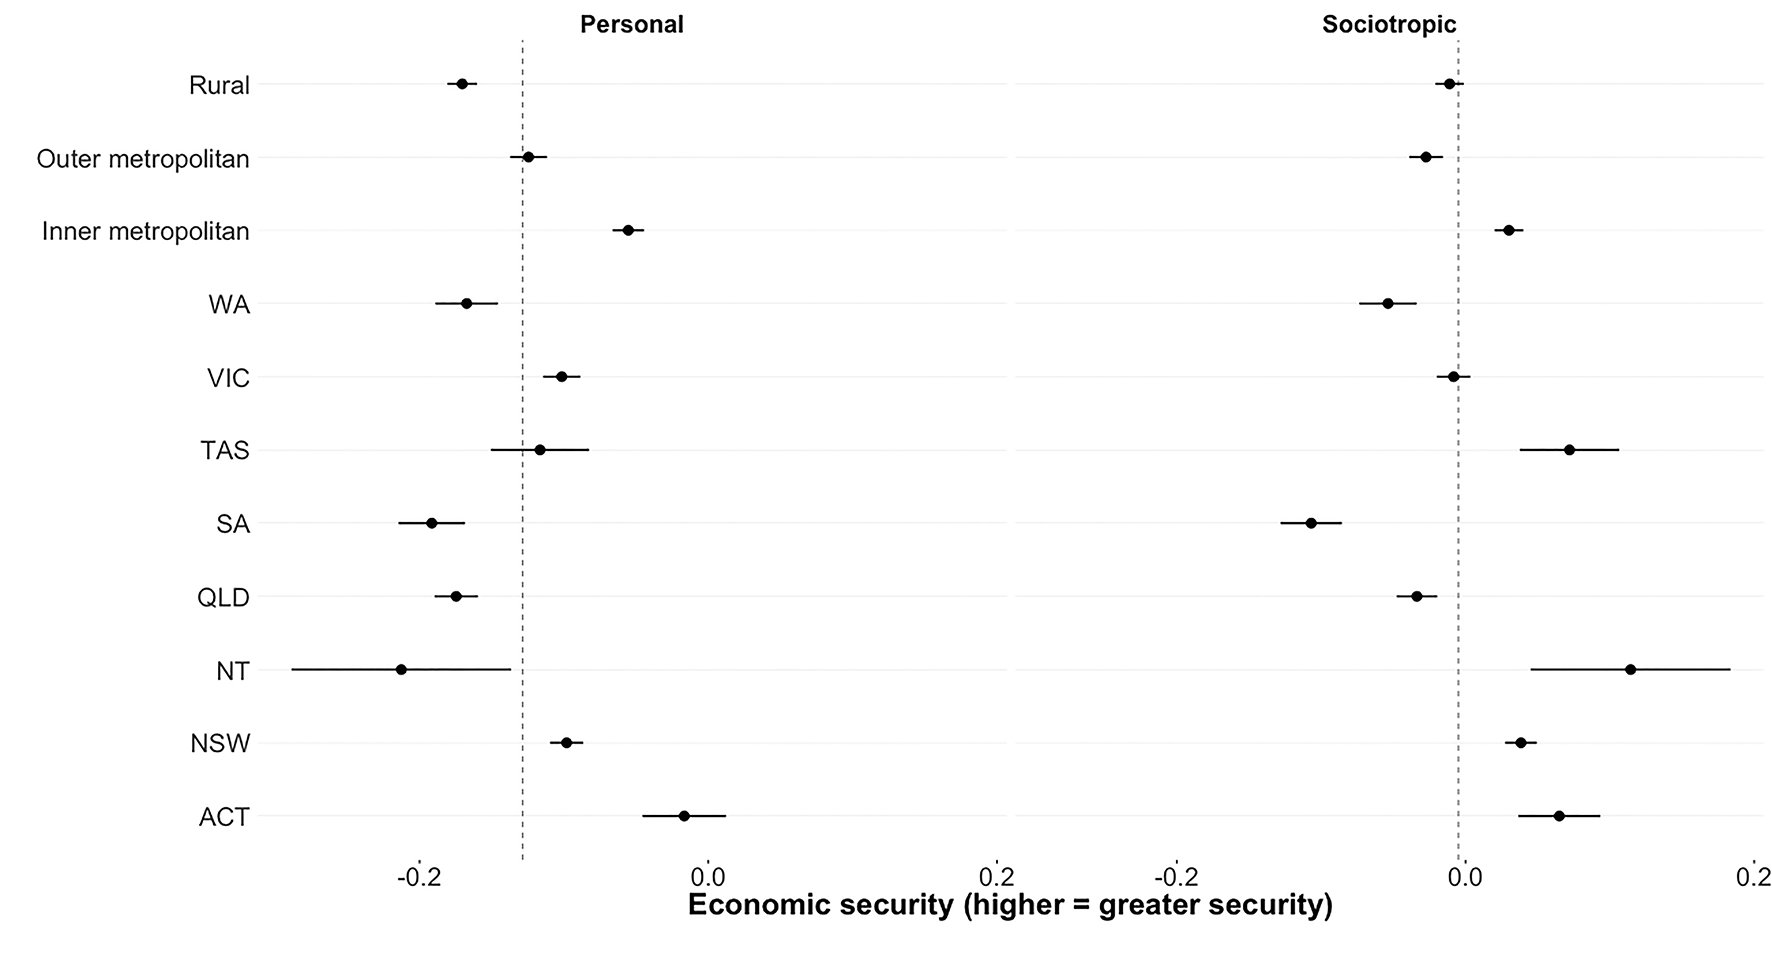
Source: Author’s analysis of Vox Pop Lab’s post-election survey data.
Notes: Exploratory data analysis of economic insecurity by geographic groups (the first three categories compare voters in rural, outer and inner metropolitan areas, the second states). See Figure 2.2 for methods.
Do income and education matter to reported insecurity? Education levels are weaker predictors of sociotropic security, with the university-educated reporting more positive views of the overall economy, but only by a small degree. But there were large differences for perceptions of personal economic security. Those with university qualifications reported perceptions of individual economic wellbeing more than a fifth of a standard deviation higher than those who had not finished high school. Household income was the strongest predictor for perceptions of economic security, with this pattern being largely linear and particularly strong for personal security. Respondents with weekly incomes above $3,000 (over $156,750 per annum) reported levels of personal economic security half a standard deviation higher than those with incomes of less than $600 per week ($31,350 per year).
Figure 2.4 Economic security by Senate vote.
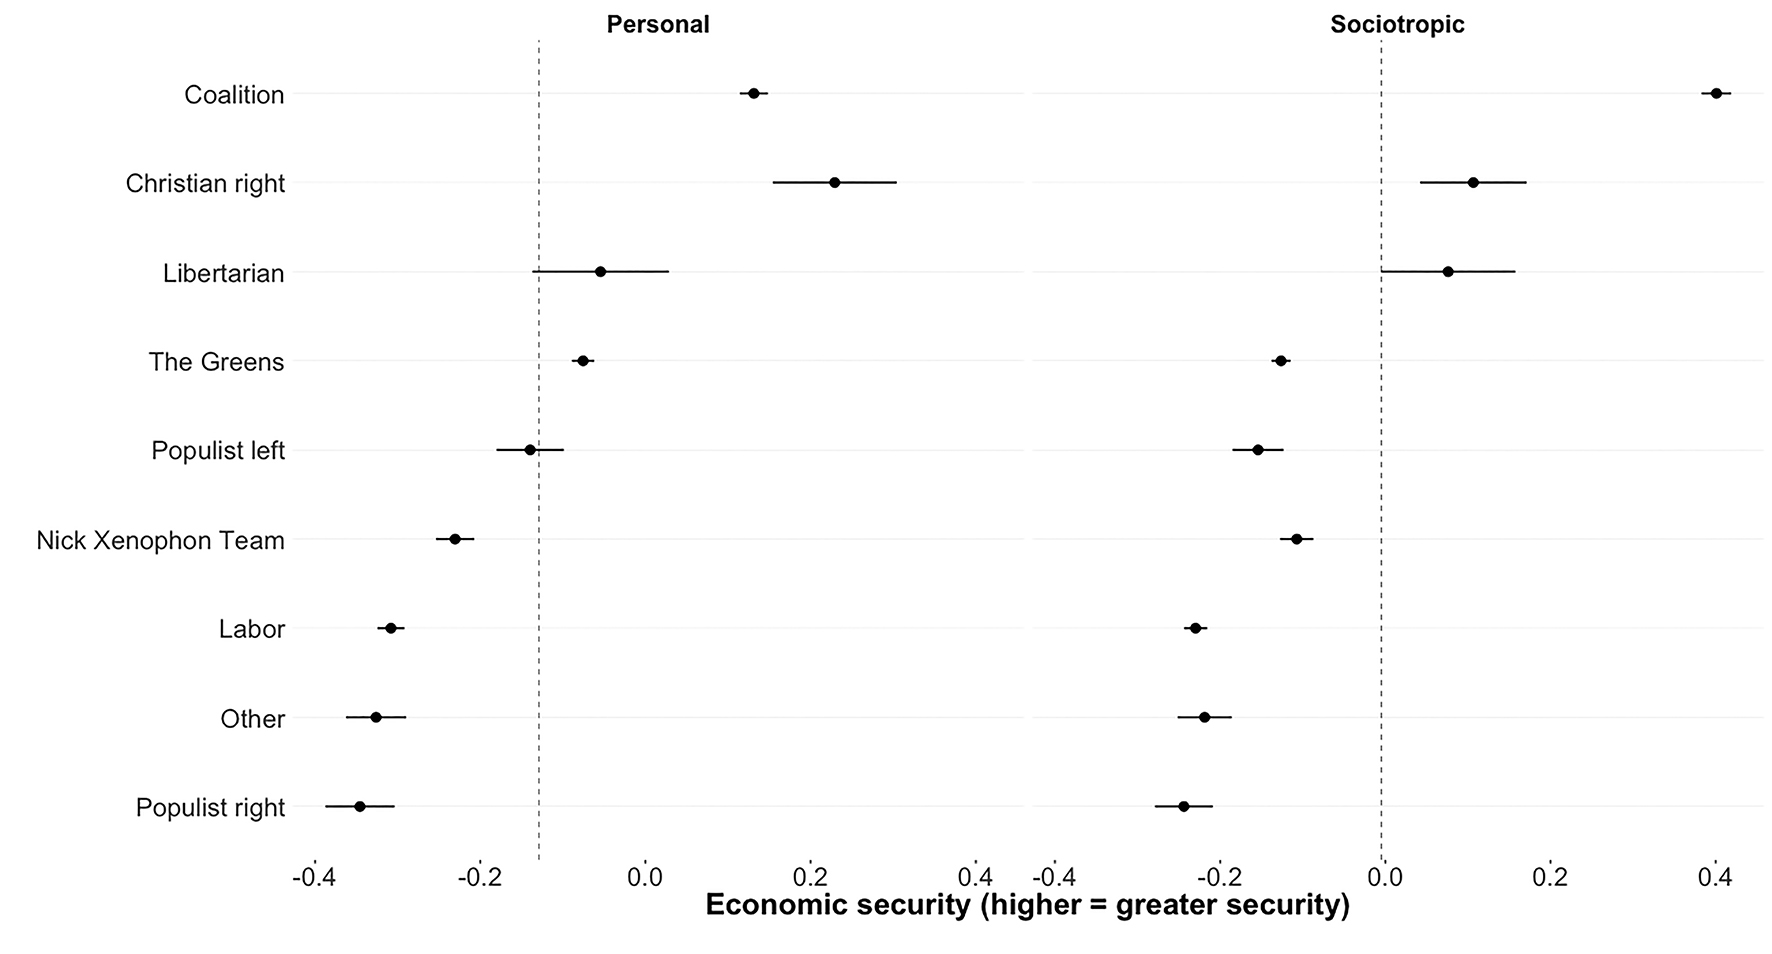
Source: Author’s analysis of Vox Pop Lab’s post-election survey data.
Note: Economic insecurity by Senate vote. See Figure 2.2 for methods.
Age played a mixed role in assessments of economic security. Voters aged 65 years and over perceive the overall economy as doing well, but their personal economic security was worse than younger voters. Those aged 18–29 years had similar levels of sociotropic economic security, but saw their own situation as relatively good. Voters aged 45–64 years had relatively negative perceptions of both their own personal and sociotropic economic security, suggesting their overall levels of economic security were particularly low.
It is hardly surprising that there is a stronger relationship between voters’ personal demographic and economic backgrounds and their evaluation of their personal economic security. However, sociotropic economic evaluations also vary significantly by gender and birthplace: the Australian-born sample had higher rates of personal and sociotropic security than those born elsewhere, while men had slightly higher levels of sociotropic security than women, but showed little difference on personal economic security. There were also important regional variations, likely the result of diversity in the employment opportunities and life chances available in different parts of the country. The result of this, displayed in Figure 2.3, is that sociotropic security varies as much between respondents in different states as personal economic security. However, the difference between voters living in inner-metropolitan and rural areas – with the former reporting higher levels of both – was largely found along the personal security dimension.
These data also allow us to examine the association between respondents’ perceptions of economic security and how they voted at the 2016 Senate election. Figure 2.4 indicates Coalition voters had the highest level of sociotropic security, and a similar level of personal security as Christian right voters. Supporters of the Nick Xenophon Team, the populist left and right parties, and Labor and other parties had lower levels of security on both dimensions. Respondents voting for the Greens in the Senate had higher levels of personal security and lower levels of sociotropic security. This suggests there is a relationship between economic security and partisan choice, which is examined further below.4
Figure 2.5 How survey items load onto economic and social issue dimensions.
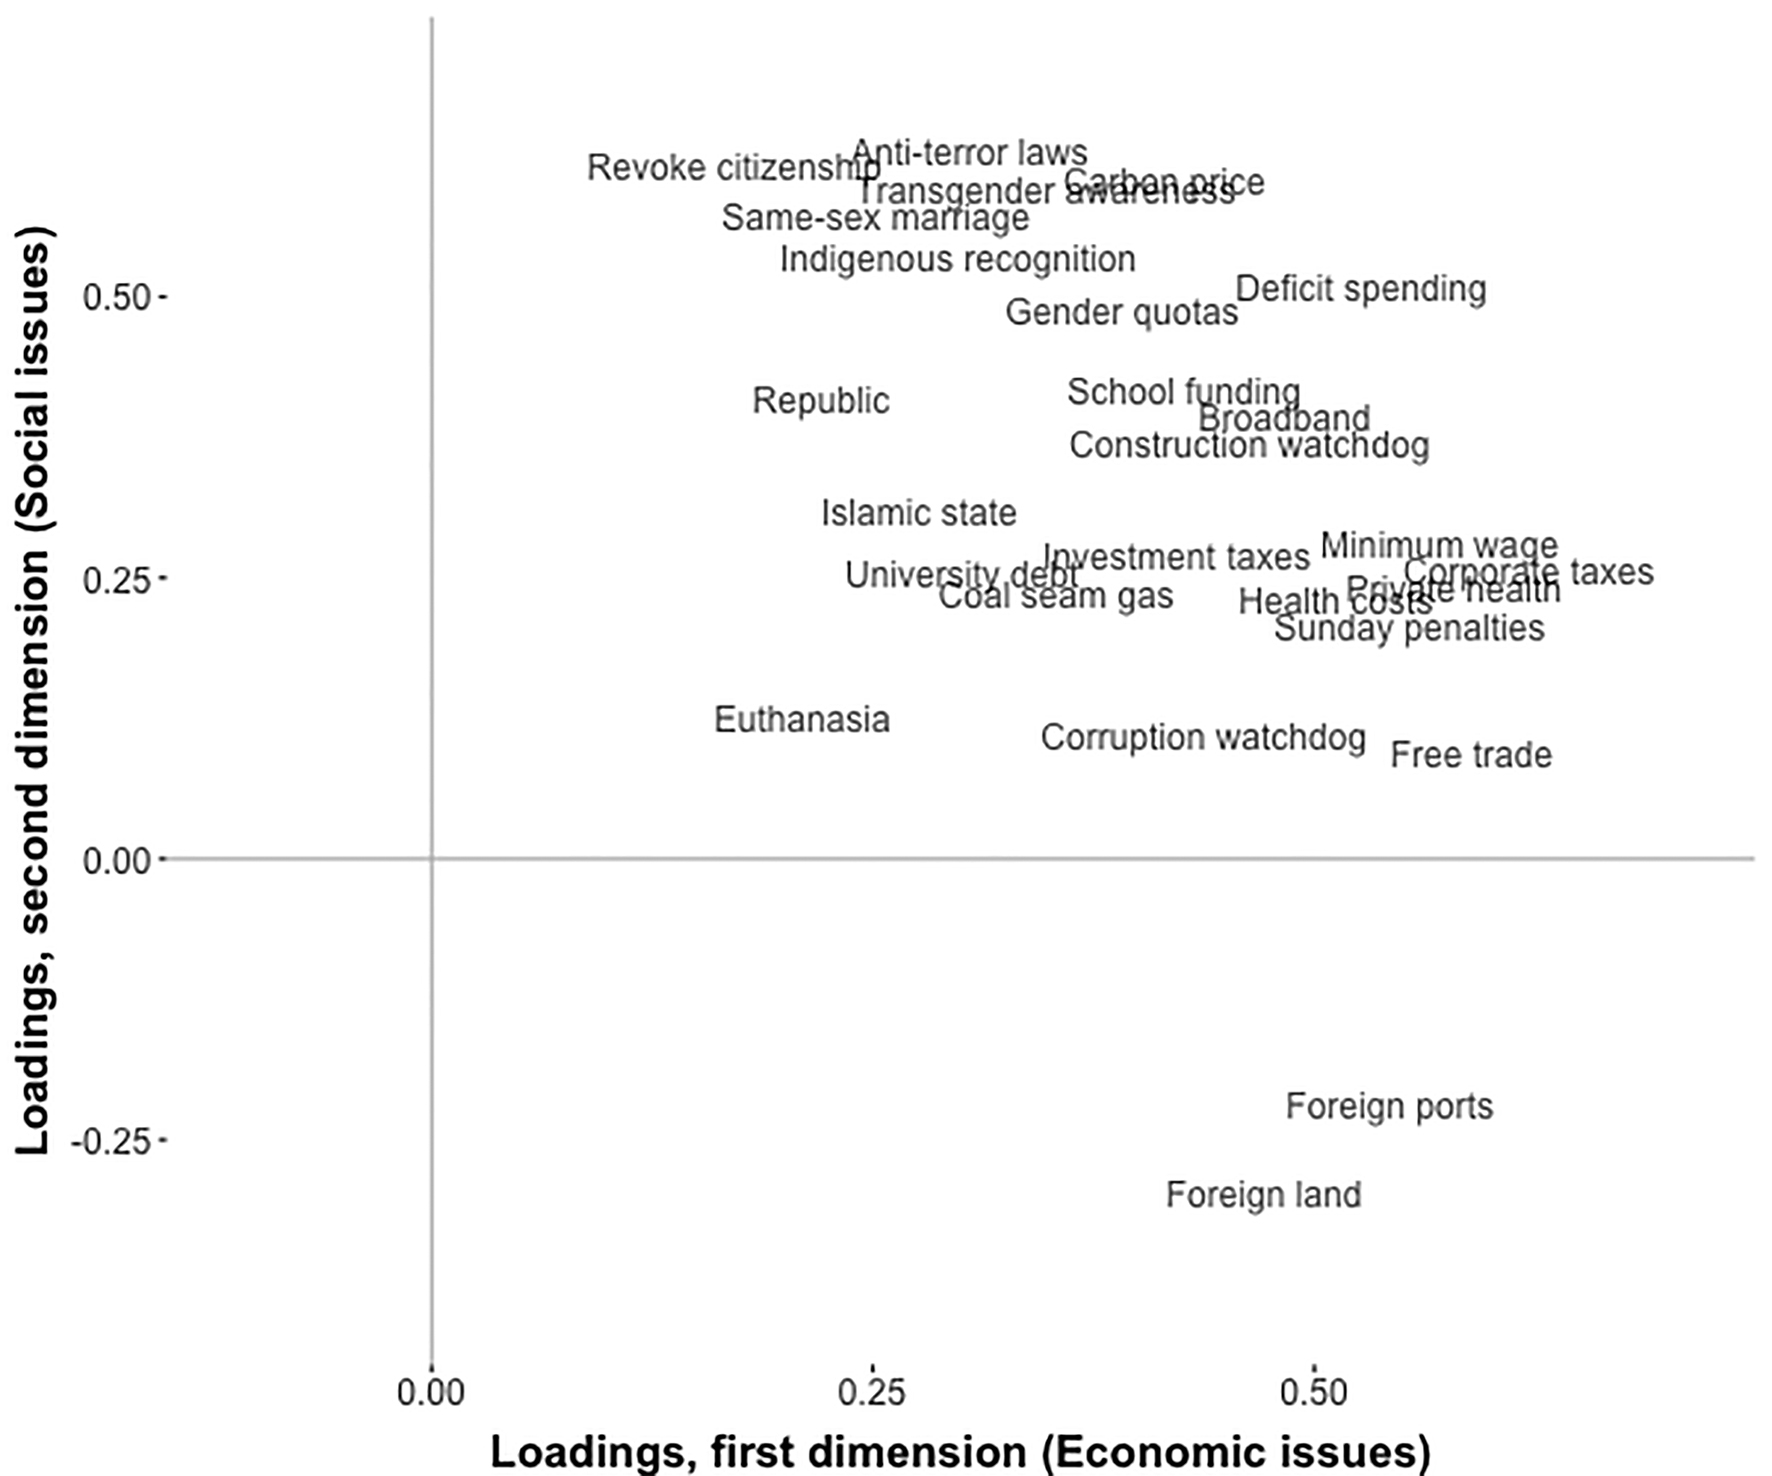
Source: Loading of issue items onto two dimensional factor analysis, fit to Vox Pop Labs post-election survey data by the author.
Notes: Mapping campaign issues onto social and economic issue dimensions estimated with an exploratory factor analysis with varimax rotation. Each label represents the loading of items from the Vox Pop Labs survey on both dimensions estimated by the factor analysis. The x-axis represents the first dimension (labelled economic) and the y-axis the second dimension (labelled social). A high positive loading of an item on a dimension indicates an issue strongly separates respondents with preferences on the left and right. A value close to zero indicates an item that does a poor job discriminating between them.
The representation gap and the vote for minor parties
Voters may support populist and protest parties when they are poorly represented by the major parties. Uniquely for Australia, these data provide the ability for voters’ preferences to be measured against the positions taken by the parties prior to and during the campaign, with both voters and the major political parties coded on 30 policy issues, measured on five-point Likert scales (listed in Appendix 2.2). The coding of the positions of political parties was accomplished using publicly available information on the positions they had taken using the kind of information available to voters (interviews, policy documents and party websites). This policy coding was made public, and changed at the request of the parties if it could be shown that better public information was available to place their position.
We can simplify the measurement of preferences for these 30 issues by fitting an exploratory factor analysis to these data, estimating a two-dimensional set of issue preferences for voters. The items included in this factor analysis and how they load onto each dimension can be seen in Figure 2.5. Items associated with the distribution of economic power and resources loaded most strongly onto the first dimension, which was therefore labelled the economic issue dimension. These include attitudes towards taxation and social spending as well as free trade and foreign ownership of assets. Respondents closer to the traditional economic right (i.e. opposed to significant changes to existing economic hierarchies) score higher on this dimension, preferring less state intervention in the economy and workplace, and being less concerned with trade and foreign ownership.
The second dimension was most strongly associated with attitudes to asylum seekers, foreign aid, terrorism, sexuality, gender equality, and the recognition of Australia’s Indigenous people in the federal Constitution. Voters who score highest on this dimension can be considered closer to a social conservative position that supports the status quo and opposes measures that alter existing norms and hierarchies. Consistent with the first dimension, the preferences related to a positive score on this dimension were more likely associated with the political right in Australia.
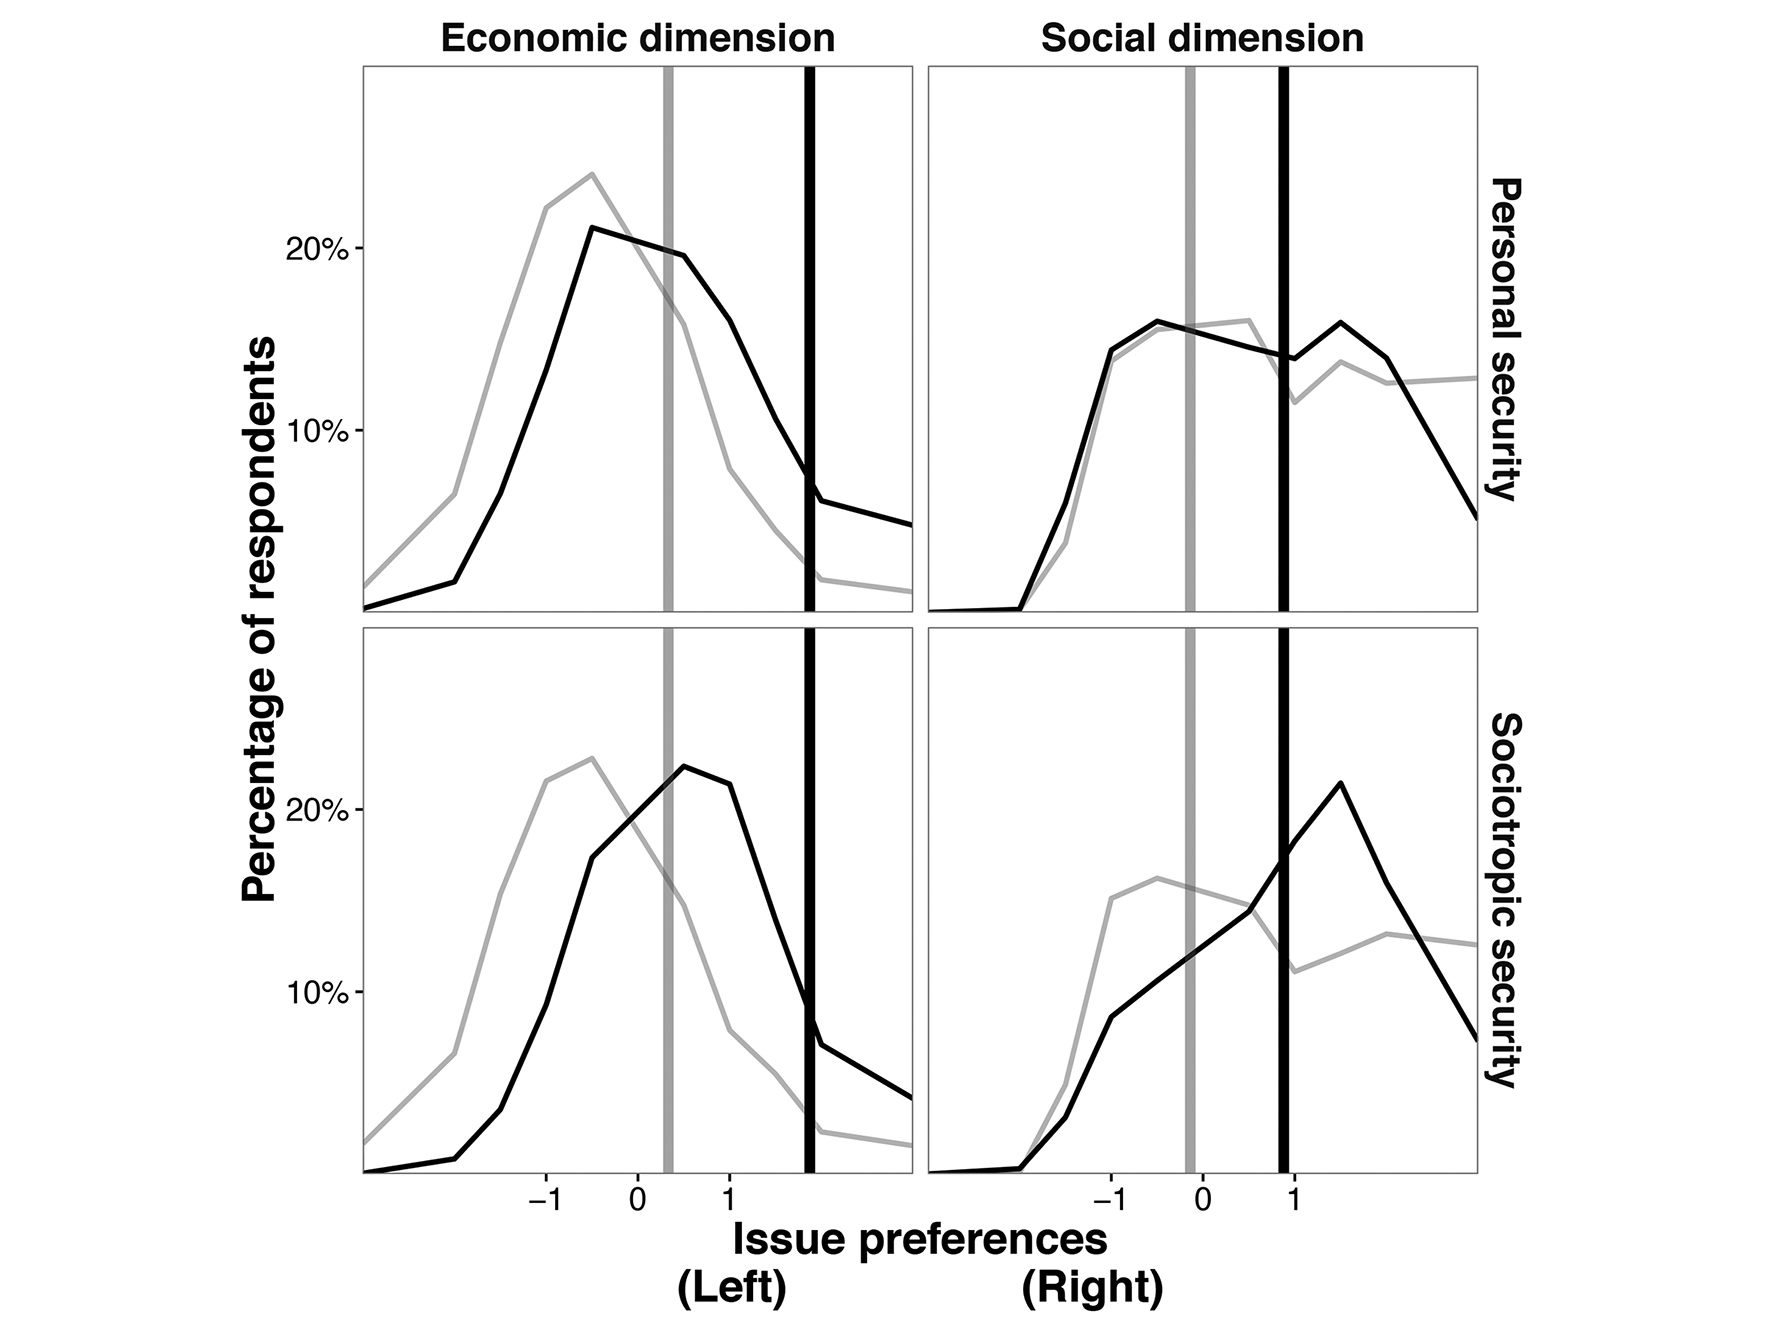
These variables, covering a set of economic and social issues, allow us to better understand voters’ preferences on these dimensions. The distances of these preferences from the positions taken by the major parties are associated with the probability of supporting minor or populist party groups. The scores estimated by this factor analysis (also standardised to have a mean of 0 and standard deviation of 1) are then used to estimate the positions of the major political parties in the same policy space, using the positions coded during the election campaign. These party policy positions, and the weighted distributions of voters, is shown in Figure 2.6. These graphs compare the preferences of voters with personal (top row) and sociotropic (bottom row) economic insecurity scores in the top and bottom quintiles, represented by the light and dark curves respectively. The positions taken by the Coalition and Labor Party on these issues at the 2016 election are represented by the darker and lighter shaded vertical bars. The x-axis shows preferences on the economic (left-hand plots) and social (right-hand) dimensions, left to right. The y-axis is the (weighted) proportion of respondents at each point.
The distribution of voters’ issue preferences, conditional on their economic security, is shown in Figure 2.6. Those with lower levels of economic security on both dimensions (represented by the light grey curve) tended to have issue preferences on the left on economic issues, but to the right on the social dimension. This indicates that the economically insecure prefer more social spending and protectionist trade policies, but less social change, stronger anti-terror laws and more restrictive policies to deal with asylum seekers arriving in Australia by boat. With the Labor Party occupying a position in the middle of both issue dimensions, and the Coalition on the right (particularly on economic policy), these voters are on average poorly represented by the established parties.5 We may expect this to have political ramifications, with the abandonment of the established parties in favour of options that provide policy outcomes closer to their preferences a highly rational move.
We can then use these estimates of voter and party policy positions to measure issue representation as the average Euclidean distance of a voter’s preferences from both parties’ positions (see Appendix 2.3 for more on how issue distance is measured). Using this measurement schema, the position of the Coalition parties was 1.89 (nearly 2 standard deviations to the right of the average respondent), and the Labor Party 0.33. The voter with a preference sitting at 0 would have an average distance of 1.11 from the established parties, while one that was -2 to the left would have an average distance of 3.11, and would have been poorly represented by the party system on this dimension. The distances of voters with different economic and demographic characteristics are shown in Figure 2.7, with a higher score indicating that the mean issue preferences of respondents in that group are farther from the positions taken by the established parties.
Figure 2.6 Distribution of issue preferences of voters with high and low economic security.
Source: Author’s analysis of Vox Pop Labs post-election survey data.
Notes: These plots show the distribution of issue preferences of voters that self-report economic security in the highest and lowest 20 per cent of the sample respectively. Economic security and issue preferences are measured on two dimensions each using the factor analysis fit to post-election survey data, outlined above. Rows on the plots represent the two types of economic security and the columns the issue dimensions. The dark curve represents voters with high economic security and the light curve those with low security. The light vertical line is the estimated position of the Labor Party on each issue dimension, the dark line the Coalition. These data were weighted by age, sex, industry, geography, education, religious affiliation, and both previous and current vote choice.
Figure 2.7 Issues representation by demographic group.
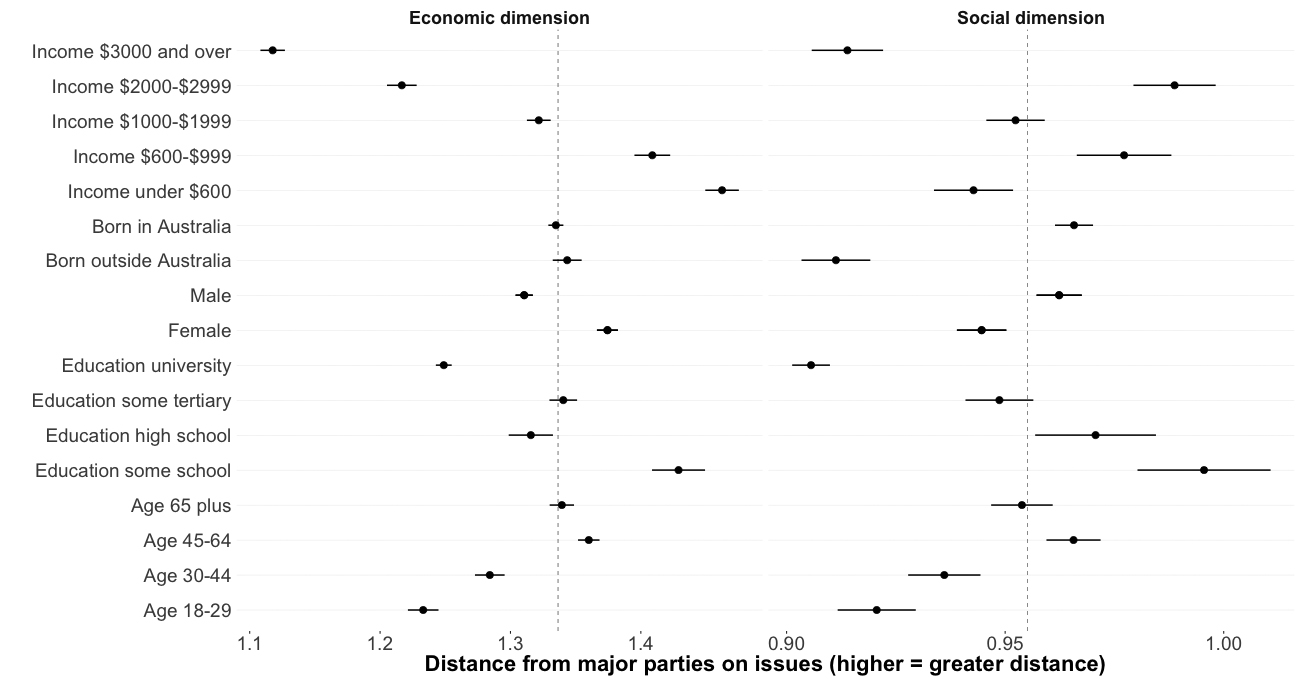
Source: Author’s analysis of Vox Pop Labs post-election survey data.
Notes: Voter distance from positions of the major parties on economic and social dimensions. Each point represents the weighted mean level of security for each group.
Consistent with the existing literature (Bartels 2010; Giger et al. 2012; Gilens 2012), Australian voters living in higher-income households are better represented by the established parties on the economic dimension (with the pattern for social issues less clear). Men are slightly better represented than women on economic issues, but not on the social dimension. Overseas-born voters are better represented by the major parties on the social dimension. University-educated and younger voters are better represented on both dimensions, and older voters and those who did not finish high school are on average poorly represented.
Issue representation, insecurity, and support for minor parties
The data examined above suggest that voters with higher personal insecurity have preferences to the left of centre on economic issues, but are also further to the right on social issues. In fact, those with low personal economic security were twice as likely to be 3 standard deviations right of centre than those with high personal security. However, there also are associations between vote choice, the demographic and economic backgrounds of voters, their issue preferences, and their perceptions of economic security. To take all of these factors into account, voters’ distance from the major parties is estimated and then a series of logistic regressions are fit to these data to better understand the patterns observed so far.
These models are fit separately for each party (or party group), and are used to estimate the probability that voters would provide each party or candidate with their first preference vote. This modelled outcome is conditional on voters’ perceived sociotropic and personal economic security, and their distance from the major parties on the social and economic issue dimensions (their level of issue representation). Both the variables for economic security and distance from the parties are standardised with a mean of 0 and a standard deviation of 1, so that the coefficients are more easily interpreted. For these models, we measure economic insecurity (higher scores = higher insecurity) to align the expected effects of security and policy distance, with support for minor parties expected to increase with both distance from the policies of the established parties and insecurity.
After this initial model specification including economic insecurity and issue representation, interaction terms between security and issue representation were also included. These were found to add generally only a small, but in some instances meaningful, increase in the explanatory power of the models, and were retained. To account for the potentially confounding effects of demographics, as well as over and underrepresentation of particular groups, controls for age, education, religion and division type (inner city, suburban, regional and rural) were also included in these models. Those observations with missing data were excluded, with these models fit to data consisting of 38,826 respondents each. The coefficients for each model fit to these data can be found in Appendix 2.4.
To better understand the patterns in support for minor parties as a product of both economic insecurity and issue representation, the predicted probabilities of support for the parties and candidates of interest were estimated using the logistic regression coefficients obtained from these models, which were then plotted and displayed in Figures 2.8 to 2.11. These graphs show how vote choice shifts as economic security changes (with the darker curves representing voters with security two standard deviations above the mean, and lighter curves those two standard deviations below), and as voters move away from the parties (with a higher value on the x-axis indicating greater distance from the parties).
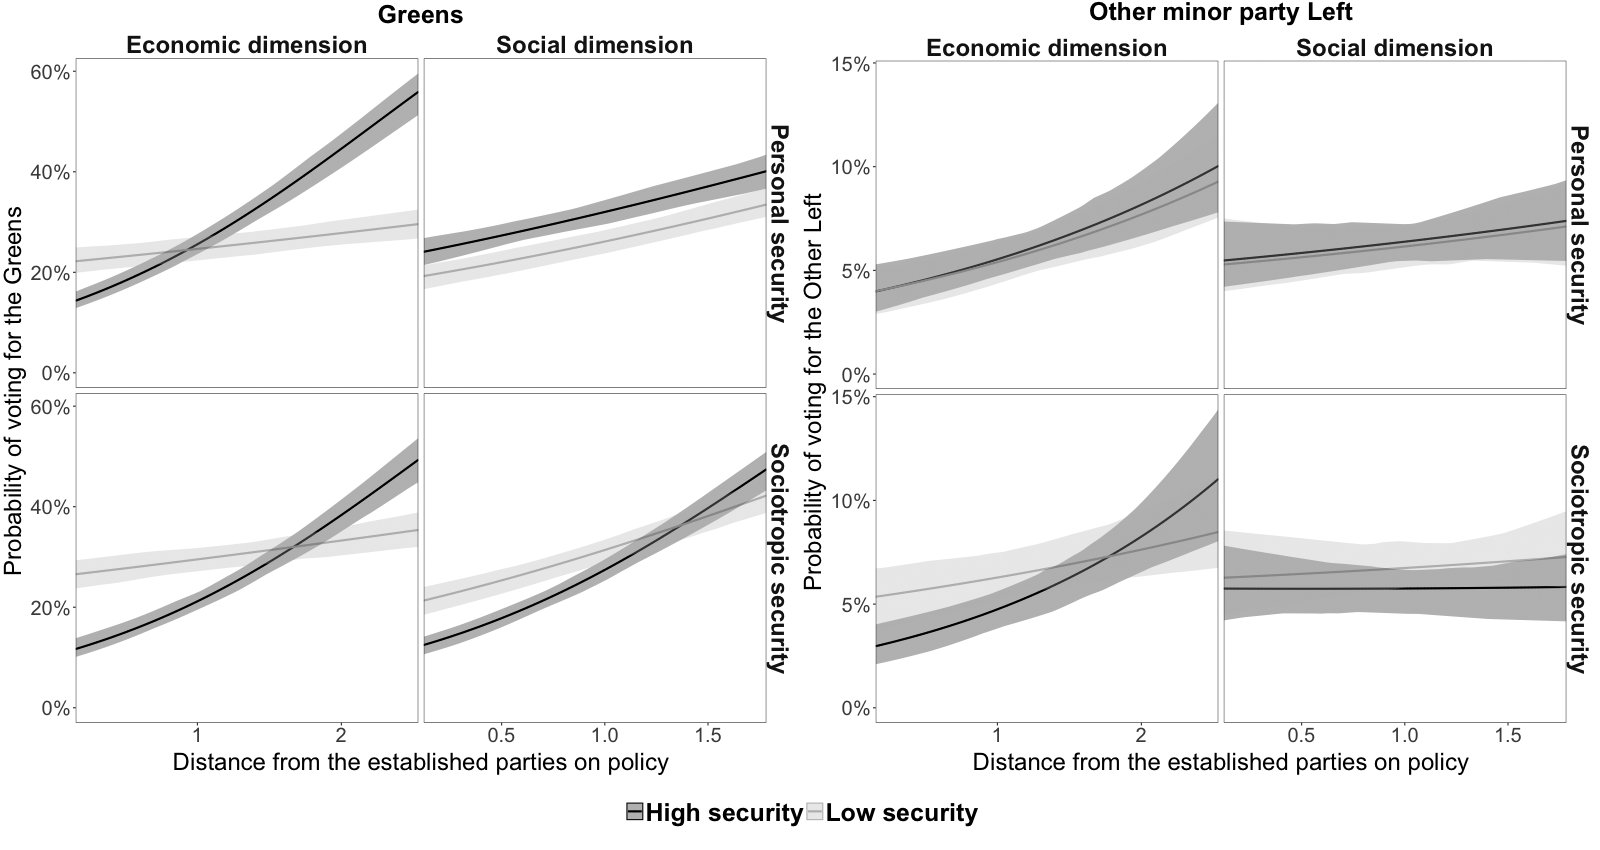
Figure 2.8 Support for the Greens (and minor left parties) by issue representation and economic security.
Source: Predicted probabilities from regression models fit to Vox Pop Labs post-election survey data by the author.
Notes: Predicted change in support for the Greens and other parties on the left in the Senate among high and low economic security voters as distance from the major parties increases. The y-axis is the probability of support for the populist right, and the x-axis the distance from the parties, with a higher figure indicating a greater distance. The light curve represents voters with economic security in the lowest fifth of the population, and the dark curve those with economic security in the highest fifth. The shaded areas are 95 per cent confidence intervals. Issue preferences and distance from the parties are all standardised to have a mean of zero and a standard deviation of one.
Figure 2.8 shows the predicted change in support for the Greens and for minor parties on the left in the 2016 Senate election as a function of economic security and issue representation. Examining the left-hand side plot first, we can see that voters with higher personal security are more likely to support the Greens when age, education, religion and location were taken into account. However, even after these other factors were held constant, lower levels of sociotropic security also predicted a Greens vote, particularly when voters’ issue preferences were closer to the positions of the major parties. This indicates Greens voters generally felt positive about their own personal situation, but were less optimistic about the national economy – not necessarily surprising given that the government was formed by centre-right parties at the time. Additionally, we observe that voters with preferences farther from the policy positions of the major parties (mostly to the left) were more likely to support the Greens. This was particularly the case on the economic dimension for voters with high levels of both types of security, and on the social dimension for those with high levels of sociotropic security. Other minor parties and candidates of the left did particularly well among voters who were poorly represented by the established parties on economic issues, with those enjoying high sociotropic economic security particularly likely to support these parties as the distance of their preferences from the positions taken by the major parties on this dimension increased. These parties did best with similar voters to Greens: younger voters, the university-educated, the non-religious, and those living in the inner city (although compared to the Greens, education mattered less, and age and location more).
Figure 2.9 Support for the Nick Xenophon Team (and ‘Other’ parties and candidates) by issue representation and economic security.
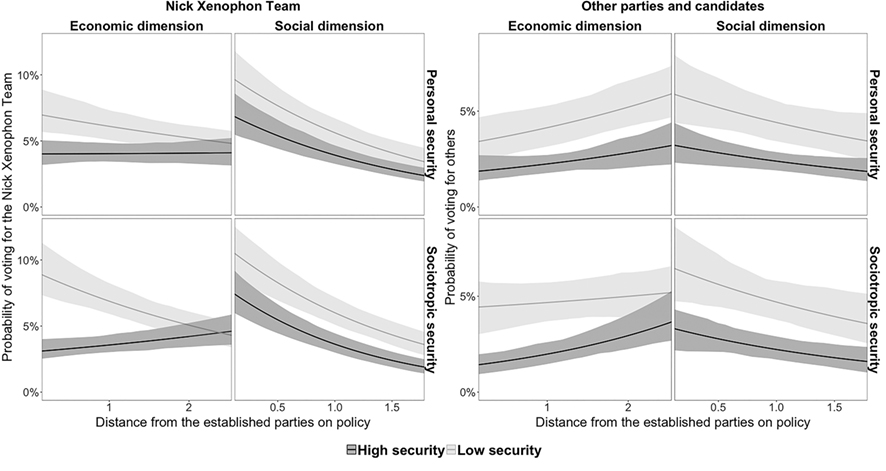
Source: Predicted probabilities from regression models fit to Vox Pop Labs post-election survey data by the author.
Notes: Predicted change in support for the Nick Xenophon Team, or other parties and candidates, in the Senate amongst high- and low-economic security voters as distance from the major parties increases. The shaded areas are 95 per cent confidence intervals.
Different patterns were observed for the Nick Xenophon Team (NXT) and other non-establishment centrist parties and candidates (see Figure 2.9). In both instances, these parties were more likely to obtain votes from respondents with low levels of economic security (on both dimensions). Unlike those supporting the non-Labor left, a lack of representation does not appear to be a major driver for supporting these parties. Instead, support for NXT was estimated to be lower among voters with preferences farther from the established parties, especially on social issues (except for high-security voters, on economic issues). These results indicate that parties like NXT were tapping into economic insecurity, with voters concerned about the state of their personal financial situation or the wider economy.
As can be seen in the regression coefficients shown in Appendix 2.4, when all other factors in the model were held constant, NXT still performed better with voters whose socioeconomic situation would generally tend them towards greater economic insecurity. This model predicted they would do much better with older voters, somewhat better amongst those who did not have a university degree, worse with those identifying as Catholics, and slightly better in rural electorates. Like NXT, other centrist minor parties did best with voters who did not complete a university degree, and in particular, those who did not finish high school. They also did particularly poorly among inner-city voters and best with those living in rural electorates.
Figure 2.10 Support for libertarian and Christian right parties by issue representation and economic security.
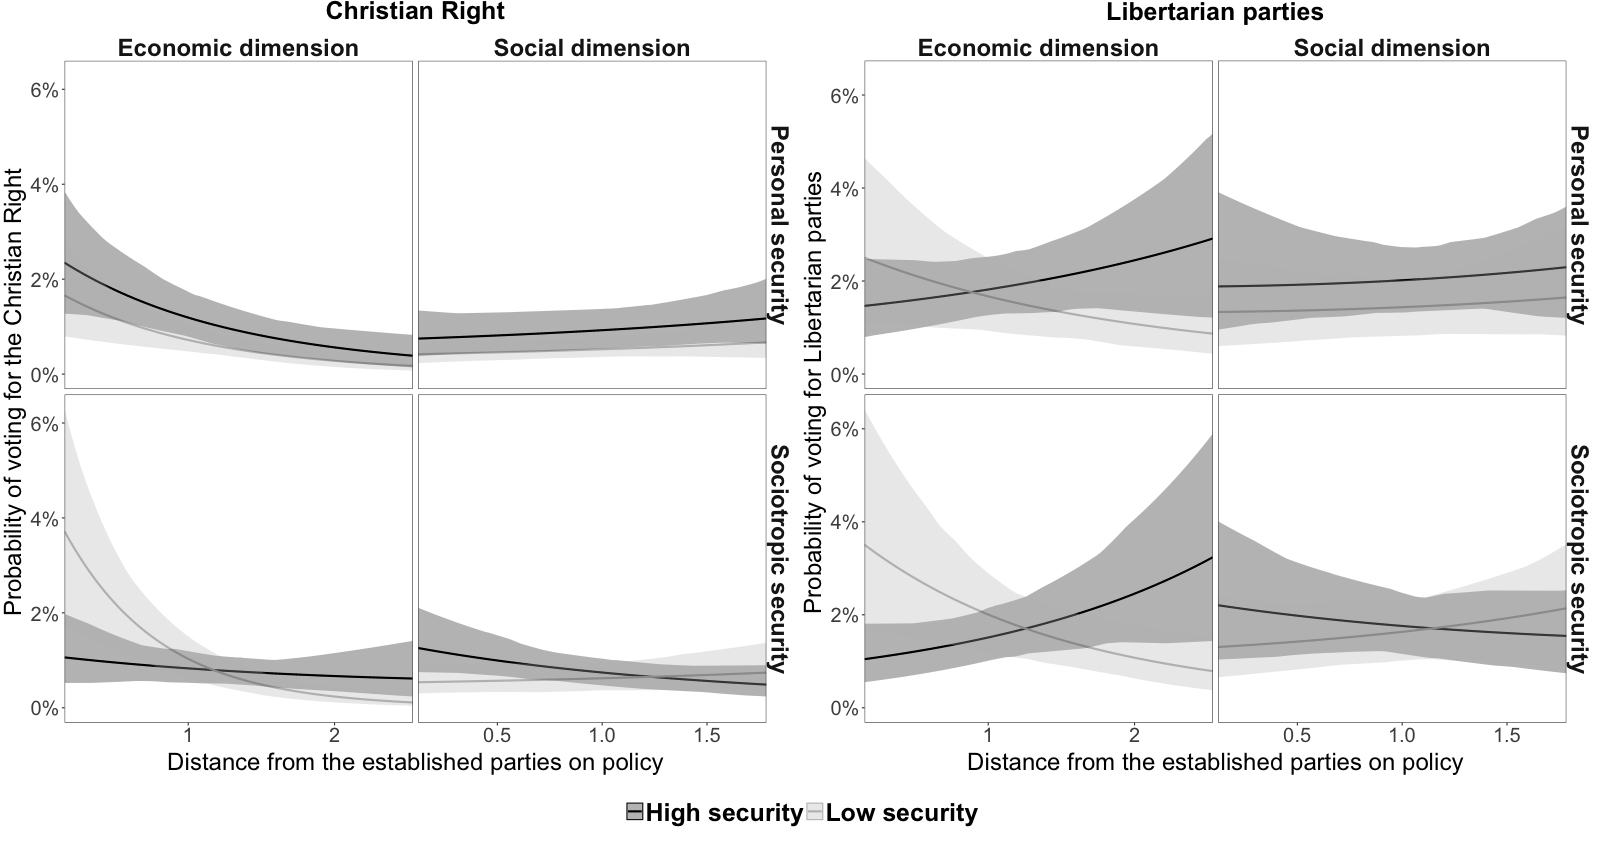
Source: Predicted probabilities from regression models fit to Vox Pop Labs post-election survey data by the author.
Notes: Predicted change in support for libertarian and Christian right parties in the Senate among high and low economic security voters as distance from the major parties increases.
Estimated support for the libertarian and Christian right is shown in Figure 2.10. The libertarian Senate vote was weakly predicted by personal economic security, with highly secure voters slightly more likely to support these parties. However, issue representation does not appear to have been particularly important. Voters were also more likely to support Christian right parties if they have higher levels of personal economic security, and if they had issue preferences closer to the positions of the major parties, particularly on economic issues. We can conclude that support for these parties appears to be primarily driven by voters’ identities (as can be seen in Appendix 2.4). Libertarian voters were more defined by age (with younger voters more likely to support libertarian parties) and to a lesser extent by their location (with greater support in rural areas). The Christian right was better predicted by religion, location and age, with older, non-urban, Protestant voters also more likely to support them.
In contrast, a Senate vote for the populist and protest right (i.e. One Nation) was strongly driven by a combination of poor issue representation on social issues and economic insecurity. These parties filled a ‘niche’ in Australian politics in 2016, attracting voters who felt the economy was performing poorly in particular, and to a lesser extent that their own economic position was insecure. Most importantly, these voters had preferences on social issues that varied considerably from the major parties’ positions, supporting stronger measures against asylum seekers arriving by boat, terrorism, and changes to traditional societal norms. Unlike some of the other parties on the right, it was not older voters who were necessarily the key support base for these parties. Rather, our model predicted it was those voters aged between 30 and 44 years, and 45 to 64 years, who were their core support base. They also did best among those voters who had not finished high school, and particularly poorly with the university-educated. They did worst with atheists and best with Protestants. They did particularly poorly in the inner city, and best in provincial cities and rural electorates.
Explaining minor and populist party voting in 2016
Economic insecurity and a lack of issue representation both provide important explanations for the support enjoyed by minor and populist parties at the 2016 federal election. Above, I outlined a theoretical framework characterising voters as ‘utility maximisers’ (Popkin 1991), and from this it was hypothesised that they would want to support parties that best represent their perceived interests, which includes providing economic security and enacting policies that closely match their issue preferences. If this is a valid assumption, then in situations where voters feel economically insecure, and their preferences across a range of issues are not represented by the established government-forming parties, they may believe the political system itself is failing to represent their interests, and be more likely to support anti-system parties.
Figure 2.11 Support for the populist right by issue representation and economic security .

Source: Predicted probabilities from regression models fit to Vox Pop Labs post-election survey data by the author.
Notes: Predicted change in support for the populist right in the Senate among high and low economic security voters as distance from the major parties increases. The predictions are calculated from a logistic model fit to vote choice given voters’ distances from the established parties on economic and social issues, and their level of personal and sociotropic economic insecurity. The y-axis is the probability of support the populist right, and the x-axis distance from the parties, with a higher figure indicating a greater distance. Issue preferences and distance from the parties are all standardised to have a mean of zero and a standard deviation of one.
Consistent with the existing literature, voters with lower household incomes and lower levels of education were poorly represented by the major parties on both economic and social issues at the 2016 election (Bartels 2010; Giger et al. 2012; Gilens 2012). They were on average to the left of the major parties on economic issues, preferring higher corporate taxes, more spending on health and education and more protectionist trade policy. However, they were also to the right of the established parties on social issues, wanting harsher deterrents for asylum seekers arriving by boat and expressing less support for rapid change in social norms in areas of gender and sexuality. These voters also tended to have lower levels of economic security. Assuming they are motivated by a desire to obtain the best possible outcomes from the political system, these individuals have considerable reasons to support non-establishment parties in greater numbers than more secure voters. This is precisely what was observed, although with different patterns for different non-establishment parties. In the US in 2016, voters with these kinds of issue preferences were more inclined to take the anti-establishment option, and supported the presidential bid of Donald Trump (Carmines, Ensley and Wagner 2016).
The Greens and the minor parties on the left attracted voters who were mostly personally economically secure, and who were driven by disagreement with the established parties on both issue dimensions. Those who voted for the Nick Xenophon Team, and other minor parties and independent candidates of the centre, were driven by both their own poor financial situation and general perceptions of the economy. However, they appear to have been largely well represented by the established parties on the two issue dimensions measured in this chapter. The minor parties of the right appear largely to be a product of identity politics, supported by a mix of groups concerned about their traditional status in the social hierarchy and about social change. Christian and populist right voters in particular appear to have been largely middle-aged and older Protestants with lower levels of education living outside the cities. This, combined with lower levels of economic security and poor social issue representation, appears to have largely fuelled the support for the populist right.
These findings provide some insight into the political implications of the rising support for these parties and candidates, and the challenges faced by the major parties. The government-forming parties in Australia may need to address the economic insecurity experienced by some voters, and provide policy options closer to the preferences of citizens who are poorly represented by their current positions. Of course, this is a two-edged sword. If the Coalition moved to the right on social issues to better represent voters who believe society is changing too fast, or Labor moved to the left on economic issues to address the concerns of the economically insecure, it could result in greater political polarisation. Failure to respond, however, may result in a growing share of the vote shifting to parties other than the Coalition or Labor. This would alter the electoral balance in favour of a more fragmented party system in the Senate at least, making governance more complicated and potentially affecting policy outcomes.
The economic crises since the GFC have created turmoil. This has had a political effect, including the rise of populist right parties in Europe, Brexit in the UK, and the election of Donald Trump in the US. Although Australia avoided the worst of the global recession, real disposable income growth has stalled for several years. The political impact here has been to create instability and dissatisfaction with public policy and governing parties. Although we cannot be certain whether the recent increase in support for these minor parties will continue – these data are a snapshot of 2016 and not a time series, and history is rarely linear – Australian politics could be transformed, with the established parties forced into governing coalitions with these other parties. Labor may become more reliant on an alliance with the Greens, just as the Liberal Party has done with the National Party since the 1920s (in various forms). The Coalition may need to come to an accommodation with Christian and libertarian parties, or of One Nation, if they remain electorally successful. However, a reason to believe this may not happen is the fragmented nature of these parties, particularly on the right, with a large array of parties emerging to fill the gaps left open by the major parties on policy or economic security.
Different combinations of poor issue representation and economic insecurity have provided the ingredients for support for non-establishment parties and candidates. Australia’s major parties appear not to be representing elements of the economic left, nor the social right, adequately (based on the data examined here, at least). Voters with lower household incomes and lower levels of education appear not to be well represented by these parties’ political platforms. This has resulted in a collection of minor, protest and populist parties forming to fill different niches in the political ecosystem. The populist and Christian right between them have built electoral coalitions similar to those that supported Donald Trump (see, for instance, Carmines et al. 2016). However, unlike in the US, none of these groups has been able to unite the economically insecure and poorly represented into a single voting bloc. Similarly, the NXT has secured a large base of support amongst the economically insecure, limiting the ability of the populist left and right to expand their base of support in this area. This may suggest that, short of a vast realignment of Australian politics, the rise of a non-establishment political force of the magnitude of a Donald Trump is unlikely in the near term in Australia.
References
Adams, James (2001). Party competition and responsible party government. Ann Arbor: Michigan University Press.
Albertazzi, Daniele and Duncan McDonnell, eds (2008). Twenty-first century populism: the spectre of Western European democracy. New York: Palgrave Macmillan.
Allport, Gordon (1954). The nature of prejudice. Cambridge: Addison-Wesley Publishing Company.
Armingeon, Klaus and Besir Ceka (2014). The loss of trust in the European Union during the great recession since 2007: the role of heuristics from the national political system. European Union Politics 15(1), 82–107.
Australian Bureau of Statistics (2017). 6345.0 – Wage Price Index, Australia, December 2016.
Bartels, Larry (2010). Unequal democracy: the political economy of the new gilded age. Princeton, NJ: Princeton University Press.
Betz, Hans-Georg (1994). Radical rightwing populism in Western Europe. New York: St Martin’s Press.
Birrell, Bob (2006). Productivity commission on the economics of immigration. People and Place 14(1), 1–7.
Birrell, Bob and Ernest Healy (2003). Migration and the housing affordability crisis. People and Place 11(3), 43–56.
Blalock, Hubert M. (1967). Towards a theory of minority-group relations. New York: Wiley.
Bowler, Shaun, David Denemark, Todd Donovan and Duncan McDonnell (2017). Right-wing populist party supporters: dissatisfied but not direct democrats. European Journal of Political Research 56, 70–91.
Brandenburg, Heinz and Rupert Johns (2014). The declining representativeness of the British party system, and why it matters. Political Studies 62, 704–25.
Calvert, Randall (1985). Robustness of the multidimensional voting model: candidates’ motivations, uncertainty, and convergence. American Journal of Political Science 29, 69–95.
Cameron, Sarah M. and Ian McAllister (2016). Trends in Australian political opinion: results from the Australian election study 1987–2016. Retrieved from Canberra.
Campbell, Donald T. (1965). Ethnocentric and other altruistic motives. Lincoln: University of Nebraska Press.
Carmines, Edward, Michael J. Ensley and Michael W. Wagner (2016). Ideological heterogeneity and the rise of Donald Trump. The Forum 14(4), 385–97.
Converse, Philip E. (1975). Public opinion and voting behavior. In Handbook of Political Science. Fred I. Greenstein and Nelson W. Polsby, eds, 75–169. Reading, Massachusetts: Addison-Wesley.
Diamond, Larry (2011). Why democracies survive. Journal of Democracy 22(1), 17–30.
Downs, Anthony (1957). An economic theory of democracy. New York: Harper.
Esaiasson, Peter and Sören Holmberg (1996). Representation from above: members of parliament and representative democracy in Sweden. Aldershot, UK: Dartmouth.
Funke, Manuel, Moritz Schularick and Christoph Trebesch (2016). Going to extremes: politics after financial crises, 1870–2014. European Economic Review 88, 227–60.
Giger, Nathalie, Jan Rosset and Julian Bernauer (2012). The poor political representation of the poor in a comparative perceptive. Representation 48(1), 47–61.
Gilens, Martin (2012). Affluence and influence: economic inequality and political power in America. Princeton, NJ: Princeton University Press.
Goot, Murray (1993). Multiculturalists, monoculturalists and the many in between: attitudes to cultural diversity and their correlates. Journal of Sociology 29, 226–53.
Goot, Murray and Ian Watson (2001a). One Nation’s electoral support: economic insecurity versus attitudes to immigration. Australian Journal of Politics and History 47(4), 512–15.
Goot, Murray and Ian Watson (2001b). One Nation’s electoral support: where does it come from? What makes it different and how does it fit? Australian Journal of Politics and History 47(2), 159–191.
Hacker, J. (2006). The great shift: the new economic insecurity and the decline of the American dream. New York: Oxford University Press.
Hainmueller, Jens and Michael J. Hiscox (2007). Educated preferences: explaining attitudes toward immigration in Europe. International Organization 61(2), 399–442.
Hetherington, Marc J. and Thomas J. Rudolph (2015). Why Washington won’t work: polarization, political trust, and the governing crisis. Chicago: University of Chicago Press.
Inglehart, Ronald (1990). Culture shift in advanced industrial society. Princeton, NJ: Princeton University Press.
Inglehart, Ronald (1997). Modernization and postmodernization. Princeton, NJ: Princeton University Press.
Inglehart, Ronald and Pippa Norris (2016). Trump, Brexit, and the rise of populism: economic have-nots and cultural backlash. Faculty Research Working Paper Series.
Key, Vladimer Orlando (1984 [1949]). Southern politics in state and nation. New York: Knopf.
Laver, Michael (2011). Why vote-seeking parties may make voters miserable. Irish Political Studies 26(4), 489–500.
Mair, Peter (2013). Ruling the void: the hollowing of Western democracy. London: Verso.
Marsh, Ian and Raymond Miller (2012). Democratic decline and democratic renewal: political change in Britain, Australia and New Zealand. Cambridge: Cambridge University Press.
McAllister, Ian (1993). Immigration, bipartisanship and public opinion. In The politics of Australian immigration. James Jupp and M. Kabala, eds. South Carlton, Vic.: The Bureau of Immigration Research.
Moffitt, Benjamin and Simon Tormey (2014). Rethinking populism: politics, mediatisation and political style. Political Studies 62, 381–97.
Mudde, Cas (2007). Populist radical right parties in Europe. New York: Cambridge University Press.
Norris, Pippa (2005). Radical right: voters and parties in the electoral market. Cambridge: Cambridge University Press.
Popkin, Samuel L. (1991). The reasoning voter: communication and persuasion in presidential campaigns. Chicago and London: The University of Chicago Press.
Przeworski, Adam, Michael E. Alvarez, José A. Cheibub and Fernando Limongi (2000). Democracy and development: political institutions and well-being in the world, 1950–1990. New York: Cambridge University Press.
Ramiro, Luis and Raul Gomez (2016). Radical-left populism during the Great Recession: Podemos and its competition with the established radical left. Political Studies 65(1) (suppl.), 108–26.
Roemer, John E. (2001). Political competition: theory and applications. Cambridge, MA: Harvard University Press.
Sandel, Michael J. (2012). What money can’t buy: the moral limits of markets. London: Farrar, Straus and Giroux.
Schmitt, Hermann and Jacques Thomassen, J. (1999). Political representation and legitimacy in the European Union. Oxford: Oxford University Press.
Sherif, Muzafer (1967). Group conflict and cooperation: their social psychology. London: Routledge & Kegan Paul.
Sherif, Muzafer and Carolyn W. Sherif (1953). Groups in harmony and tension. New York: Harper.
Sidanius, Jim and Felicia Pratto (1999). Social dominance: an intergroup theory of social hierarchy and oppression. Cambridge: Cambridge University Press.
Sides, John and Jack Citrin, J. (2007). European opinion about immigration: the role of identities, interests and information. British Journal of Political Science 37(3), 477–504.
Turnbull, Nick and Shaun Wilson (2001). The two faces of economic insecurity: reply to Goot and Watson on One Nation. Australian Journal of Politics and History 47(4), 512–15.
Vala, Jorge, Cicero Pereira and Alice Ramos (2006). Racial prejudice, threat perception and opposition to immigration: a comparative analysis. Portuguese Journal of Social Science 5(2), 119–140.
van der Brug, Wouter (1999). Voters’ perceptions and party dynamics. Party Politics 5(2), 147–69.
Vox Pop Labs (2016). Vote Compass methodology. Available at http://voxpoplabs.com/votecompass/methodology.pdf.
Wilkes, Rima, Neil Guppy and Lily Farris (2008). ‘No thanks, we’re full’: individual characteristics, national context, and changing attitudes toward immigration. International Migration Review 42(2), 302–29.
Wittman, Donald (1973). Parties as utility maximizers. American Political Science Review 67(2), 490–498.
Wittman, Donald (1977). Candidates with policy preferences: a dynamic model. Journal of Economic Theory 14(1), 180–89.
Wittman, Donald (1983). Candidate motivation: a synthesis. American Political Science Review 77(1), 142–57.
Appendix 2.1: Party groups
The parties or party groups examined in this chapter are:
The Greens
Other minor left parties
- Animal Justice Party
- Australian Cyclists Party
- Australian Equality Party (Marriage)
- Australian Progressives
- Australian Sex Party
- Bullet Train for Australia
- Marijuana (HEMP) Party
- Secular Party of Australia
- Socialist Alliance
- The Arts Party
- Voluntary Euthanasia Party
- Sustainable Australia
- Pirate Party
- Socialist Equality Party
- Renewable Energy Party
- Science Party
The Nick Xenophon Team
Libertarian parties
- Smokers’ Rights Party
- Liberal Democrats
Christian right
- Australian Christians
- Christian Democratic Party (Fred Nile Group)
- Family First
Populist and protest right
- Australia First Party
- Australian Liberty Alliance
- Jacqui Lambie Network
- John Madigan’s Manufacturing and Farming Party
- Katter’s Australian Party
- Shooters, Fishers and Farmers Party
- Pauline Hanson’s One Nation
- Rise Up Australia
- DLP Democratic Labour
- Australian Country Party
Other parties
- Palmer United Party
- VOTEFLUX.ORG Upgrade Democracy
- Mature Australia
- Online Direct Democracy (Empowering the People)
- Independents
- Australian Motoring Enthusiasts Party
- Derryn Hinch’s Justice Party
- Other parties or candidates
- Seniors United Party of Australia
- Veterans Party
- Australian Mental Health Party
- Glenn Lazarus Team
Appendix 2.2: Issue items
These were coded so that the position farthest to the left was coded left–right, from -2 to +2, and then included in the factor analysis outlined above.
Five-point agree—disagree scales:
- The government should further restrict foreign ownership of Australian agricultural land.
- Boats carrying asylum seekers should be turned back.
- Asylum seekers should be held in offshore detention centres while their claims are being processed.
- Transgender awareness should be taught in primary schools.
- The federal budget deficit should be reduced, even if it means fewer public services.
- Schools with lower-performing students should receive more government funding than those with higher-performing students.
- The Australian constitution should recognise Indigenous people as Australia’s first inhabitants.
- Australia should put a price on carbon emissions.
- There should be fewer restrictions on coal seam gas exploration.
- The economic benefits of free trade outweigh the costs.
- Australia should end the monarchy and become a republic.
- The government should establish a federal corruption watchdog.
- Anti-terrorism laws in Australia have gone too far.
- The government should be able to revoke Australian citizenship from suspected terrorists abroad.
- People who work on a Sunday should get paid more than people who work on a Saturday.
- The government should reinstate the construction industry watchdog, the ABCC.
- Foreign companies should be prohibited from leasing Australian ports.
- The National Broadband Network should deliver faster speeds even if it costs the government more.
- Gender quotas should be used to increase the number of women in Parliament.
- Tax breaks for investment properties should be restricted to newly-constructed properties.
- Marriage should only be between a man and a woman.
- Terminally ill patients should be able to legally end their own lives with medical assistance.
Five-point less (or fewer/lower)—more (or higher) scale
- How many refugees should Australia admit?
- How much income should former students earn before they have to start repaying their university debt?
- How much should Australia spend on foreign aid?
- How involved should the Australian military be in the fight against Islamic State?
- How much tax should companies pay?
- How much of their health care costs should individuals have to pay directly?
- How much of a role should the private sector have in health care?
- How high should the minimum wage be?
Appendix 2.3: Measuring the distance between the issue preferences of voters and the positions of the established parties
In this chapter voters’ distance from the major parties is measured as the average Euclidean distance from both parties’ positions. This can be written as:

where preference is the answer provided by respondent i for their preferred outcome on each of the issue dimensions outlined above, positionLabor is the position taken by the Labor Party on an issue dimension at the election, and positionCoalition the policy location of the Liberal–National Coalition parties. In this case, if we look at the economic dimension for instance, the position of the Coalition parties was nearly two standard deviations to the right (1.89, or to the right of nearly 95 per cent of the sample), and the Labor Party took a centrist position (0.33). The voter with the mean position (0) would have a distance of 1.11, while a voter with a position two standard deviations to the left (-2) would have an average distance from the parties of 3.11, and might be said to be poorly represented by the party system on this issue.
Appendix 2.4: Regression coefficients
| Greens | Minor left | Xenophon | Other | Christian right | Libertarian | Populist right | |
|---|---|---|---|---|---|---|---|
| Sociotropic economic insecurity | .05 (.01) |
.04 (.03) |
.13 (.02) |
.19 (.03) |
-.06 (.07) |
-.02 (.06) |
.16 (.04) |
| Personal economic insecurity | -.07 (.01) |
-.01 (.03) |
.10 (.02) |
.16 (.03) |
-.15 (.06) |
-.10 (.06) |
.08 .04 |
| Economic issue distance | .30 (.01) |
.23 (.03) |
-.04 (.02) |
.14 (.03) |
-.52 (.07) |
-.06 (.06) |
-.05 .03 |
| Social issue distance | .36 (.01) |
.02 (.03) |
-.32 (.02) |
-.17 (.03) |
-.08 (.05) |
.01 (.05) |
.70 .03 |
| Age 30–44 | -.09 (.05) |
-.16 (.08) |
.62 (.10) |
.15 (.11) |
.02 (.19) |
-.29 (.18) |
.31 .14 |
| Age 45–64 | -.36 (.04) |
-.66 (.08) |
1.04 (.09) |
.15 (.10) |
-.58 (.18) |
-.76 (.17) |
.28 .13 |
| Age 65 plus | -.62 (.04) |
-1.28 (.09) |
1.24 (.09) |
.01 (.11) |
-1.05 (.20) |
-.71 (.18) |
.04 .13 |
| Education university | .75 (.04) |
.25 (.09) |
-.21 (.04) |
-.26 (.06) |
.27 (.16) |
-.03 (.16) |
-.53 .07 |
| Education some tertiary | .01 (.04) |
-.07 (.09) |
-.05 (.04) |
-.20 (.06) |
.03 (.16) |
-.12 (.15) |
-.33 .07 |
| Education high school | .26 (.04) |
-.05 (.08) |
-.05 (.04) |
-.05 (.06) |
-.27 (.16) |
-.08 (.15) |
-.28 .07 |
| Religion atheist | .73 (.03) |
.75 (.07) |
.03 (.03) |
-.12 (.05) |
-2.71 (.22) |
.02 (.11) |
-.61 .05 |
| Religion other | .18 (.03) |
.05 (.08) |
-.01 (.04) |
.04 (.06) |
-1.38 (.19) |
-.23 (.13) |
-.35 .07 |
| Religion Catholic | -.10 (.04) |
-.29 (.09) |
-.18 (.05) |
-.01 (.08) |
-1.98 (.15) |
-.20 (.15) |
-.19 .08 |
| Division type outer metropolitan | -.22 (.03) |
-.16 (.07) |
.08 (.04) |
.37 (.07) |
.71 (.13) |
.22 (.14) |
.69 .09 |
| Division type provincial | -.14 (.04) |
-.22 (.08) |
-.10 (.05) |
.38 (.08) |
.66 (.16) |
.10 (.17) |
.90 .09 |
| Division type rural | -.19 (.03) |
-.39 (.07) |
.14 (.04) |
.50 (.07) |
.71 (.14) |
.31 (.14) |
.90 .08 |
| Sociotropic insecurity x economic issue distance | -.10 (.01) |
-.05 (.03) |
-.08 (.02) |
-.05 (.03) |
-.18 (.08) |
-.17 (.07) |
-.06 .04 |
| Sociotropic insecurity x social issue distance | -.05 (.01) |
.01 (.03) |
.02 (.02) |
.01 (.03) |
.08 (.06) |
.06 (.06) |
.04 .03 |
| Personal insecurity x economic issue distance | -.10 (.01) |
-.01 (.02) |
-.02 (.02) |
.00 (.03) |
-.03 (.07) |
-.12 (.06) |
.07 .03 |
| Personal insecurity x social issue distance | -.09 (.01) |
.03 (.03) |
.02 (.02) |
.01 (.03) |
.10 (.05) |
.01 (.05) |
.09 .03 |
Source: Coefficients from regression models fit to Vox Pop Labs post-election survey data.
Notes: Each column represents a model predicting support for a different party group. Figures represent the values of logistic regression coefficients when all other factors in the model are held at their baseline values (and those in parentheses standard errors). Baselines are Age 18–29, Some school education, Protestant religious affiliation, and inner-metropolitan division.
1 The upper house of the Australian federal parliament. Each of Australia’s six states is represented by 12 senators, and the two territories are represented by two each. Like members of the United States Congress, Australian Senators serve staggered terms, with voters electing half their states’ cohort to the upper house at federal elections (with each territory position open every election). This system increases the chance of success for minor parties, with voters able to rank candidates (or parties) from most to least preferred, allowing an individual to support a more desirable candidate or party who has little chance of election, followed by a more electable candidate, without feeling as though they may have ‘wasted’ their vote.
2 Calvert (1985), Roemer (2001) and Wittman (1973; 1977; 1983) all produced theoretical models explaining this process by showing that party systems cannot retain equilibrium over the long term in a state where the main parties are providing similar policy offerings. As Mair, Sandel and others argue, this is currently the case with market economics. In these models, when the established, government-forming parties are unwilling or unable to offer meaningful policy differences in salient areas where differences are demanded by some segment of the population, another party will attract the support of those disaffected with the status quo (which might include former activists, donors and candidates of the established parties). Even Anthony Downs (1957, 131), who predicted the parties would moderate their policy offerings in order to maximise their electoral success, outlined how excessive policy convergence between established parties could result in new parties forming on the ideological fringe, acting either to pull a major party away from the centre, or (less likely) to attract away enough of its supporters to replace it on the left or right. The growth in populist party support may be this process in action.
3 The large number of party categories is also something that makes Australia an interesting case study to examine the increasing support for populist and protest parties in mature liberal democracies. As this list of parties suggests, there has been a rapid increase in the number of (and support for) these parties. Possibly more than most countries, Australia has a fractured set of minor parties on both the left and the right of the political spectrum. This is potentially caused (or exacerbated) by the proportional and preferential system used to elect senators (discussed above).
4 Of course, it is also possible that causality runs from partisanship to perceptions of the economy. This is likely to be more so the case for perceptions of the wider economy (sociotropic security) than it is for personal economic security, as individuals are more likely to be fully aware of their own circumstances than they are of the state of the overall economy, and therefore less likely to see this through partisan lenses. Figure 2.4 supports this to some extent, with larger differences between the Coalition and other parties along the sociotropic dimension.
5 These findings may be a product of the questions asked. If there had been questions about industrial relations and trade unions, the relative positions of the parties (particularly Labor) and voters may have been different.