1
Trust and insecurity: is economic and political insecurity eroding trust?
Trust and insecurity
Around the democratic world, social and political trust have been in decline since the latter part of the 20th century. Previous empirical investigations in Australia, however, while demonstrating that those expressing trust are in the minority, have provided little evidence of an ongoing decline in trust (Martin 2010). For example, political trust, not unreasonably, seems to fluctuate according to the political context in which it is measured (Bean 2001; 2005; Goot 2002). This chapter explores recent data to check whether levels of trust have changed in the early period of the 21st century and considers what might have driven such changes. What factors serve to enhance or diminish trust? Does a sense of insecurity, for instance, impact negatively on trust in Australia, as has been found elsewhere (Wroe 2014; 2016)? And, to the extent that this may be the case, does it mean that insecurity is eroding trust?
With respect to the political sphere, trust has become a common theme at Australian elections in the early part of the 21st century. Political trust is often mentioned when elections are announced, when party campaigns are officially launched, and when winners and losers review the outcome in the aftermath of an election. After the most recent federal election in July 2016, for example, the narrowly re-elected prime minister, Malcolm Turnbull, continued the theme when he said: ‘There is no doubt that there is a level of disillusionment with politics, with government, and with the major parties’ (Kenny 2016). The same newspaper report referred to the ‘high levels of insecurity and even anxiety among voters about the economic pressures of life’ and the link these had to the election outcome.
This connection neatly encapsulates the concerns of this chapter. It investigates developments over recent years in political trust and then considers the extent to which trust is associated with various indicators of economic and political insecurity. The relationship between political trust and economic insecurity is a complex one. Many scholars have demonstrated or made the case that trust has declined over several decades since the mid-to-late 20th century, both overseas (Nye, Zelikow and King 1997; Dalton 1999; Putnam 2000; Hetherington 2007) and in Australia (Burchell and Leigh 2002; Leigh 2010; Martin 2010). Ironically, however, the erosion of trust seemed to gather momentum around the same time as various economic indicators across the advanced industrial democracies were improving (McAllister 1999; Dalton 2004). But what has surfaced more recently is growing evidence of individual insecurity about economic and other matters, including uncertainty about present and future employment and financial status in the wake of processes associated with globalisation (Wroe 2016).
The analysis in this chapter begins with an attempt to bring us up to date with developments in political trust in Australia. Earlier work has suggested that trust in government is not experiencing secular decline in Australia. Rather, it is subject to fluctuations that appear to depend on the political cycle (Bean 2001; 2005; Goot 2002). When a new government is elected trust rises, presumably based on the optimistic expectation that it will be more trustworthy than its predecessor. Over time trust then cycles down as the realisation dawns that the current government is no more responsive than previous ones. The peaks and troughs are sometimes higher, sometimes lower, sometimes they cycle down more quickly, sometimes the cycle seems to anticipate a change of government by starting to rise an election or so before a government is ousted. But, broadly speaking, the general pattern persists.
Political trust in early 21st-century Australia
To review how the trends in political trust have played out more recently, in the early part of the 21st century, we review time series data from the Australian Election Study (AES), which is a national post-election sample survey conducted at each federal election since 1987 (McAllister and Cameron 2014). The AES has two key questions on political trust, one of which has been asked consistently since 1993 and the other of which has been asked since 1998. The first question asks: ‘In general, do you feel that the people in government are too often interested in looking after themselves, or do you feel that they can be trusted to do the right thing nearly all the time?’ The response categories are: ‘usually look after themselves’, ‘sometimes look after themselves’, ‘sometimes can be trusted to do the right thing’, and ‘usually can be trusted to do the right thing’. In the analysis this question is referred to as ‘trust in government’. The second question asks: ‘Would you say that the government is run by a few big interests looking out for themselves, or that it is run for the benefit of all the people?’ The response categories are: ‘entirely run for the big interests’, ‘mostly run for the big interests’, ‘about half and half’, ‘mostly run for the benefit of all’, and ‘entirely run for the benefit of all’. In the analysis this question is referred to as ‘government by big interests’.
Table 1.1 sets out the responses to these two questions for each year in which they were asked. There are eight time points for the trust in government question and six for the government by big interests question. In this table and throughout the tabular analysis the two trusting and two untrusting response categories are collapsed for ease of presentation. Focusing initially on the trust in government question, the first point to note from the table is that political trust is a minority phenomenon. At no point does a trusting response exceed 50 per cent of the sample and in only one instance does the trusting proportion approach 50 per cent. This came in 1996 when the long-running Hawke–Keating Labor government was finally removed from office after 13 years. In that year, those who said that the government can sometimes or usually be trusted to do the right thing numbered 48 per cent. The next highest point was 43 per cent in 2007, the year in which the Howard Liberal–National government was replaced after 11 years in office. Either side of each of these points, trusting responses ebbed.
Table 1.1: Political trust in Australia, 1993–2016, %.
| The people in government . . . | The government is . . . | ||||
|---|---|---|---|---|---|
| Look after themselves | Can be trusted to do the right thing | Run for the big interests |
About half and half | Run for the benefit of all | |
| 1993 | 66 | 34 | - | - | - |
| 1996 | 52 | 48 | - | - | - |
| 1998 | 67 | 33 | 52 | 36 | 12 |
| 2001 | 68 | 32 | 48 | 36 | 17 |
| 2004 | 60 | 40 | 42 | 38 | 20 |
| 2007 | 57 | 43 | 38 | 42 | 20 |
| 2010 | 63 | 37 | 44 | 43 | 12 |
| 2013 | 66 | 34 | 47 | 37 | 16 |
| 2016 | 74 | 26 | 56 | 33 | 12 |
Source: Australian Election Study (AES), 1993–2016.
Figure 1.1 Trust in government in Australia, 1993–2013, %.
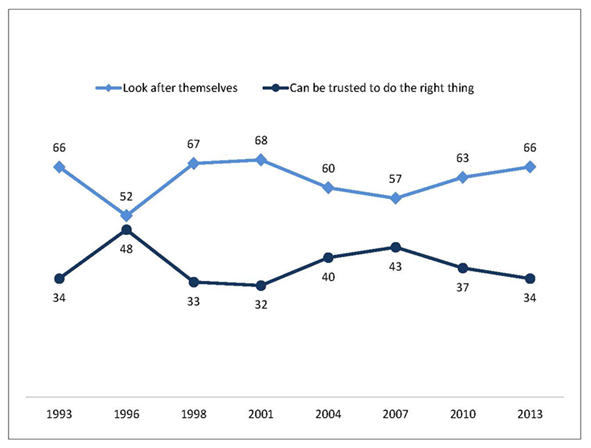
Source: AES 1993–2013.
The earlier observed cyclical fluctuations, with trust trending higher when new governments are elected and lower in between, are thus reinforced over this period. The 2013 federal election, when the Labor government was replaced by the Coalition led by Tony Abbott, proved an exception, with only 34 per cent recording a trusting response in this instance. Coming towards the end of the time series makes it difficult to interpret the significance of this deviation, but one possible interpretation is that it reflects the unusual circumstances of the first minority government at the federal level for 70 years and the highly vexatious parliamentary term that accompanied it (Johnson and Wanna with Lee 2015). The recent 2016 election recorded a further, more exaggerated, extension of this direction, with political trust falling to levels not seen since the late 1970s, in the aftermath of the 1975 constitutional crisis (Bean 2001). Even though the pattern is for trust to trend down when the government in office is re-elected, the 26 per cent of trusting responses in 2016 presents as a critically low level that raises concerns about the current health of Australian democracy. More generally, however, the data in Table 1.1 suggest that the usual baseline level of trust in government appears to be about a third of the electorate giving a trusting response. Figure 1.1 demonstrates how political trust cycles up then down, then back up, then back down again.
Turning to the second question (on who benefits from government), we see that the proportion of trusting responses is lower again. A substantial reason for this is the different question format, which allows for a midpoint response between the trusting and untrusting responses. On every occasion, a third or more of the sample go for the option of saying ‘about half and half’ on the question of whether the government is run by a few big interests looking out for themselves, or for the benefit of all the people. The pattern of higher trust with a new government and lower trust in between elections is also less distinct, because it is diffused by movement in and out of the central response category. Nonetheless, the pattern is visible in some form at the 2007 election, and there are also some intimations of it in 2013, although untrusting as well as trusting responses rose, as the middle category declined. On this evidence, the election of the Abbott government thus seemed to polarise voters, perhaps more than some electoral contests. Overall, however, the responses to both questions in Table 1.1 reinforce the characterisation of political trust as conforming to a cyclical pattern in Australia, with little to suggest a trend either up or down.
What determines trust?
Studies in the past have shown political trust to be linked to various background characteristics, such as age, gender and socioeconomic status (Dalton 2004; Bean 2005; Bean and Denemark 2007). Here we update such links in the Australian context by examining the association between social structure and political trust in the most recent dataset of our time series, the AES from 2013. Table 1.2 utilises the first question from Table 1.1, trust in government, for this exercise (although employing the ‘government by big interests’ question would have yielded similar results). Six key social location factors are examined – sex, age, education, occupation, region of residence and birthplace – plus a key indicator of partisan leanings, party identification.
Table 1.2: Political trust within socio-demographic groups, 2013, %.
| Political trust | ||
|---|---|---|
| People in government look after themselves | People in government can be trusted to do the right thing | |
| Sex | ||
| Male (n=1,848) | 66 | 34 |
| Female (n=1,972) | 66 | 34 |
| Age | ||
| 18–24 (n=402) | 67 | 33 |
| 25–44 (n=1,280) | 70 | 30 |
| 45–64 (n=1,316) | 65 | 35 |
| 65 and over (n=789) | 60 | 40 |
| Education | ||
| No university degree (n=2,550) | 67 | 33 |
| University degree (n=1,206) | 65 | 35 |
| Occupation | ||
| Manual (n=1,030) | 70 | 30 |
| Non-manual (n=2,293) | 64 | 36 |
| Region of residence | ||
| Urban (n=2,713) | 66 | 34 |
| Rural (n=1,067) | 67 | 33 |
| Birthplace | ||
| Australia (n=2,833) | 66 | 34 |
| English-speaking (n=313) | 71 | 29 |
| Non–English speaking (n=587) | 62 | 38 |
| Party identification | ||
| Liberal–National (n=1,473) | 61 | 39 |
| Labor (n=1,354) | 66 | 34 |
| Greens (n=234) | 69 | 31 |
| Other party (n=150) | 73 | 27 |
| No party (n=659) | 73 | 27 |
Source: AES 2013.
The first notable point from Table 1.2 is the lack of association between gender and trust in government in Australia. Neither men nor women are more trusting. In the past there has been, at most, a small gender gap in trust, but now there appears to be none. Age is different. While the very youngest members of the electorate are not necessarily the least trusting, the highest levels of trust are certainly a characteristic of the more mature age cohorts, to the extent that there is a 10 per cent difference in the proportions expressing a trusting response between those in the 25 to 44 age group and those aged 65 and over. Maturing through the life cycle, it would seem, leads to a more trusting disposition.
Increasing education has often been regarded as a prescription for reducing the deficit in political trust, but here the difference in levels of trust between those with and without university degrees is minimal, while there is a somewhat larger gap between those in ‘working-class’ (manual) and ‘middle-class’ (non-manual) occupations. Middle-class, or white-collar workers are some 6 per cent more likely to give a trusting response than working-class, or blue collar, workers.
The next panel in Table 1.2 shows that residing in either urban or rural settings makes little difference to levels of trust in government, but birthplace has an intriguing influence. Compared to the Australian-born, those born outside of Australia in English-speaking countries tend to be less trusting of government, while those born in non-English speaking countries tend to be more trusting. It is interesting to speculate that Australian governments may seem comparatively benign to those who might have come from less stable political regimes. One general message of Table 1.2, however, is that in contemporary Australia political trust does not appear to be strongly shaped by social background.
The strongest differences in political trust are among the partisan groups displayed at the bottom of the table. Previous research has shown that supporters of the party in government at the time exhibit higher levels of trust than supporters of rival parties (Bean 2001). In 2013 this continued to be true, with supporters of the Liberal–National coalition parties showing distinctly higher trust than the rest. Labor Party supporters are next, while those who support the Greens or other minor parties, or who have no party affiliation at all, register much lower levels of trust in government.
Trust and the role of economic and political insecurity
If political trust is not strongly shaped by social structure, has it become linked to insecurities that prevail in relation to personal economic circumstances and other matters? The prominence of such insecurities has increased in the early 21st century and evidence has started to appear recently concerning the impact of economic insecurity, in particular, on political trust in other parts of the world (Wroe 2014; 2016). Economic insecurity has been shown to have a variety of political consequences, having, for example, been linked to electoral support for minor parties (Mughan, Bean and McAllister 2003) and attitudes to the welfare state (Hacker, Rehm and Schlesinger 2013).
In Australia there are certainly indications that many citizens feel insecure about a variety of economic and political concerns. Table 1.3 shows the extent to which the feelings of insecurity abound, based again on the most recent data from 2013. For the purposes of this analysis, three different types of insecurity have been identified: economic, military and cultural. Economic insecurity focuses on personal economic circumstances, particularly in relation to employment. Military insecurity addresses concerns about Australia’s defence. Cultural insecurity looks at perceptions of the advantages and disadvantages that accompany immigrants coming to Australia.
Looking first at the economic sphere, the top section of Table 1.3 shows that while the majority of respondents (59 per cent) view it as very or somewhat unlikely that their household income could be severely reduced in the next 12 months, there is a significant proportion (over four in ten) who say the reverse. Furthermore, when asked if they lost their job, or if their spouse or partner lost their job, how easy it would be to find another job in the next 12 months, almost two thirds say it would be very or somewhat difficult in both cases. In combination, these responses are indicative of a substantial degree of personal economic insecurity amongst the Australian public.
Table 1.3: Perceptions of insecurity, 2013, %.
| Economic | |||
| Income severely reduced in next 12 months (n=3,873) | Likely 41 | — | Unlikely 59 |
| Ease of finding another job in next 12 months (n=3,408) | Easy 35 | — | Difficult 65 |
| Ease of partner finding another job in next 12 months (n=2,573) | Easy 37 | — | Difficult 63 |
| Military | |||
| Trust US to come to Australia’s defence if security threatened (n=3,865) | Trust 82 | — | Not trust 18 |
| Australia able to defend itself if attacked (n=3,827) | Agree 28 | Neither agree nor disagree 29 |
Disagree 43 |
| Cultural | |||
| Immigrants increase the crime rate (n=3,837) | Agree 40 | Neither agree nor disagree 29 |
Disagree 31 |
| Immigrants are good for the economy (n=3,834) | Agree 56 | Neither agree nor disagree 29 |
Disagree 15 |
| Immigrants take jobs from people born in Australia (n=3,834) | Agree 35 | Neither agree nor disagree 28 |
Disagree 38 |
| Immigrants make Australia more open to new ideas and cultures (n=3,836) | Agree 73 | Neither agree nor disagree 17 |
Disagree 10 |
Source: AES 2013.
Notes: Questions: On economic insecurity: How likely or unlikely do you think it is that your household’s income could be severely reduced in the next 12 months? (Very likely; somewhat likely; somewhat unlikely; very unlikely.) If you lost your job, how easy or difficult would it be to find another job in the next 12 months? (Very easy; somewhat easy; somewhat difficult; very difficult.) If your spouse/partner lost their job, how easy or difficult would it be for them to find another job in the next 12 months? (Very easy; somewhat easy; somewhat difficult; very difficult.) On military insecurity: If Australia’s security were threatened by some other country, how much trust do you feel Australia can have in the United States to come to Australia’s defence? (A great deal; a fair amount; not very much; none at all.) Australia would be able to defend itself successfully if it were ever attacked. (Strongly agree; agree; neither agree nor disagree; disagree; strongly disagree.) On cultural insecurity: Immigrants increase the crime rate; Immigrants are generally good for Australia’s economy; Immigrants take jobs away from people who are born in Australia; Immigrants make Australia more open to new ideas and cultures. (Strongly agree; agree; neither agree nor disagree; disagree; strongly disagree.)
The next panel in Table 1.3 suggests that insecurity is not limited to the economic realm. Issues of defence and military security have become more salient since the threat of terrorism has increased in recent times (Gibson and McAllister 2007). Although 82 per cent feel that Australia can have a great deal or a fair amount of trust in the United States to come to Australia’s defence if Australia’s security were threatened by some other country, only 28 per cent agree that Australia would be able to defend itself successfully if it were ever attacked. A similar number neither agree nor disagree with this proposition, leaving 43 per cent who take the view that Australia would not be able to defend itself.
In an era in which debates over refugees, asylum seekers and immigration more broadly abound, both internationally and within Australia (Betts 1999; Goot and Watson 2005; Nair and Bloom 2016), questions on the impact of immigration may also provoke feelings of insecurity. In the bottom panel in Table 1.3 we see that significant minorities express the view that immigrants increase the crime rate and take jobs away from people who are born in Australia (40 and 35 per cent respectively). In the former instance, this group outnumbers those who disagree that immigrants increase the crime rate. The view appears more positive, however, when the proposition is that immigrants are generally good for the economy and that they make Australia more open to new ideas and cultures. Only 15 per cent and 10 per cent, respectively, express ‘insecure’ views on these questions, while fully 56 per cent and 73 per cent take an open stance on these aspects of the effect of immigration.
The trust–insecurity nexus
Overall, Table 1.3 suggests that insecurity is not rife within the Australian electorate but that it is present in significant amounts, in all three spheres examined – economic, military and cultural. The question of interest is whether this insecurity influences political trust. Table 1.4 takes the first step towards addressing this question by showing how trust in government varies according to whether citizens feel secure or insecure economically. Based on recent research in Europe and the United States (Wroe 2014; 2016), there is certainly an expectation that personal economic insecurity will tend to drag trust down.
Table 1.4: Political trust by economic insecurity, 2013, %.
| Political trust | ||
|---|---|---|
| People in government look after themselves | People in government can be trusted to do the right thing | |
| Income severely reduced in next 12 months | ||
| Likely | 72 | 28 |
| Unlikely | 62 | 38 |
| Ease of finding another job in next 12 months | ||
| Easy | 65 | 35 |
| Difficult | 69 | 31 |
| Ease of partner finding another job in next 12 months | ||
| Easy | 65 | 35 |
| Difficult | 68 | 32 |
N=3,955. Source: AES 2013.
Table 1.4 indeed reveals a clear relationship between insecurity and trust when the question focuses on the likelihood of a severe reduction in household income. Those who view this as an unlikely development are 10 per cent more inclined to say that people in government can be trusted to do the right thing than those who think it is likely that their income could be severely reduced in the next 12 months. Put another way, 38 per cent of the economically secure trust the government compared to only 28 per cent of the economically insecure. When attention turns to the ease of finding another job if the current one were lost, although the level of insecurity is higher, as we saw in Table 1.3, the gap in trust is smaller – only 3 or 4 per cent. On these questions, the insecure are only slightly less politically trusting.
Table 1.5 covers the same ground for military insecurity. Given that the question about the United States coming to Australia’s aid specifically uses the term ‘trust’, we might expect to see a clear link between this item and trust in government. Such a link is there, but it is not as strong as might have been expected. Some 35 per cent of those who trust the United States to come to Australia’s defence in a time of need also trust the people in government, compared to 29 per cent of those who do not have faith in the United States coming to Australia’s defence. On the question of Australia’s ability to defend itself, the gap in trust is narrower again, with only a 3 per cent gap in political trust between those who think Australia could defend itself and those who think it could not.
Table 1.5: Political trust by military insecurity, 2013, %.
| Political trust | ||
|---|---|---|
| People in government look after themselves | People in government can be trusted to do the right thing | |
| Trust US to come to Australia’s defence if security threatened | ||
| Trust | 65 | 35 |
| Not trust | 71 | 29 |
| Australia able to defend itself if attacked | ||
| Agree | 64 | 36 |
| Neither agree nor disagree | 66 | 34 |
| Disagree | 67 | 33 |
N=3,955. Source: AES 2013.
The final set of data is perhaps the most intriguing. On the evidence in Table 1.6, cultural insecurity has a stronger relationship to political trust than economic or military insecurity. Each of the four questions on the impact of immigrants shows a noticeable spread of political trust. Thus, while 38 per cent of those who disagree that immigrants increase the crime rate say that people in government can be trusted to do the right thing, only 29 per cent of those who think that immigrants do increase the crime rate express a trusting view. The gap is larger again when the question is whether immigrants are generally good for Australia’s economy. Some 37 per cent who agree that immigrants are good for the economy trust the people in government, but of those who disagree only 24 per cent express trust. Similarly, trust in government is distinctly higher among those who do not feel that immigrants take jobs away from the Australian-born (37 per cent) than it is for those who believe that they do (28 per cent). On the final question of whether immigrants make Australia more open to new ideas and cultures, 37 per cent of those who affirm this view also indicate that they trust the people in government to do the right thing, while a low 22 per cent of those who disagree with the proposition display political trust.
Table 1.6: Political trust by cultural insecurity, 2013, %.
| Political trust | ||
|---|---|---|
| People in government look after themselves | People in government can be trusted to do the right thing | |
| Immigrants increase the crime rate | ||
| Agree | 71 | 29 |
| Neither agree nor disagree | 64 | 36 |
| Disagree | 62 | 38 |
| Immigrants good for the economy | ||
| Agree | 63 | 37 |
| Neither agree nor disagree | 67 | 33 |
| Disagree | 76 | 24 |
| Immigrants take jobs away from people born in Australia | ||
| Agree | 72 | 28 |
| Neither agree nor disagree | 64 | 36 |
| Disagree | 63 | 37 |
| Immigrants make Australia more open to new ideas and cultures | ||
| Agree | 63 | 37 |
| Neither agree nor disagree | 72 | 28 |
| Disagree | 78 | 22 |
N=3,955. Source: AES 2013.
This 15 per cent difference in the level of trust on the question of immigration bringing new ideas and cultures is the largest for any variable examined in this analysis. It is conceivable that the association between openness to immigration and trust may reflect a more general trusting outlook which incorporates government, migrants and other spheres. Another key message from Table 1.6 is that, while the proportions expressing an insecure response about the effects of immigration on the economy and new experiences are small, those who do feel insecure are more distrusting than any other group under consideration. Certain items in Table 1.6 – whether immigrants are good for the economy and whether immigrants take jobs away from people born in Australia – also see cultural and economic insecurity coming together, and this combination of factors generating a sense of insecurity among some members of the Australian public may be more influential in shaping political trust than any single factor on its own.
The final part of the analysis brings together all of the factors examined in the chapter to show which ones have an impact on political trust net of other influences. The analytic technique employed is ordinary least squares regression analysis and Table 1.7 displays both the unstandardised (b) and standardised (beta) regression coefficients. Apart from age (in years) all variables are scored on their original metric, rescaled to run from a low of 0 to a high of 1. Those that have statistically significant effects on trust in government are asterisked. Thus Table 1.7 shows that, of the socio-demographic variables, sex, education, occupation, and region of residence have no significant impact on political trust. Age and birthplace do have an effect: older people are more trusting and those born in English-speaking countries outside of Australia are less trusting. With respect to party identification, Table 1.7 confirms the bivariate data in Table 1.2 by showing that Labor, Green and those with minor party or no party identification are all significantly less trusting of the government than coalition party supporters.
Table 1.7: Effects on political trust (multiple regression).
| b | β | ||
|---|---|---|---|
| Sex (male) | -.01 | -.02 | |
| Age | .002 | .09** | |
| Education (university degree) | -.02 | -.02 | |
| Occupation (non-manual) | .03 | .04 | |
| Region of residence (rural) | -.01 | -.01 | |
| English-speaking birthplace | -.05 | -.04* | |
| Non-English speaking birthplace | .02 | .02 | |
| Party identification Labor | -.06 | -.09** | |
| Party identification Green | -.11 | -.08** | |
| Party identification other/none | -.11 | -.13** | |
| Income not likely to be reduced | .22 | .11** | |
| Easy to find new job – self | .05 | .02 | |
| Easy to find new job – partner | .03 | .02 | |
| Trust US to defend Australia | .15 | .06** | |
| Australia able to defend itself | .10 | .06** | |
| Immigrants increase crime rate | -.08 | -.05 | |
| Immigrants good for economy | .10 | .06* | |
| Immigrants take jobs | -.04 | -.02 | |
| Immigrants make Aust. more open | .13 | .06* | |
| R-squared | .08 | ||
N=3,955. * p < .05; ** p < .01. Source: AES 2013.
Turning to the various indicators of insecurity, the measure of likely household income reduction has a clear and significant effect, although the questions on ease of finding another job do not. The two measures of military insecurity show significant and distinct effects net of other factors, despite having only modest associations in the bivariate table shown above. And finally, the two cultural insecurity variables that displayed the strongest bivariate associations (about migrants being good for the economy and making Australia more open to new ideas and cultures) retain a statistically significant effect in the multivariate analysis, while the other two do not.
Conclusion
As Wroe (2016) has commented, it has become commonplace for political leaders in established democracies to lament the low and declining levels of political trust. Even louder on the same subject tend to be the voices of political commentators, and such commentary has tended to grow over the years. Australia has been no exception to this practice. Yet in Australia, at least, political trust does not appear to have declined in any systematic fashion. Trust in government is not high – it is, has been and remains a minority phenomenon – but the evidence belies those who argue or imply that it is on an inexorable downward path (Burchell and Leigh 2002; Leigh 2010).
In general, the evidence in this chapter is consistent with the findings of previous work in showing that political trust is trending neither down nor up. Instead, the evidence provides a solid foundation for extending the conclusion that political trust ebbs and flows according to the political cycle (Bean 2001; 2005; Goot 2002). In the main, political trust rises when a new government is elected, particularly if the previous government has had a lengthy term in office. Trust then declines during the term of the new government until that government in turn is replaced, at which point trust registers another high point. In between these times, the norm seems to be that about a third of the electorate expresses trust in government, while the remaining two thirds do not. Whether the low point in trust observed at the 2016 election does or does not represent an aberration will only be seen in time. It could just as well reflect a period of particular public disquiet with Australian politics and politicians as herald a new era of low trust. The cyclical pattern over time points to it being more likely to be the former than the latter.
This chapter set out to consider whether economic and political insecurity is eroding political trust. It found a connection between insecurity and trust, but not a terribly strong one. Based on the findings of the analysis, insecurity might reasonably be said to undermine trust, to a degree at least, but it is too big a stretch to say that it is eroding trust. Furthermore, for the most part, the links between insecurity and political trust are rather modest. An association is present in some form in every instance, but it is mainly in the realm of cultural insecurity that it shows through clearly and consistently. Perhaps surprisingly, economic insecurity on its own does not feature very strongly and the consequences for political trust of military insecurity are minor. There is much more work to be done, but on the evidence here, one of the places where insecurity matters most for trust is at the intersection of cultural and economic insecurity.
Yet, as a phenomenon that has largely come to prominence in the wake of globalisation (Wroe 2016), if insecurity grows it may pose a greater threat to trust than currently. It is difficult to say how likely that is at present, but it does point to the need to monitor the connection between the two. As Hetherington (2007; see also Martin 2010) has argued, political trust matters, in a variety of ways, and economic and political insecurity matter for trust, at least to some extent. It is thus not beyond the bounds of possibility that an increase in insecurity could put further downward pressure on political trust.
References
Australian Election Study (2016). The AES studies: 1993–2016. http://www.australianelectionstudy.org/voter_studies.html.
Bean, Clive (2001). Party politics, political leaders and trust in government in Australia. Political Science 53(1), 17–27.
Bean, Clive (2005). Is there a crisis of trust in Australia? In Australian social attitudes: the first report. Shaun Wilson, Gabrielle Meagher, Rachel Gibson, David Denemark and Mark Western, eds. 122–40. Sydney: UNSW Press.
Bean, Clive and David Denemark (2007). Citizenship, participation, efficacy and trust in Australia. In Australian social attitudes 2: citizenship, work and aspirations. David Denemark, Gabrielle Meagher, Shaun Wilson, Mark Western and Timothy Phillips, eds. 58–80. Sydney: UNSW Press.
Betts, Katharine (1999). The great divide: immigration politics in Australia. Sydney: Duffy & Snellgrove.
Burchell, David and Andrew Leigh, eds (2002). The prince’s new clothes: why do Australians dislike their politicians? Sydney: UNSW Press.
Dalton, Russell J. (1999). Political support in advanced industrial democracies. In Critical citizens: global support for democratic governance. Pippa Norris, ed. 57–77. Oxford: Oxford University Press.
Dalton, Russell J. (2004). Democratic challenges, democratic choices: the erosion of political support in advanced industrial democracies. Oxford: Oxford University Press.
Gibson, Rachel K. and Ian McAllister (2007). Defence, security and the Iraq war. In Australian social attitudes 2: citizenship, work and aspirations. David Denemark, Gabrielle Meagher, Shaun Wilson, Mark Western and Timothy Phillips, eds. 37–57. Sydney: UNSW Press.
Goot, Murray (2002). Distrustful, disenchanted and disengaged? Public opinion on politics, politicians and the parties: an historical perspective. In The prince’s new clothes: why do Australians dislike their politicians? David Burchell and Andrew Leigh, eds. 9–46. Sydney: UNSW Press.
Goot, Murray and Ian Watson (2005). Immigration, multiculturalism and national identity. In Australian social attitudes: the first report. Shaun Wilson, Gabrielle Meagher, Rachel Gibson, David Denemark and Mark Western, eds. 182–203. Sydney: UNSW Press.
Hacker, Jacob S., Philipp Rehm and Mark Schlesinger (2013). The insecure American: economic experiences, financial worries, and policy attitudes. Perspectives on Politics 11(1), 23–49.
Hetherington, Marc J. (2007). Why trust matters: declining political trust and the demise of American liberalism. Princeton, NJ: Princeton University Press.
Johnson, Carol and John Wanna (with Hsu-Ann Lee), eds (2015). Abbott’s gambit: the 2013 Australian federal election. Canberra: ANU Press.
Kenny, Mark (2016). Australian federal election 2016: Turnbull takes responsibility for poor campaign as count continues. Sydney Morning Herald, 5 July.
Leigh, Andrew (2010). Disconnected. Sydney: UNSW Press.
Martin, Aaron (2010). Does political trust matter? Examining some of the implications of low levels of political trust in Australia. Australian Journal of Political Science 45(4), 705–12.
McAllister, Ian (1999). The economic performance of governments. In Critical citizens: global support for democratic governance. Pippa Norris, ed. 188–203. Oxford: Oxford University Press.
McAllister, Ian and Sarah M. Cameron (2014). Trends in Australian political opinion: results from the Australian Election Study, 1987–2013. Canberra: Australian National University.
Mughan, Anthony, Clive Bean and Ian McAllister (2003). Economic globalization, job insecurity and the populist reaction. Electoral Studies 22(3), 617–33.
Nair, Parvati and Tendayi Bloom, eds (2016). Migration across boundaries: linking research to practice and experience. London and New York: Routledge.
Nye, Joseph S. Jr, Philip D. Zelikow and David C. King, eds (1997). Why people don’t trust government. Cambridge, Mass.: Harvard University Press.
Putnam, Robert D. (2000). Bowling alone: the collapse and revival of American community. New York: Simon & Schuster.
Wroe, Andrew (2014). Political trust and job insecurity in 18 European polities. Journal of Trust Research 4(2), 90–112.
Wroe, Andrew (2016). Economic insecurity and political trust in the United States. American Politics Research 44(1), 131–63.