4
Evidence to guide and improve care
Decisions about care quality need to be based on the best available evidence. This chapter discusses the purpose of CQI data, and the evidence commonly used in continuous quality improvement (CQI), focusing mainly on evidence for improving clinical care. We introduce the concept of quality indicators and the role of best-practice guidelines in relation to measures of quality. Types and sources of CQI data, and common challenges and strategies relating to data quality, are also discussed. The chapter includes practical tips for generating information to assess quality of care in primary healthcare (PHC) settings.
The purpose of CQI data
CQI cycles (see Chapters 2, 6) provide a systematic approach to collecting and using data. Data are essential for guiding improvement efforts by identifying quality problems, knowledge gaps and improvement opportunities. You and your PHC team may accurately identify improvement needs based on your experience and observation, but these decisions are likely to be influenced by your individual interests, and different colleagues will have different opinions. Sometimes the focus of improvement is determined by external experts rather than data or evidence on performance of local primary healthcare services; this approach may divert quality improvement efforts from actual priorities. Data provide evidence to confirm priority issues that should be addressed through CQI at the local service level. Data also have an ongoing role in helping to monitor service performance and sustain improvement. Without appropriate data of suitable quality, it is difficult to determine the effect of change initiatives or demonstrate success. Most data used in CQI should already be routinely collected for client or organisation management purposes. This is an important principle: CQI should be part of routine business and as efficient as possible.
Most data used in CQI should already be routinely collected for client or organisation management purposes.
Quality indicators
Data collected for CQI are organised around various indicators of healthcare quality. In general terms, a health indicator is a measure that summarises information about a topic or organises information from data collected through health practice systems. This information is used to inform health system performance and research in population health. Healthcare indicators transform data on healthcare encounters between providers and clients into numbers and metrics to allow for monitoring of healthcare practices and quality, and for making (non-descriptive) comparisons: for example, between age groups in a population. Examples of health indicators are the proportion of children with up-to-date immunisation records and the percentage of clients satisfied with their care experience.
Indicators expressed in this way are useful in CQI because they can track changes over time. They enable comparison across geographic, administrative or organisational boundaries. It is important to be aware that numbers and metrics are merely that; they don’t provide comprehensive information for understanding people’s experiences of care or caregiving, the quality of relationships between service providers and clients or communities, or the nuanced factors that influence health outcomes. Qualitative data are needed for these purposes.
Indicators of healthcare quality generally focus on the structure, processes and outcomes of care: the quality improvement framework developed by Donabedian (see Chapter 2). Table 4.1 summarises how the structure-process-outcome quality framework is applied in PHC. Data on care structure, processes and outcomes are all potentially important for effective CQI. Furthermore, these data need to be brought together for an accurate assessment of care quality. Most of the CQI tools described in the next chapter collect and bring together data for different types of indicators, as determined by the focus of the CQI activity, the purpose of the tool and contextual factors. In Indigenous PHC contexts, for example, questions are raised about who decides what and how indicators of quality are used.1 More generally, there are calls for Indigenous community control of data about Indigenous peoples, to ensure that data reflect Indigenous values and concepts of health and have meaning for improving Indigenous health and wellbeing (see Chapters 21 and 22).
Data on care structures, processes and outcomes are all potentially important for CQI.
|
Health care: general |
Primary health care: considerations | |
|---|---|---|
|
Structure |
Facilities, equipment, finances |
Health governance arrangements |
|
|
Human resources (e.g., mix and availability of practitioners, training) |
Size and characteristics of the service population (e.g., languages spoken, groups represented, average income) |
|
|
Organisational structures (e.g., policies, care guidelines, how services are paid for)2 |
Geographical setting and access to hospital/specialist care and community resources |
|
Processes |
Care delivery processes (e.g., obtaining information, therapeutic procedures, care coordination and continuity, interactions) |
Care processes include preventive care and health promotion; client/family education; diagnosis, treatment and management of health conditions including client self-management; health-related interactions between service providers, families and communities |
|
|
Organisational processes (e.g., processes and systems for managing information, staff, facilities and other resources)3 |
Processes and pathways by which needs are assessed, care is provided and therapeutic relationships are developed; leadership and teamwork; use of client information systems and decision support; links and collaboration with other services/agencies and integration of systems for meeting the healthcare needs of clients and communities or population groups |
|
Outcomes |
Effects of care on the health of clients and populations (e.g., changes in clinical outcomes, behaviours, knowledge) |
Social, cultural and environmental wellbeing outcomes are included as measures of care quality
|
|
|
Client satisfaction/experience |
- |
|
|
Physical rehabilitation |
- |
|
|
Health-related quality of life4 |
- |
Table 4.1 Applying a structure-process-outcome quality framework in primary health care.
Clinical guidelines for best practice
Indicators or measures of quality in clinical care are based on knowledge of what comprises best practice. There has been a widespread move towards developing and implementing clinical practice guidelines for best-practice clinical care, and their use is well established in many PHC settings. Intended as recommendations to optimise client care, clinical practice guidelines help practitioners to make decisions about appropriate health care for specific clinical circumstances, and support clinicians and clients in shared decision-making. Guidelines are available across the scope of clinical PHC relevant to various settings. Some examples are referenced in Part III.
Measures of quality in clinical care are based on knowledge of what comprises best practice.
Clinical practice guidelines should be informed by systematic reviews of the best available evidence and expert consensus. They should be collaboratively developed and updated by unbiased experts from relevant medical and health disciplines, researchers, health practitioners who will be end users, and clients. Guidelines are often developed under the auspices of a professional college or association, with approval by a high-level health governing body such as the World Health Organization (WHO) or, in Australia, the National Health and Medical Research Council (NHMRC). International online repositories make clinical guidelines widely accessible.5 In addition to international and national guidelines, local guidelines or specific guidelines for working with population groups (such as Indigenous peoples) are available.
Most published guidelines aid diagnosis and treatment of a single disease or condition, such as diabetes, or a specific aspect of care (such as blood sugar level or blood pressure). Some clinical resources for PHC practitioners bring guidelines together to promote coordinated, standardised client-centred care. This is appropriate to PHC, where it is vital that practitioners take a holistic approach, and where care of specific conditions needs to be considered in the context of other immediate and longer-term care needs and risks to health. These types of resources are also of practical value where service populations have particular health, social and cultural needs, where resources are limited, or where factors such as high staff turnover or location mean that strategic, coordinated and locally appropriate approaches to care are particularly important. An Australian example is the suite of PHC manuals for practitioners working in geographically remote and Aboriginal and Torres Strait Islander settings. The PHC manuals cover clinical presentations that are common and significant, that have different presentations and management issues to those in “mainstream” Australian general practice, are life threatening and need emergency care, and are important for public health. For example, the Standard Treatment Manual6 covers (among other conditions) the prevention and management of diabetes, cardiovascular and renal disease, which occur at high rates among Aboriginal and Torres Strait Islander peoples and can be challenging to manage under remote living conditions. A Women’s Business Manual7 is a culturally respectful resource that keeps women’s health confidential and separate from other health issues. Preventive health assessment guidelines have also been developed for Aboriginal and Torres Strait Islander PHC by the National Aboriginal Community Controlled Health Organisation and the Royal Australian College of General Practitioners (2018).8
Clinical practice guidelines are important resources for CQI.
Clinical practice guidelines are important resources for CQI in clinical care. They provide a reference point or standard for PHC teams and services to compare the care they provide with the best available evidence on recommended care. Clinical practice guidelines generally form the foundations of the clinical audit tools used to generate data on clinical performance, and which in turn can be used for CQI. The focus on best-practice guidelines in developing and using audit tools raises awareness of contemporary evidence-based care and is an important educational and professional development element of the CQI process.
It is important to note that gathering data on clinical performance in relation to best-practice guidelines does not in itself constitute CQI, even when it includes a process for feeding back data to staff – but these are important steps in the CQI process. The CQI process (or cycle) includes gathering data, reporting, analysis and interpretation, and then using that information to identify priorities for improvement and to plan and implement improvement strategies.
Generating and feeding back data on clinical performance in relation to best practice guidelines does not constitute CQI. It is only part of the CQI process or cycle.
Regardless of how clinical practice guidelines are presented, they are just one element informing good medical decision-making. Decisions about care should take account of factors such as clients’ preferences and values, clinicians’ experience and values, the context in which care is provided, and the availability and distribution of resources. These factors are relevant for assessing care quality. As a resource for informing value-based care, clinical practice guidelines are also being used to develop incentives (such as pay for performance) and standards for PHC. (See “Value and quality” in Chapter 2.)
Guidelines for best-practice health promotion
By conventional measures of evidence quality, the evidence base guiding best practice in non-clinical areas of PHC, such as health promotion, is generally not as strong as the evidence base for clinical care for medical conditions. Step-by-step guides, packages, frameworks and resources are available to help with evidence-informed health promotion practice and tend to be designed around specific topics such as smoking, alcohol use, heart health, cancer symptom awareness or mental health. Some resources are designed for use with specific populations, such as Indigenous populations. We note that there is limited information about the effectiveness of health promotion tools designed for use with Aboriginal and Torres Strait Islander populations.9
Knowledge for developing and implementing effective health promotion interventions is growing. We expect the availability of CQI tools and processes in health promotion and other areas of comprehensive PHC to increase as the evidence base for improving the cultural, social and environmental determinants of health grows in quality and in scope.
Types and sources of data
Different types of data are brought together to build meaningful information about the quality of PHC. These are some common types:
- clinical indicator and service delivery data derived from client health records – for example, data about care processes, clinical measures/results, client health behaviours (such as smoking) and medications prescribed
- demographic and health status data recorded in client health records, which can be used to define population groups – for example, by age, gender, diagnosis of a chronic condition
- health service and community data, collected to understand the PHC service’s operating environment – for example, size of service population, geographic location, governance arrangements
- data about the range of health professionals providing client care, which are needed to understand how the PHC service operates – for example, staff numbers and skill mix, team structure and function, health infrastructure and resources
- data about client perceptions of care quality and experiences of service delivery – for example, client-reported experience and outcome surveys, complaints data
- staff perceptions of care quality and experiences of delivering care.
Incident-reporting and risk-management data, claims data (for example, claims made through a health insurance or medication subsidy scheme), and key performance indicator data collected for higher level policy purposes (such as to measure progress on health equity between population groups) may also be useful for CQI.
Other types of data relevant to improving comprehensive PHC may include:
- data about changes in client knowledge and behaviours recorded in client records or health promotion program records
- data about community health program activities and outcomes
- data from research and evaluation reports – for example, health outcomes, health literacy, client and staff perceptions, community actions, system responses
- community stories/narratives about actions taken for improving health and wellbeing
- other data relevant to the social, cultural and environmental determinants of health – for example, demographic, education, child care, child protection, recreation, housing, aged care, emergency services, food security, employment, income, community governance, criminal justice data.
CQI tends to use data on structures, processes and outputs, which are relatively short term and feasible to collect and monitor locally, rather than outcomes and effect. Outcome and effect data require longer timeframes, may not be readily available at a service or local level, and could be more affected by factors outside the direct control of the PHC service or team.
CQI tends to use data on structures, processes and outputs, which are relatively short term and feasible to collect and monitor.
With so much data to choose from, the key question is “Which data fit our CQI purpose and question?” Where data do not exist, you also need to ask, “What data do we need to collect to fill in our gap in knowledge and understanding?”
Which data fit our CQI purpose and question? What data do we need to collect to fill in our gap in knowledge and understanding?
Data quality
No matter which data sources are used in CQI, the reality is that decisions will be as good as the quality of the data they are based on. Accurate and more complete data enables more precise identification of problems, the prioritisation of improvement initiatives and objective assessment of whether change and improvement have occurred. Conversely, inaccurate or incomplete data can undermine the credibility and value of the CQI process.10
Overcoming common challenges to data quality
Complete and accurate recording of client information is vital for providing high-quality PHC. Some characteristics of PHC (as described in Part I) present challenges to data quality and some gaps in quality occur because PHC is provided by multiple health professionals, through different services and locations. Furthermore, PHC services generally have regular clients and long-term responsibility for providing care (for example, to manage chronic conditions), and for responding to needs across the life cycle. Clinical information systems need the ability to hold, generate, link and share information for the purposes of ongoing care and for CQI. Attention to data quality and consistency improves the effectiveness of CQI. Some tips for improving data quality are listed in Box 4.1.
Attention to data quality and consistency improves the effectiveness of CQI.
Box 4.1: Strategies for improving data quality
- Ensure clinical information systems are easy to use and accessible to all staff who provide client care.
- Offer regular staff training in the use of clinical information systems and correct documentation of care in client files. Depending on the service structure, this may involve staff based at the PHC centre or practice, locum staff and visiting practitioners (for example, vision services, dietitians).
- Ensure timely data entry into clinical information systems, so that clinical decisions and CQI priorities are based on current circumstances.
- Establish systems for efficient transfer of client care information between providers (for example, between specialists and general practitioners, between hospitals and PHC services, between PHC program teams).
- Use the same clinical information system across PHC services where possible. This enables benchmarking of CQI data between similar services/practices, aggregation of data and efficient information transfer.
- Use CQI techniques to assess and improve data quality.
The use of data in CQI cycles can be a catalyst for improving data quality.11 Undertaking CQI can demonstrate the type of information that is useful for improving care and expose gaps in client records and data entry that may negatively affect continuing care. So, a message for readers with concerns about the quality of available data is not to wait until you have perfect data for CQI. Remember, CQI is about continuous learning and improvement. By starting where your PHC service or program data are at, you will see how to improve data to support CQI and improve care for clients. You will be able to reflect, over successive CQI cycles, on how far the team or service has come in CQI learning and implementation.
Example: participating in CQI can improve data quality
An evaluation of the Northern Territory’s CQI investment strategy was untaken after five years of implementation. The evaluation found that the quality of clinical data at the PHC service level had improved due to staff participation in clinical audits:
PHC staff participation in file audits as part of the CQI process has been a key reason behind the increase in data quality. Several clinicians spoke of a ‘light bulb moment’ when they realised the importance of accurate data entry. Going through audit processes was also seen as supporting improved patient care, for example, by increasing understanding of how to use the recall system correctly, meaning patients are being more actively followed up.12
Don’t wait until you have perfect data for CQI. Undertaking CQI improves data quality.
Generating information to assess the quality of clinical care
There are links between the quality of systems for managing clients’ health records, the integration of those records with information technology systems (for example, to recall clients) and service quality.13
Functional clinical information systems are crucial for generating information to assess care quality. PHC services may have an electronic clinical information system, a mix of electronic information systems and paper-based systems, or a fully paper-based record system in use. All are suitable for generating data for use in CQI.
Generating data from electronic clinical information systems
There is widespread adoption of electronic clinical information systems in PHC. These computer systems capture, store and display current client data to inform clinical decision-making and care planning. Client data may include clinical notes, medication history, laboratory reports, images and reports. In addition to supporting evidence-based and client-centred care, the use of electronic clinical information systems has the potential to overcome some of the challenges of gathering data to support CQI in PHC settings.
It is important that the data captured are reliable: that is, complete and accurate. We need to be able to trust that the data we use for CQI can provide the information we require, free from duplicates and errors. In general, research shows poor reliability of client data extracted from electronic clinical information systems,14 with critical gaps in the recording of client data (for example, missing data on diagnoses) and inconsistent recording of different indicators.15 Many electronic information systems currently in use in Australia, for example, are not designed for detailed data analysis: the information extracted may be too generalised for a CQI process at the PHC service level. Further, the use of various software systems and data extraction tools makes it difficult to link and aggregate data across services to identify common improvement priorities.
When starting to extract CQI data from electronic data systems, it is likely that the first few cycles will be around improving data quality and building confidence in data: agreeing on what and how client diagnoses and items of care will be captured in the system, and where they need to be recorded so they can be extracted. For example, if a client’s blood pressure record is entered in the wrong place in the system (for example, in progress notes instead of as a service item), it will not be captured in data reports. As electronic clinical information systems in PHC continue to be developed and improved, the ability to extract detailed, high-quality data about client care is increasing.
Generating data for clinical auditing
Clinical auditing is widely used as a step in the CQI process. A clinical audit is used to find out if health care is being provided in line with clinical practice guidelines. Audit results let providers and clients know where their service is doing well, and where there could be improvements. Our approach to CQI has been to develop and use audit tools to collect information that has been recorded in clinical client records about a particular area of health care (for example, maternal health care, preventive cardiovascular disease care). These audit tools are based on evidence-based best-practice guidelines or other protocols or both, and their use provides information on the extent to which care recorded in client records reflects best practice across the range of items of care in relevant guidelines (including commonly used and important indicators, such as blood pressure and blood glucose levels for adult clients with chronic illnesses). This approach provides data on aspects of care that are being delivered relatively well or not so well at the local service level, thus providing a basis for local healthcare teams to identify locally relevant priorities for improvement. The benefits of using this approach are summarised in Box 4.2.
Box 4.2 Six benefits of using evidence-based clinical audit tools
- Supports implementation of best-practice guidelines or protocols
- Focuses on the most important items of care within the guidelines or protocols
- Collects information already recorded in client clinical records
- Measures the extent to which care recorded reflects best practice
- Provides data on aspects of care that are being delivered relatively well or not so well
- Helps PHC teams to identify locally relevant priorities for improvement
There are two ways to generate client data for clinical auditing: by electronically generating all relevant client records from your service; or by selecting a representative sample of client records for more detailed (perhaps manual) auditing. Manual extraction of data is necessary where the required indicators cannot be generated automatically from electronic systems with sufficient reliability for the CQI purpose. Both approaches are valid. The approach that should be used will depend on the focus of the CQI audit, the level of detail required about client care, the resources available to carry out the audit, and the capability of the electronic information system to generate data of adequate quality. Using both electronic data extraction and sampling is often ideal, because an electronic system download can provide an overview of an entire group of service users (for example, all children without a major health anomaly aged 3 months to 15 years), while sampling provides detailed information about the quality of care delivered to clients with specific characteristics, including the way care is documented in client records.
Practical tips for generating data
There are several practical issues to consider when generating data for clinical auditing.
What is the CQI question?
The focus of the clinical audit and the CQI question will determine the data that are needed. If the question relates to the whole service population, or to a subgroup of clients who can be identified in the electronic information system, electronic data extraction may be feasible. For example, electronic data extraction may be feasible if the CQI question relates to services received by women enrolled for antenatal and postnatal care. Otherwise, sampling of client records is necessary.
The size of the service population is also a factor in decision-making. If doing an audit of adolescent care in a service with 30 adolescent clients, then an audit of all 30 records would be feasible. In contrast, sampling would be appropriate when auditing social and emotional wellbeing care for all adult clients of a large health service if the data cannot be electronically generated.
Does the electronic record system contain the data needed? AND are the data complete and reliable?
These are critical questions when deciding the most appropriate data source. The electronic information system may be able to generate data for laboratory results and clinical measurements, for example, but not data about counselling and follow-up provided to clients who are at risk for social and emotional wellbeing, or data about smoking status.
A related issue is that deficiencies in the quality of information held in client health records may not be readily evident in electronic system downloads. Manual audits, in comparison, are likely to highlight incomplete and poor documentation in client records, even when the audit is only done on a sample of records. The need to improve the accuracy and quality of data in client records is evident in many CQI studies.16
Is it possible to extract data for all the required population?
The capability of the health service information system (and the capability of health service staff to use the system) also determines whether it is possible to electronically extract data for all the required population, or whether sampling is the best approach for meeting auditing needs.
We have brought these questions together in a decision flowchart (Figure 4.1). When the electronic clinical information system contains the data needed to answer the CQI question, when the data are complete and reliable, and when it is possible to extract data for all the required population, electronic data can be extracted for analysis. When there is doubt about any of these criteria, the reliability of data for CQI is likely to be compromised. In these circumstances, drawing a sample of clients’ records and auditing each clinical record to identify relevant clients is the recommended approach.
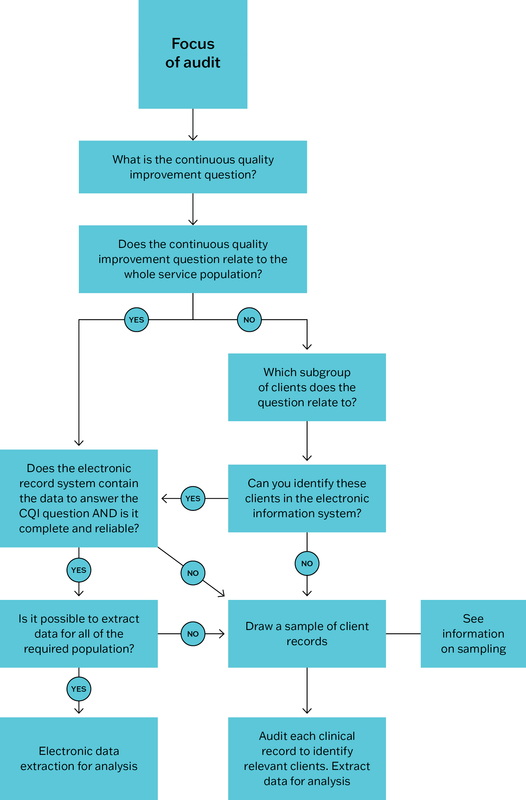
Figure 4.1 Decision flowchart: generating data for analysis in a clinical audit.
Sampling client records to generate data
A well-functioning electronic clinical information system can usually generate a sample of client records for auditing. Otherwise, a sample of client records can be drawn from a client list. Whatever method of sampling is used must result in an unbiased representation of clients. The sampling method used should also be consistent between audit cycles, so that audit results can be reliably compared over time. There are two commonly used approaches to generating a sample:
- Systematic sampling is a probability sampling method. It involves sampling members from a larger client population (for example, all children aged 3 months to 15 years), selected according to a random starting point but with a fixed, periodic interval. This interval, called the “sampling interval”, is calculated by dividing the population size by the desired sample size.
- Random sampling selects clients by chance from a complete list (for example, a list of all clients diagnosed with coronary heart disease). Each client record has an equal probability of being selected and the selection must occur in a random way.
The number of client records audited needs to be sufficient to provide a snapshot of whether processes are being followed in line with clinical practice guidelines, but not so large that the audit takes more time and resources than necessary. If a high degree of accuracy and confidence is required, a sample size that is representative of the entire client population can be calculated in a scientific way (for example, using free epidemiology and statistical software).
An additional consideration will be whether to stratify your sample. Stratification is an important concept in sampling. A stratified sample includes equal numbers of clients from each of a number of specified groups. In your random sample, you may want equal numbers of male and female clients, or equal numbers of clients in different age ranges.
The sample needs a clear timeframe and should include current or recent clients. Clearly specified inclusion and exclusion criteria are required but, when drawing a sample of client records for auditing, discussion may be needed to include or exclude individual client records. At this point, local knowledge is important. For example, you may decide not to include the record of a client you know has moved away and therefore not attended for scheduled care, or a client who has passed away.
Denominators – an important concept in clinical auditing
Denominator data are very important in clinical auditing, because they allow us to measure (quantify) the extent to which care is being delivered in line with best-practice guidelines. The denominator is the total number of clients who meet the inclusion criteria for auditing. In a diabetes care audit, for example, the denominator is the total number of adult clients with diabetes who use the health service for their diabetes care.
Denominator data allow us to measure the extent to which care is being delivered in line with best-practice guidelines.
Denominators need to be reliable to provide an accurate picture of the percentage of clients who have received the recommended standard of care, and to assess trends in care quality over time. Consistent definitions for denominators are essential for clarity about which clients are included in or excluded from an audit (for example, based on disease diagnosis, age, regular or recent attendance).
Reliable denominator data can be difficult to achieve for various reasons. These reasons include not applying client definitions consistently (for example, the definition of a “regular client”), or not having a record archiving system in place to remove the files of clients who cease attending the service or practice. Denominator data can be compromised by inconsistent use of electronic clinical information systems by staff, by data being entered incorrectly, by difficulty with using filters to extract data, by difficulty migrating client data from old to new software systems and other factors.17 It is important not only to accurately enter, manage and extract data, but also to scrutinise electronically extracted data for possible errors before using the information to prioritise improvements. The following example illustrates the need for scrutiny and the value of involving staff with local knowledge in analysing audit data.
Table 4.2 shows that at one health centre in 2023, 40 out of 42 (95 per cent) clients with diabetes had received a glycated haemoglobin (blood glucose) check within the past 6 months. This appears to be a significant improvement on 75 per cent recorded in the previous audit. But a denominator of 42 clients with diabetes in 2023, compared with 56 in 2022 and 58 in the following audit would suggest the denominator was incorrect. Staff members should be able to confirm whether an error had been made when extracting data for auditing – for example, whether they had selected a function that removed all clients without a recent blood glucose record.
|
Audit year |
Number |
Denominator |
% |
|---|---|---|---|
|
2022 |
42 |
56 |
75 |
|
2023 |
40 |
42 |
95 |
|
2024 |
46 |
58 |
79 |
Table 4.2 Clients with diabetes who received a blood glucose (HbA1c) check in the past 6 months, over three consecutive audits.
One way of overcoming the poor reliability of denominator data is to audit samples of clinical records. For example, a sample of 50 eligible client records in consecutive audits (a consistent denominator of 50) would yield more accurate data about changes in quality indicators over time. We also need to consider the size of the denominator. When denominators are low numbers, a large percentage change in indicators may have less significance for identifying priorities for improvement.
Generating information
The characteristics of PHC services that set them apart from other healthcare settings extend beyond the type of client and the need for continuity of care. They include a range of PHC service models and a strong community focus. For CQI to be effective, PHC teams need knowledge of the service population, features of the health service, the historical, cultural, social and environmental influences on the community’s health and healthcare priorities, and the resources available to improve health and wellbeing.
Various techniques can be used to record this information, such as surveys, gathering stories, and community or systems mapping techniques using various media. A range of sources might include health service data, central data repositories, data from other service agencies (for example, schools, police, local government, places of worship, charities) and from community leaders and groups. It is most important that the information is regularly updated and is available for use in CQI. It should include these types of data:
- demographic information about the community, such as population size, age and gender breakdown, ethnic and other identified population groups
- information about the health service, including governance arrangements, accreditation status if relevant, staffing including whether any regular visiting staff contribute to PHC delivery, location, outlying clinics, and number of clients (also broken down into demographic groups)
- information about other services and resources located in the community or accessible to residents
- evidence about factors affecting community and population health and wellbeing: relevant positive factors such as strong social supports and strong cultural identity, practices and values; negative measures such as recent catastrophic weather events, poor living conditions, extent of poverty, exposure to racism.
This information is considered when interpreting data and when benchmarking a service’s CQI results against other services. It helps teams to consider the factors that contribute to results, and ways to overcome or manage barriers to providing high-quality care and supporting community wellbeing. It also helps PHC teams to harness available resources to plan improvement.
Data on care coordination
Care coordination in PHC involves organising care activities and sharing information between care providers to achieve effective and safe care for clients. It may involve structural arrangements or communication and support. The effective coordination of care is important for achieving high-quality PHC and quality of life for clients (for example, by avoiding duplication of services and long wait times) but can be challenging given the fragmented and siloed care that often occurs in health systems.
It can be difficult to systematically assess the quality of care coordination, because it requires data across service providers, healthcare sites and levels of care to be accessed and compared, while adhering to confidentiality and privacy principles. Clinical information systems rarely have the required compatibility or functionality for this purpose. In addition, client and staff experiences are a valuable measure of effective care coordination and may not be reflected in these data. PHC services with dedicated care coordinators may have more complete records. Care coordinators’ knowledge of systems, patient histories, coordination protocols and lines of communication may also have a positive effect on quality of care (see also Chapter 2, “Continuity of care and quality”).18
Clinical audit tools usually include indicators relating to care coordination (for example, records of a team care plan); systems assessment tools should evaluate care coordination or continuity of care or both. Data from use of these tools can be combined to assess and set priorities for improving care coordination.
Summary
In this chapter, we have focused on the evidence commonly used in CQI, particularly for improving clinical PHC. Quality indicators, the role of best-practice guidelines and issues relating to data quality have been discussed. Key strategies for generating clinical data to measure care quality have been described. In the next chapter, we focus on practical tools that enable teams to use these data for improving clinical care and health systems.
References
Allen and Clarke Consulting (2013). Evaluation of the Northern Territory Continuous Quality Improvement Investment Strategy: final report. Canberra: Department of Health.
Bailie, J., A. Laycock, V. Matthews and R. Bailie (2016). System-level action required for wide-scale improvement in quality of primary health care: synthesis of feedback from an interactive process to promote dissemination and use of aggregated quality of care data. Frontiers in Public Health 4: 86. DOI: 10.3389/fpubh.2016.00086.
Bailie, R., J. Bailie, A. Chakraborty and K. Swift (2015). Consistency of denominator data in electronic health records in Australian primary healthcare services: enhancing data quality. Australian Journal of Primary Health 21(4): 450–9. DOI: 10.1071/PY14071.
Bailie, R., V. Matthews, J. Bailie and A. Laycock (2014). Primary health care for Aboriginal and Torres Strait Islander children: priority evidence-practice gaps and stakeholder views on barriers and strategies for improvement: final report. Brisbane: Menzies School of Health Research.
Barkhuysen, P., W. de Grauw, R. Akkermans, J. Donkers, H. Schers and M. Biermans (2014). Is the quality of data in an electronic medical record sufficient for assessing the quality of primary care? Journal of the American Medical Informatics Association: JAMIA 21(4): 692–8. DOI: 10.1136/ amiajnl-2012-001479.
D’Aprano, A., S. Silburn, V. Johnston, R. Bailie, F. Mensah, F. Oberklaid et al. (2016). Challenges in monitoring the development of young children in remote Aboriginal health services: clinical audit findings and recommendations for improving practice. Rural and Remote Health 16(3852): 1–10.
Darr, J., R. Franklin, K. McBain-Rigg, S. Larkins, Y. Roe, K. Panaretto et al. (2021). Quality management systems in Aboriginal community controlled health services: a review of the literature. BMJ Open Quality 10(3): e001091. DOI: 10.1136/bmjoq-2020-001091.
de Witt, A., F.C. Cunningham, R. Bailie, C.M. Bernardes, V. Matthews, B. Arley et al. (2017). Identification of Australian Aboriginal and Torres Strait Islander cancer patients in the primary health care setting. Frontiers in Public Health 5(199). DOI: 10.3389/fpubh.2017.00199.
Donabedian, A. (2005). Evaluating the quality of medical care. Milbank Quarterly 83(4): 691–729. DOI: 10.1111/j.1468-0009.2005.00397.x.
Donabedian, A. (2003). An introduction to quality assurance in health care. New York, NY: Oxford University Press.
Gardner, K.L., M. Dowden, S. Togni and R. Bailie (2010). Understanding uptake of continuous quality improvement in Indigenous primary health care: lessons from a multi-site case study of the Audit and Best Practice for Chronic Disease project. Implementation Science 5: 21. DOI: 10.1186/1748-5908-5-21.
Larkins, S., K. Carlisle, N. Turner, J. Taylor, K. Copley, S. Cooney et al. (2019). “At the grass roots level it’s about sitting down and talking”: exploring quality improvement through case studies with high-improving Aboriginal and Torres Strait Islander primary healthcare services. BMJ Open 9(5): e027568. DOI: 10.1136/bmjopen-2018-027568.
McCalman, J., K. Tsey, R. Bainbridge, K. Rowley, N. Percival, L. O’Donoghue et al. (2014). The characteristics, implementation and effects of Aboriginal and Torres Strait Islander health promotion tools: a systematic literature search. BMC Public Health 14: 712.
Misra, V., K. Sedig, D. Dixon and S. Sibbald (2020). Prioritizing coordination of primary health care. Canadian Family Physician 66(6): 399–403. Erratum in: Canadian Family Physician 66(8): 554.
National Aboriginal Community Controlled Health Organisation and Royal Australian College of General Practitioners (2018). National Guide to a Preventative Health Assessment for Aboriginal and Torres Strait Islander People, 3rd edn. Melbourne: RACGP.
Remote Primary Health Care Manuals, ed. (2022a). CARPA standard treatment manual for remote and rural practice. Alice Springs, NT: Flinders University.
Remote Primary Health Care Manuals (2022b). Minymaku kutju tjukurpa – women’s business manual. Alice Springs, NT: Flinders University.
Schierhout, G., J. Hains, D. Si, C. Kennedy, R. Cox, R. Kwedza et al. (2013). Evaluating the effectiveness of a multifaceted, multilevel continuous quality improvement program in primary health care: developing a realist theory of change. Implementation Science 8: 119. DOI: 10.1186/1748-5908-8-119.
Wise, M., S. Angus, E. Harris and S. Parker (2013). National appraisal of continuous quality improvement initiatives in Aboriginal and Torres Strait Islander primary health care: final report. Melbourne: Lowitja Institute.
Woods, C., K. Carlisle, S. Larkins, S.C. Thompson, K. Tsey, V. Matthews et al. (2017). Exploring systems that support good clinical care in Indigenous primary health-care services: a retrospective analysis of longitudinal systems assessment tool data from high-improving services. Frontiers in Public Health 5: 45. DOI: 10.3389/fpubh.2017.00045.
World Health Organization (2023). WHO guidelines. https://www.who.int/publications/guidelines/en/.
1 Darr, Franklin et al. 2021.
2 Donabedian 2003, 2005.
3 Donabedian 2003, 2005.
4 Donabedian 2003, 2005.
5 Examples are the WHO guidelines portal and the International Guidelines Library.
6 Remote Primary Health Care Manuals 2022a.
7 Remote Primary Health Care Manuals 2022b.
8 National Aboriginal Community Controlled Health Organisation and Royal Australian College 2024.
9 McCalman, Tsey et al. 2014.
10 Gardner, Dowden et al. 2010; Wise, Angus et al. 2013.
11 Allen and Clarke Consulting 2013; Schierhout, Hains et al. 2013; Wise, Angus et al. 2013.
12 Allen and Clarke Consulting 2013, 53.
13 Larkins, Carlisle et al. 2019; Woods, Carlisle et al. 2017.
14 Barkhuysen, de Grauw et al. 2014.
15 R. Bailie, J. Bailie et al. 2015.
16 Bailie, Laycock et al. 2016; Bailie, Matthews et al. 2014; D’Aprano, Silburn et al. 2016; de Witt, Cunningham et al. 2017.
17 R. Bailie, J.Bailie et al. 2015.
18 Misra, Sedig et al. 2020.