>meta name="googlebot" content="noindex, nofollow, noarchive" />
8
Energy from offshore wind: an overview
Abstract
Renewable energy has attracted a great deal of attention among governments, industries, academics and societies throughout the world in recent times. Offshore wind energy is a renewable energy source that has great potential in energy markets worldwide as our current knowledge of offshore engineering technology makes it ready for implementation immediately. In this chapter, offshore wind energy is compared with other renewable energy sources, and existing offshore wind energy projects throughout the world are reviewed. Current design codes of offshore wind energy are outlined and a set of criteria for the selection of appropriate sites for offshore wind energy is established for Australia. Finally, potential sites in Australia are evaluated and based on our analysis, the southern part of Western Australia (WA) is the most appropriate site for wind farms.
Introduction
Due to the world’s rising energy consumption, limited existence of fossil energy sources and dramatic changes to the world’s climate, the extension of renewable energy has drawn a great deal of attention from governments, industries and academics world-wide. Renewable energy has considerable potential and could theoretically provide a nearly unlimited supply of relatively clean and mostly local energy. Recently, global renewable energy supply has been growing strongly; the annual growth for wind energy, for example, has been around 30 per cent recently, from a very low base of 6.29 per cent of total renewable energy resources. In relative terms, however, the share of modern renewable 245energy, including large hydro-electricity, in the total primary energy supply will remain around 10 per cent by 2010 (WEC 2003). The cumulative global investment in renewable energy is expected to increase 23 per cent during 2005–2030 (Figure 8.1) (WEO 2006). As reported by World Energy Outlook (2006) fossil-fuel demand and trade flows and greenhouse gas emissions would follow their current unsustainable paths through to 2030 in the absence of new governmental action – the underlying premise of a ‘reference scenario’ (Figure 8.1). Furthermore, Figure 8.1 demonstrates, in an ‘alternative policy scenario’, that a package of policies and measures that countries around the world are considering would significantly reduce the rate of increase in demand and emissions. Importantly, the economic cost of these policies would be more than outweighed by the economic benefits that would come from using and producing energy more efficiently.

Figure 8.1 Cumulative global investment in electricity – supply infrastructure, 2005–2030 (WEO 2006).
The application of wind energy throughout the world is growing rapidly. Over the past two decades, onshore wind energy technology has been 246intensively studied and is now cost competitive with fossil and nuclear fuels for electric power generation in many areas worldwide (Owen 2003). According to World Energy Outlook (WEO 2006), the cost for onshore wind energy is around five US cents per kWh, which is competitive with nuclear power (5.5 cents per kWh) and coal stream (4.8 cents per kWh), as shown in Figure 8.2 (WEO 2006).
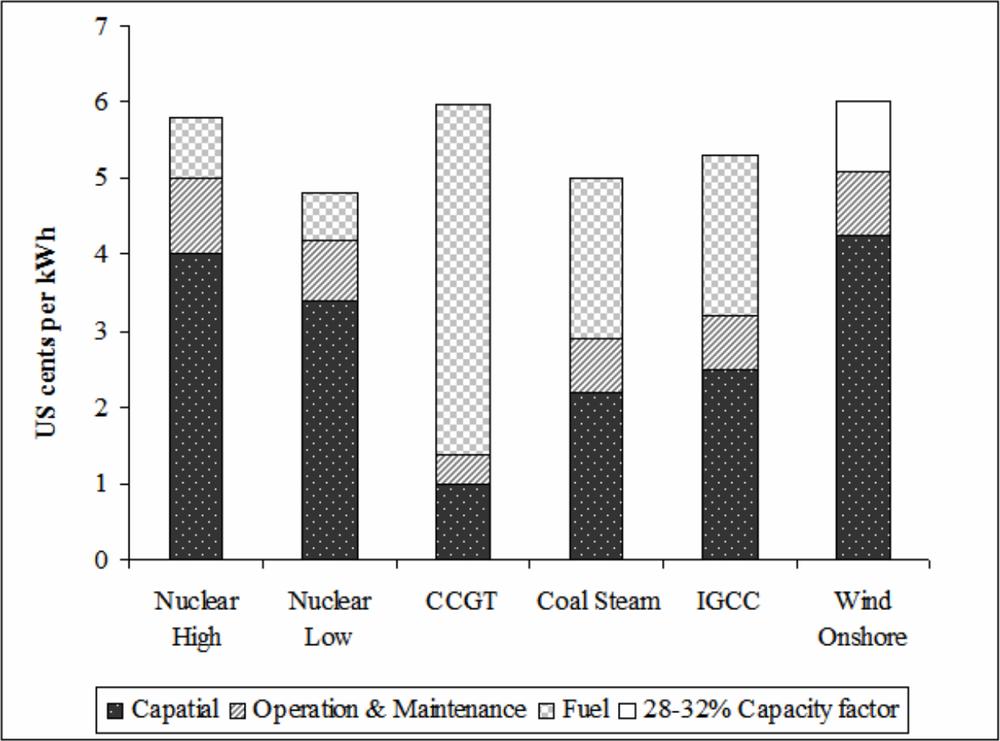
Figure 8.2 Electricity generating costs (WEO 2006)
IGCT = Integrated Gasification Combined Cycle. CCGT= combined cycle gas turbine
While onshore wind technology is maturing, offshore wind energy is in its initial stages. Offshore wind farms are different from onshore installations for several reasons. Despite the high costs compared with onshore wind farms, offshore applications allow increased energy efficiency, due to the higher average wind speeds and the reduction of the setting and environmental issues, particularly with regards to noise, 247visual constraints and space limitations, since offshore wind farms are commonly built several kilometres off the coast (Barthelmie et al 1996; Lavagnini, Sempreviva & Barthelmie 2003; Musial, Butterfield & Ram 2006).
In this chapter, we will focus on the development of offshore wind energy. Following a brief look at the nature of offshore wind energy, existing offshore wind energy projects will be reviewed. Then, design procedure of offshore wind farms will be outlined and, finally, the potential of offshore wind energy in Australia will be discussed.
Offshore Wind Energy
Renewable Energy
Energy resources removed from the ground, such as coal, gas and oil cannot be replaced in the short term, once they are used. Therefore, the development of social and economic activities will struggle once the supply of these energy resources becomes unavailable and, for this reason, renewable energy becomes an attractive energy resource to countries worldwide, especially the developed countries. The major differences between non-renewable energy and renewable energy are that the latter is less polluting and renewable.
To date, five major renewable energy resources – wind, flowing water, solar, biomass power and geothermal energy, have been widely used. The total power generation for various resources is given in Table 8.1 and a comparison of renewable energy resources is given in Table 8.2.
Cost of offshore wind energy
The cost of offshore wind energy varies widely depending on the project. However, it is reported that costs of offshore projects are significantly more than for those onshore. Most of the budget for offshore wind projects is attributed to higher costs for foundations, installation, operation and maintenance. A typical breakdown of total system costs for an offshore wind farm in shallow water is illustrated in Figure 8.3 (Owen 2003). This includes wind turbine, the onshore utility connection, the costs of operation and maintenance and 248decommissioning. As shown in the figure, the electrical and grid infrastructure, foundations and support structures, offshore construction, and operation and maintenance now represent the major fraction of the total project cost (Figure 8.3). To be successful, the offshore wind project must draw on the combined experiences and expertise of the cost-conscious wind industry, as well as the offshore oil and gas and marine industries (Musial, Butterfield & Ram 2006).
Table 8.1 Power generation of global renewable energy resources
| Type of renewable energy | Production (gigawatts) | Percentage (%) |
|---|---|---|
| Hydro power | 816 GW | 86.94 |
| Wind turbines | 59 GW | 6.29 |
| Biomass power | 44 GW | 4.69 |
| Geothermal power | 9.3 GW | 0.99 |
| Solar power | 5.5 GW | 0.59 |
Table 8.2 Comparison of various renewable energy resources
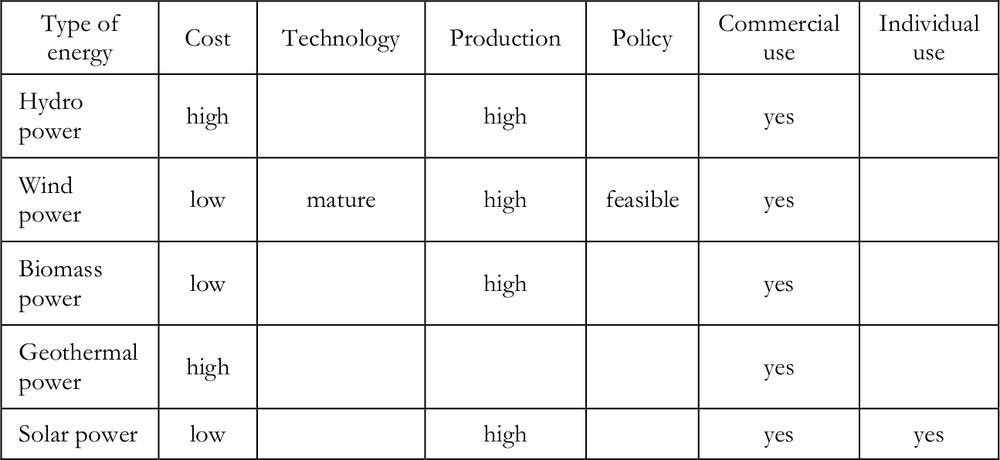
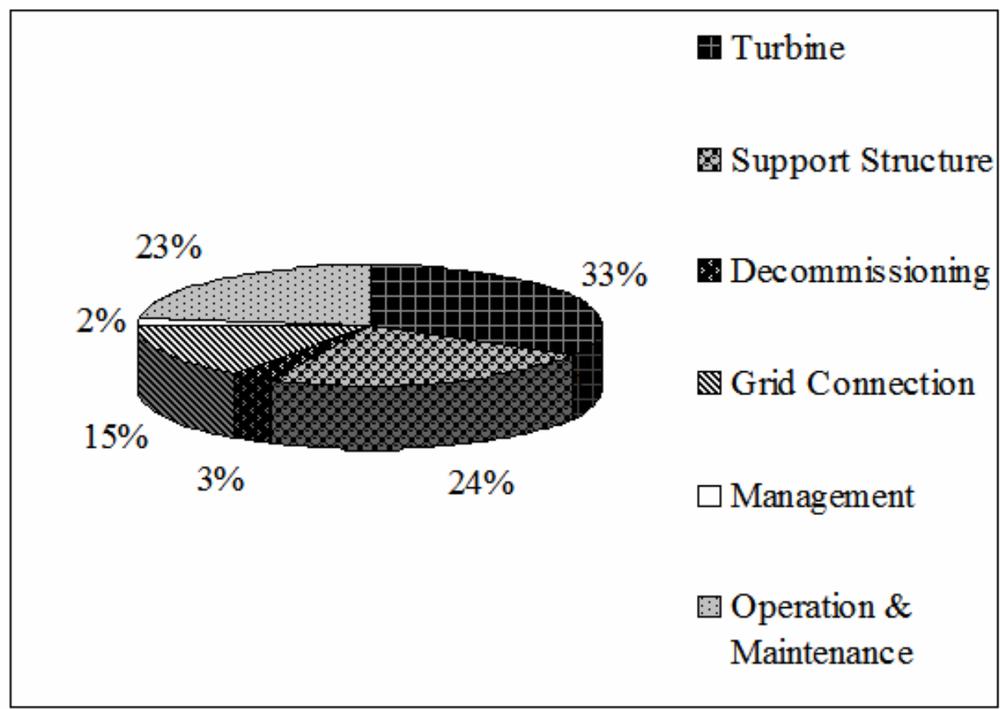
Figure 8.3 Typical cost breakdown for an offshore wind farm in shallow water (Owen 2003)
The wind energy market
Figure 8.4 shows an increasing world wind energy capacity from 1997 to 2006, and provides a prediction to 2010 (WWEA no date). The wind power capacity reached 73,904 Megawatts (MW) in 2006. In terms of economic value, it shows the strength of wind power in the world energy market.
The Global Wind Energy Council gives the total wind power capacity for countries to year 2006 (Table 8.3). Germany, Spain, the United States, India and Denmark are the top five countries that invested a large amount of capital on wind power. Germany leads the world wind energy market with 16,000 wind turbines, while the government of United States has set a target of supplying 10 per cent of total electricity by 2010. 250
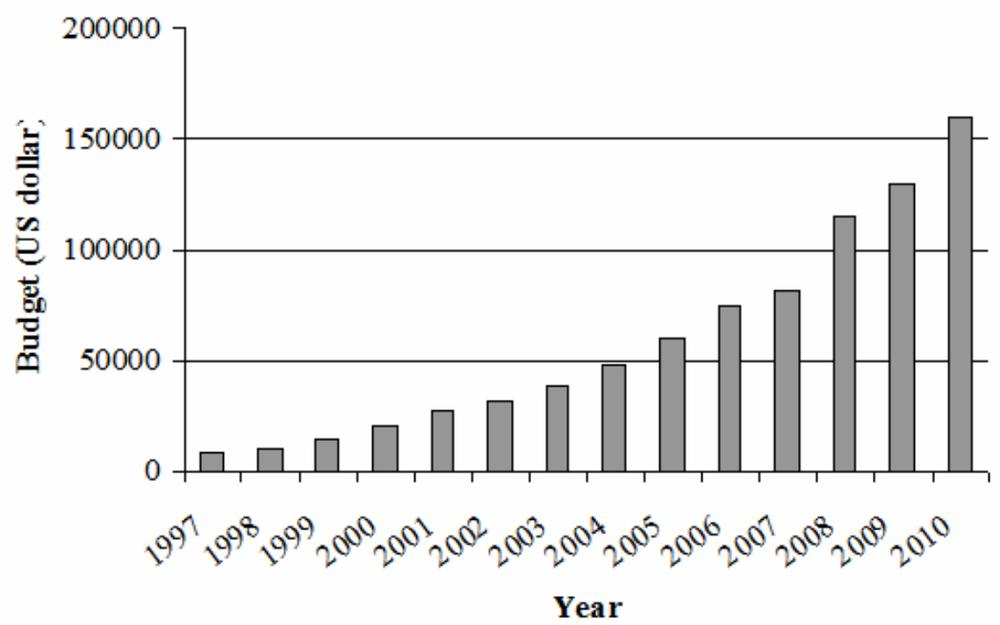
Figure 8.4 World market of wind energy
Table 8.3 Total installed wind power capacity in various countries
| Rank | Nation | 2005 (MW) | 2006 (MW) |
| 1 | Germany | 18,415 | 20,622 |
| 2 | Spain | 10,028 | 11,615 |
| 3 | United States | 9,149 | 11,603 |
| 4 | India | 4,430 | 6,270 |
| 5 | Denmark | 3,136 | 3,140 |
| 6 | China | 1,260 | 2,604 |
| 7 | Italy | 1,718 | 2,123 |
| 8 | UK | 1,332 | 1,963 |
| 9 | Portugal | 1,022 | 1,716 |
| 10 | France | 757 | 1,567 |
| World total | 59,091 MW | 74,223 MW 251 |
Environmental impact
Unlike the burning fossil fuel, wind energy does not produce carbon dioxide, mercury and other air pollutions. Furthermore, wind as a renewable energy source will provide a long-term energy supply while saving fossil fuels, which are limited. However, during the manufacture of the wind farm, large amounts of steel, concrete and other materials are needed and fossil and coal are also used to produce and transport these materials.
Another important type of pollution that has to be considered is noise pollution. Due to the mechanical motion of the turbines and transmission of electricity to the power station, noise will be a significant factor affecting the functioning of normal human life.
Offshore wind farms in the world
Comparison of onshore and offshore wind farms
Offshore wind farms are different from onshore installations for several reasons: (1) the wind turbine generators have, on average, larger diameters and rated power; (2) installation and maintenance are more expensive; (3) the submarine electrical connection to shore increases the investment costs (Pryor & Barthelmie 2001); and (4) offshore wind energy requires more advanced technology, especially in the coupling design of wind farms.
An important factor is the amount of energy production. Due to the large wind power generating capacity, energy production offshore wind farms may be significantly larger than from onshore installations. Moreover, the wind turbines used offshore are usually larger with higher production capacities than onshore facilities.
In addition, onshore wind farms block the sunshine and produce considerable noise to the annoyance of local residents, while offshore wind farms are more or less invisible. Most of the offshore sites are constructed about 10 to 20 kilometres offshore, eliminating both shadow and noise problems, and the influence upon onshore populations is minor.
252Cost is a major disadvantage of offshore wind energy generation. The cost of an offshore wind farm is considerably greater than that for one onshore. Offshore wind farms normally are installed in shallow water with maximum water depths of up to 30 metres. This requires higher costs and more advanced technologies to build the foundations and the submerged parts of the monopile. Since offshore sites are far offshore, the power has to be transmitted from the wind turbines to the power stations on land through under-sea cables, which is more expensive, especially with the higher voltage required. Another extra cost for offshore wind farms is maintenance. As offshore wind farms are in a saltwater environment, and most of the wind turbines are designed and tested on land without considering saltwater corrosion, the repair and maintenance costs are generally much greater.
Table 8.4 provides a comparison of advantages and disadvantages of onshore and offshore wind farms.
Table 8.4 Comparison of offshore and onshore wind energy
| Advantages | Disadvantages | |
| Noise and shadow problems for residents | ||
Onshore wind farm |
Costs less | |
| Lower energy production | ||
| Easy to install | ||
| Can only install limited number of small turbines | ||
| Higher energy production (up to 90% higher wind power than onshore) | Costs more on both installation and transmission | |
| Navigation effect on shipping | ||
| Saves land | ||
| Offshore wind farm | Extra cost of maintenance (e.g. saltwater corrosion) | |
| Less noise for onshore residents | ||
| Higher technical expertise required (hydrodynamic action and submerged foundation) | ||
| Large wind turbines can be installed for higher quality electricity production | ||
| Influence on marine ecology during construction 253 |
Offshore wind energy in Europe
Offshore wind energy began in shallow water off the North Sea where the abundance of sites and higher wind resources are more favourable in comparison with Europe’s land-based alternatives. The first installation was in Sweden with a single turbine in 1990. Currently, there are 21 operating projects, four projects under construction and 15 planned projects (Figure 8.5) (Offshore Wind Energy, 2006). Figure 8.5 shows the location of installed capacity as a percentage of the total capacity and by country (Musial, Butterfield & Ram 2006). The majority of the capacity is now located in Denmark and the United Kingdom (UK) (Figures 8.5 and 8.6). Most installations have been constructed in water depths less than 18 m and at a distance from shore of 1 km to 14 km. Several large-scale offshore wind energy projects are summarised below.
Arklow Bank
Arklow Bank Wind Park, which is located on the coast off Arklow in Ireland, is co-developed by Airtricity and GE Energy. It is not only the first offshore wind project in Ireland, but is also the world’s first commercial offshore wind turbine of over 3 MW. The first phase of this project was operated by seven GE 3.6 MW turbines with a 25 MW capacity. The second phase of the project is planned to install a further 193 turbines, and the total capacity will increase to 520 MW at the end of the project.
London Array
London Array is proposed as an offshore wind farm in the UK with a capacity of 1 GW, and is expected to become the world’s largest offshore wind farm. This wind park will consist of 271 wind turbines with 3100 GWh energy output amount per year and will supply over 750,000 homes when completed. When fully operational, it would make a substantial contribution to the UK Government’s renewable energy target of providing 10 per cent of the UK’s electricity by 2010. It would also prevent the emission of 1.9 million tonnes of carbon dioxide each year compared to the same amount of electricity produced by a fossil fuel power station.
254London Array turbines will range between 3 MW and 7 MW in electrical capacity, depending on when they are installed. Hub heights will be between 85 m and 100 m above sea level, and the total turbine height will not be greater than 175 m. The wind turbines will typically begin generating electricity at a minimum wind speed of 3 m/s and shut down at wind speeds greater than 25 m/s with full power at a wind velocity of 13m/s.
Three different types of foundations will be considered to support the towers. They are: steel monopile driven into the seabed directly, which is used on most of the offshore wind sites; gravity base foundation, which is a large concrete structure sitting on the seabed and stabilised by weight; and a tripod foundation, which has multi-legs pinned on several steel piles and normally used in deep water. The type of foundation used is decided after geotechnical investigations.
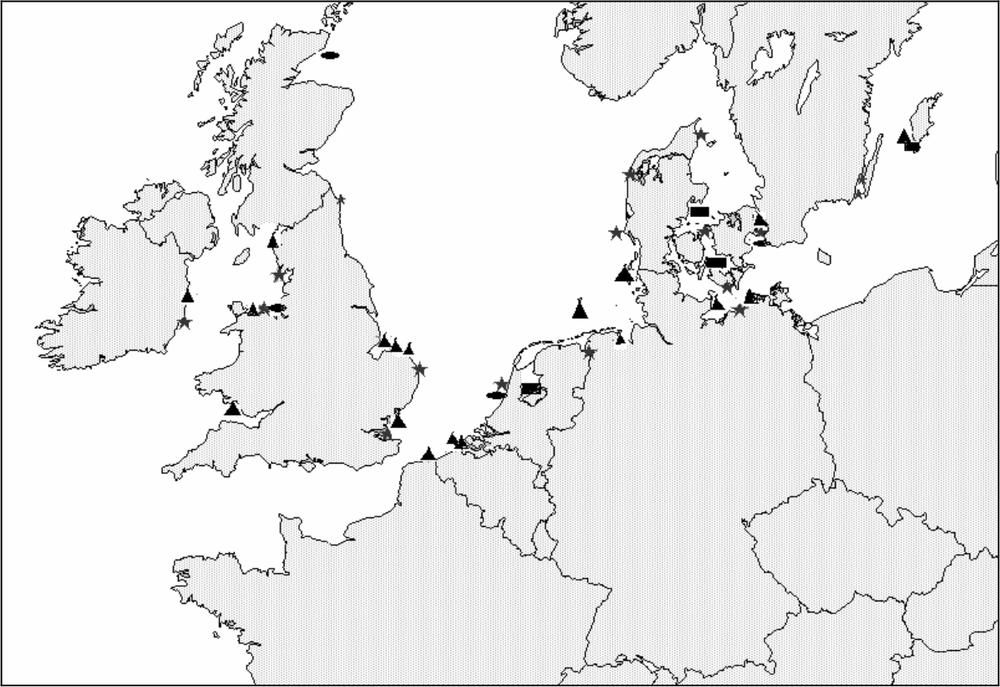
Figure 8.5 Map of existing and planned wind farms in North-West Europe. Notation: ![]() = (built large wind turbines),
= (built large wind turbines), ![]() = (built small wind turbines),
= (built small wind turbines), ![]() = (under construction),
= (under construction), ![]() = (planned). 255
= (planned). 255
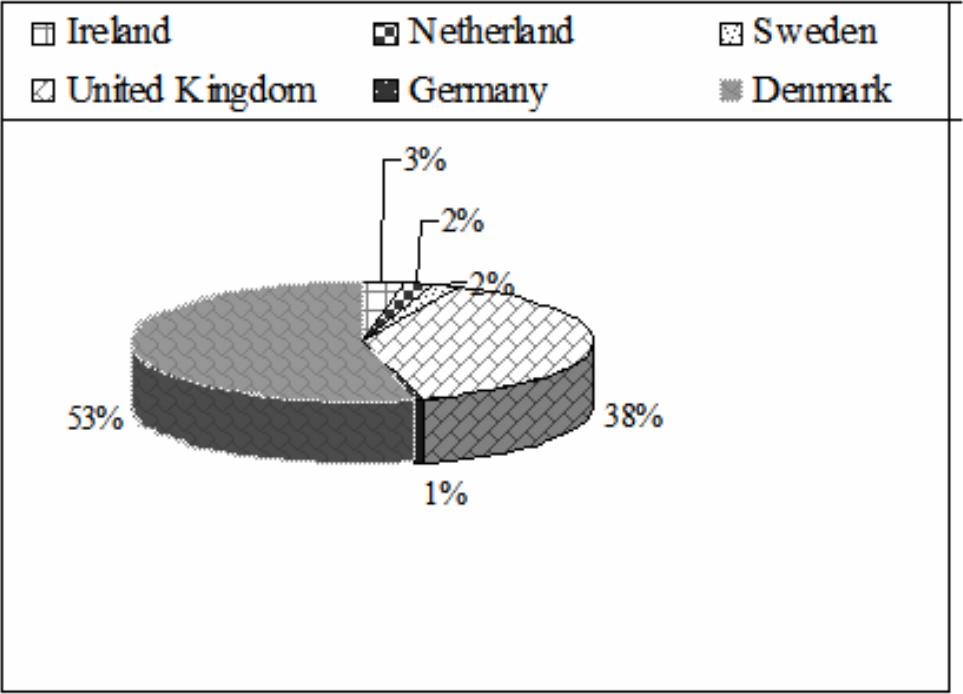
Figure 8.6 Offshore wind project installation
Kentish Flats
The Kentish Flats offshore wind farm has 30 large wind turbines from Vestas V90-3.0 installed in the UK providing a total of 90 MW rated capacity. The offshore site is located about 6 to 10 miles off East Quay in Whitstable. The wind farm was erected by the leading Danish power company Elsam, which has more than 25 years of experience with wind energy projects. The Kentish Flats project alone will reduce emissions of carbon dioxide by over 4 million tonnes over its 20-year life time.
North Hoyle
The North Hoyle offshore wind farm was built in 2003 at North Hoyle, which was the first full-scale offshore wind farm in UK. North Hoyle is 8 km offshore from north Wales. Thirty V80-2.0 MW wind turbines were installed in shallow water depths of about 12 metres, and the unit displaces about 160,000 tonnes of carbon dioxide annually. The project was constructed by Vestas and Mayflower Energy and cost £81 million over all. 256
Offshore wind energy in other countries
The potential of offshore wind energy in other regions, such as North America and Japan, are currently under investigation (Henderson, Lentz & Fujii 2002; Tap-Johansen 2006). Due to the great water depths near shore in these regions, offshore wind energy facilities will have to be constructed in deep water. In these cases, the conventional offshore wind farms (e.g. monopiles, tripods and jackets) will be adapted to floating structures, as with the Cape Wind farm in the USA.
Cape Wind
Cape Wind is the first offshore wind farm in USA, and is located in shallow water towards the centre of Nantucket Sound at Horseshoe Shoal. The proposal is for installing 130 offshore wind turbines from GE 3.6, so that Cape Wind will produce up to 420 megawatts of wind power with 3.6 MW for each wind turbine. Average expected production will be 170 MW, which will be 75 per cent of the electricity demand for Cape Cod and the Islands of Martha’s Vineyard and Nantucket. Steel monopiles are the preferred option for the wind farm foundations to support the towers. The monopiles will be driven 50–90 feet into the seabed depending on the character of the subsurface marine sediments.
A summary of the offshore wind energy projects described above is given in Table 8.5 (following page).
Design of offshore wind farms
Wind power
Wind energy is generated by moving air, so the amount of energy depends on wind speed and the density of the air. The wind power can be estimated by
| P=0.5CpρAv3. | (1) |
where P is power in watts (W), ρ is the air density in kg/m3, A is the swept rotor area, Cp is the performance coefficient of the rotor, which has a maximum value of 16/27, v is the wind speed (m/s). 257
Table 8.5 Summary of offshore wind energy projects

258As shown, wind speed can be considered in several velocity ranges:
![]() start-up wind speed – the wind speed which starts the rotor
start-up wind speed – the wind speed which starts the rotor
![]() cut-in wind speed – the wind speed referring to a specific blade-tip velocity in the case of a specific turbine, at which the wind turbine starts supplying useful output power at the shaft
cut-in wind speed – the wind speed referring to a specific blade-tip velocity in the case of a specific turbine, at which the wind turbine starts supplying useful output power at the shaft
![]() full output wind speed – the wind speed at which the machine can reach the maximum capacity
full output wind speed – the wind speed at which the machine can reach the maximum capacity
![]() furling speed (i.e. cut-out wind velocity) – the wind velocity at which the protective device fitted to a wind turbine is actuated to prevent mechanical damage to the machine
furling speed (i.e. cut-out wind velocity) – the wind velocity at which the protective device fitted to a wind turbine is actuated to prevent mechanical damage to the machine
![]() maximum design wind speed – the wind speed above which damage could occur to the machine.
maximum design wind speed – the wind speed above which damage could occur to the machine.
Types of wind turbines
Six major wind turbines have been used mostly on offshore wind farms. They are: Repower, Vestas, Multibird, Enercon, Siemens, and GE Energy. Table 8.6 outlines the technical data for the turbine prototypes with over 3 MW power rate from these six companies.
Vestas
Vestas is the world’s largest wind turbine supply company, since more than 30,000 wind turbines in over 60 countries are operating Vestas machines. Their products with capacities from V52–850 kW toV90–3.0 MW are used in both onshore and offshore wind farms. V80–2.0 MW was used on North Hoyle offshore wind farm and Horns Rev with expected annual output of 200,000,000 kWh and 600,000,000 kWh, respectively. A V90-3.0 MW unit was used on Kentish Flats with annual output of 280,000,000 kWh.
V120 is designed for large offshore projects. Carbon-fibre reinforced plastic turbine blades, which are of extremely light material, will reduce turbine weight. This will reduce foundation cost and improve the economy of offshore projects. 259
Table 8.6 Comparison of numerous wind turbines (WWEA 2006)
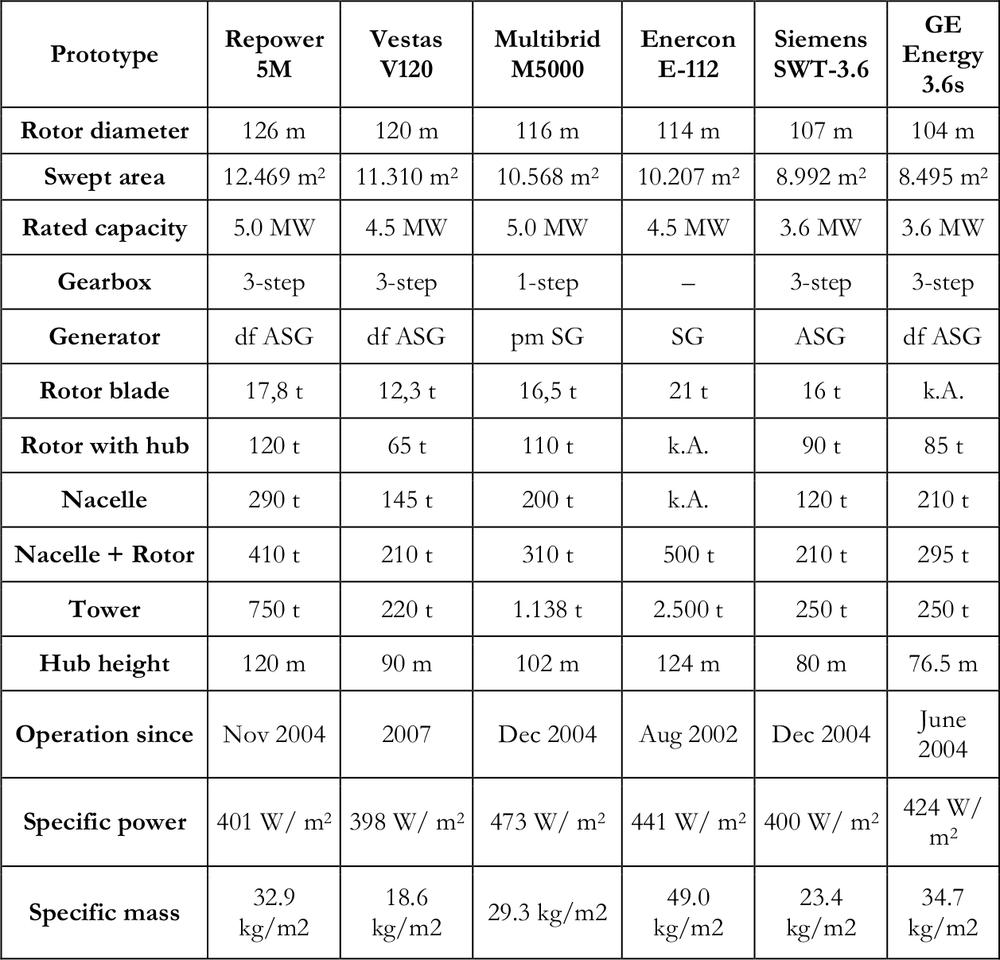
SG = synchronous generator, pm SG = permanent-magnet synchronous generator, ASG = asynchronous generator, df ASG = asynchronous generator (doubly fed)
Repower
Repower Systems AG is one of the leading turbine producers in Germany and was founded in 2001. This company focuses on the development, production and installation of multi-megawatt wind turbines with capacities from 1.5 to 5 MW and which are installed in 260water from 70 to 126 metres deep. The Repower 5M is one of the world’s largest wind turbines for offshore wind projects with a rated output of 5 MW and is designed to satisfy the conditions of the sea environment with its effective corrosion protection and permanent monitoring.
Multibrid
Multibrid M5000 is designed for offshore wind farms with simple installation requirements. Since the converter system, transformer and switch gear are already installed on the tower, only the transmission step is needed to operate the turbine. Therefore, repairs are very difficult for such a design, especially at sea. The turbine blades are made of carbon fibre to provide low weight, and it is operated with independent electrical pitch systems to reduce risk of failure in high-speed wind conditions.
Enercon
To date, Enercon is one of the world’s leading companies in wind power. In 2005, Enercon made the E-112 design with a rate of 4.5 MW and rotor diameter of 113 m, and was the largest wind turbine in the world at that time. Then at the end of 2005, the E-112 was upgraded to 6 MW. The E-112 failed in the offshore project at Wilhelmshaven when the bucket foundations, which were designed for this project, deformed. Due to considerable power of the E-112, it cannot be used in the shallow waters of Wilhelmshaven and new foundations will have to be designed for the device
Siemens
Siemens, as one of the world largest electrical engineering companies, leads the market in a wide range of business areas. Siemens produces wind turbines with a range between 1.3 MW (SW-1.3) and 3.6MW (SW-3.6). Different from other types of wind turbine, the blades from Siemens are made of fibreglass reinforced epoxy with no joints between spars and shells, so water cannot gain access, thereby reducing the risk of saltwater erosion. 261
GE Energy
GE Energy is one of the world’s leading companies for power generation and energy delivery, which includes energies from water, wind, oil and gas. Over 7500 wind turbines were installed around the world from GE Energy with a range from 1.5 to 3.6 MW. The 3.6 MW turbines are specifically designed for offshore sites, with higher wind speeds, larger rates and 104 m diameter rotor blades.
Turbine design basis
Due to the rapid development of wind energy, the size of wind turbines has increased to satisfy market requirements. Since the turbine size is becoming larger, the design concepts are also developing in relation to the number of the blades, the position of the rotor, wind speed, power of the rotor and so on.
In this section, we will discuss the turbine concept and power control system.
Turbine Concept
Hansen and Hansen (2007) state four different concepts for turbine design: fixed speed wind turbine concept (Danish concept); variable speed wind turbine concept with variable rotor resistance (Optislip concept); variable speed wind turbine concept with partial-scale frequency converter (doubly fed induction generator concepts); and variable speed concept with full-scale frequency converter (pitch concept with a synchronous generator). These four concepts are outlined below.
Among all concepts, the Danish concept is the most standard and most used. This concept can be simply explained as a turbine operating at a fixed wind speed, and with an asynchronous generator.
The doubly fed induction generator concept (partial-scale frequency converter concept) entails a pitch-controlled turbine, which means the rotor runs at varied wind speeds. This design has an asynchronous generator and a partial-scale frequency converter, which operates only within a speed range of 30% of synchronous speed. The turbine blades 262turn off during strong winds. Since a partial-scale frequency converter is used in this design, it can reach 25–30% cent of output from the fullscale power converter. This concept can only be considered because of its economic impact of its smaller converter.
The pitch concept with a synchronous generator (full-scale frequency converter) is also pitch controlled. This is different from a partial-scale frequency converter; the wind speed can be controlled from 0 to 100% of synchronous speed, but at a higher cost. The variable speed wind turbine concept with variable rotor resistance is for a turbine operated under a limited range of wind speeds, and controlled by the pitch and rotor resistance. Therefore, the rotor resistance will cause a loss of energy due to the transferring process, this design is more costly and is less efficient.
Power control system
Power control is used on all turbines to avoid the damage in high wind speeds.
Stall control is the earliest and simplest method to control power output (Hansen & Hansen 2007). When wind speed exceeds a certain limit, the rotor blades are designed to stall to protect the rotor. This design may lose some energy, but the advantage is that the design is simple without the high mechanism complexity as pitch controlled turbines.
Pitch control turbines can generate power with fast turning blades at high wind speeds. The system is highly efficient, but the mechanism is much more complex, and the machine cannot adapt well to power fluctuations at high speed winds.
Table 8.7 gives design concepts and control abilities for wind turbines over 3.0 MW from the six largest wind companies. 263
Substructure of wind farms
In general, three different sub-structures have been used to support offshore wind mills. They are: gravity based caisson foundations, monopiles, and torpid foundations.
Gravity based caisson foundations
Offshore wind mills can be supported by a concrete caisson or a steel gravity foundation. The concrete caissons are used more frequently than gravity foundations (Houlsbey & Bryne 2000). Since the increase in turbine size and tower height, the size of the concrete caissons has been increased to satisfy the design criteria. The cost of the caissons is considerably greater than the monopile structures. Steel gravity foundations are much lighter than concrete caissons, so they are easier to transport and install. However, the cost of producing these enormous steel foundations is considerable.
Table 8.7 Design concept and power control system used by six offshore wind energy companies
| Manufacturer | wind turbine | Concept | Power Control |
| Vestas | V120-4.5MW | Doubly fed induction generator concept | Pitch controlled |
| Repower | 5 MW | Doubly fed induction generator concept | Pitch controlled |
| Multibrid | M 5000 | Pitch concept with synchronous generator | Pitch controlled |
| Enercon | E112-4.5MW | Pitch concept with synchronous generator | Pitch controlled |
| Siemens | 3.6 MW | Pitch concept with synchronous generator | Pitch controlled |
| GE Energy | GE3.6 MW | Doubly fed induction generator concept | Pitch controlled |
Monopile foundations
Monopiles are used on most offshore projects. At present monopiles can reach up to 4.5 m in diameter. This type of foundation is suitable for 264most seabed conditions and requires a smaller area. Zaaijer (2002) compared the three foundation models, namely monopile, torpid and gravity based. He found the monopile has the longest lifetime, but the torpid and gravity based structures have considerably more lateral strength. The disadvantages of monopile foundations are that it requires more time and cost to construct and position them compared with gravity foundations, and they can only be used in shallow water of less than 30 metres deep.
Torpid foundation
The torpid foundation is designed for deep water. This structure is pinned by three- or four-legged steel jackets to small diameter steel piles or caissons. This design has a big future in the development of offshore wind farms.
Floating offshore wind farms, which can be installed in deep water, are another option for the future. However, the main disadvantage of this concept is the cost (Hansen & Hansen 2007), which could be double that of seabed-mounted structures. A possibility to reduce cost is to install the floating turbines on offshore rigs in oil or gas fields to run instead of using gas.
Analysis of offshore wind farms
In this section, we will outline a simplified model for an offshore wind farm using the monopile foundation concept. Figure 8.7 illustrates various loadings on a monopile, including wind, hydrodynamic and soil loadings.
Hydrodynamic loading
Hydrodynamic loading on an offshore monopile consists of two components: static and dynamic loading. The static water pressure varies only with one parameter, which is the water depth. It is easily expressed by Pascal’s Law:
| p = ρgz, | (2) |
265where ρ is the density of the fluid; g is the acceleration due to the gravity (9.8 m/s2) and z is the water depth at some specific point in metres.
Dynamic wave loading on an offshore monopile
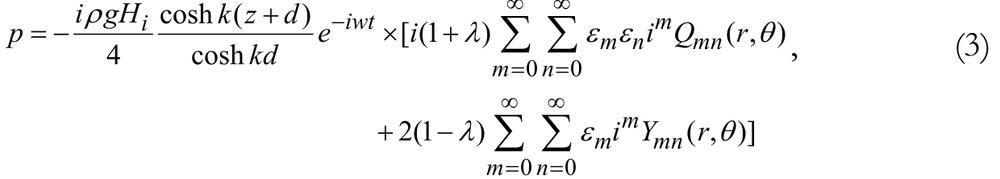
where Qmn and Ym are Bessel function for the first-order velocity potential, which are available in Zhu (1993); Hi is incident wave amplitude; d is water depth; λ is reflection coefficient; k is wave number; θ is angle around cross-section of the cylinder; εm and εn are coefficients.
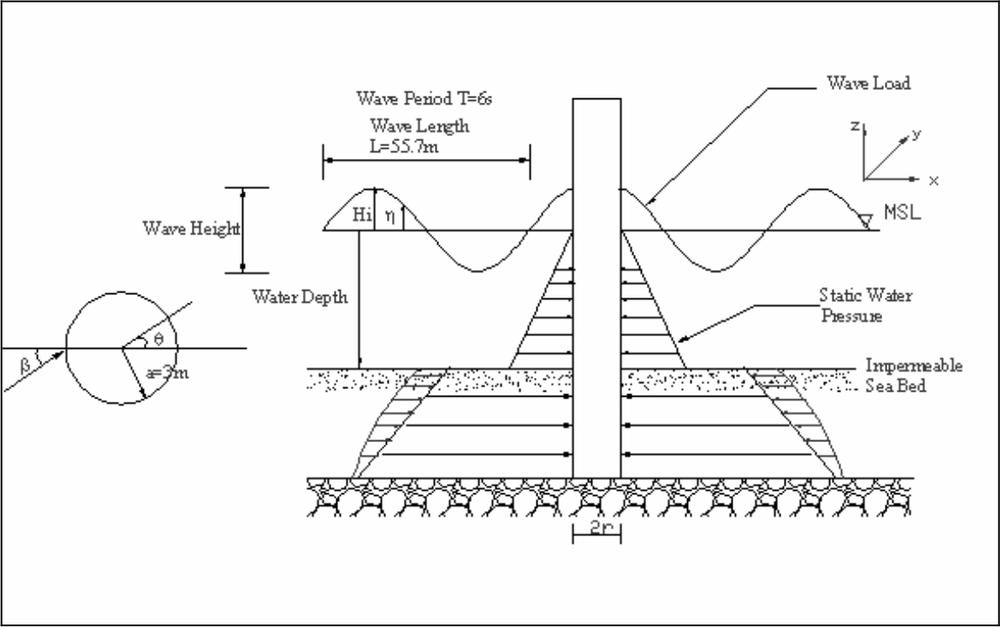
Figure 8.7 Sketch of loading on offshore mono-pile 266
Lateral earth pressure within a seabed
The soil at the foundation part of the pile gives a lateral pressure on the concrete cylinder. In the current study, only the static soil pressure is considered, which is obtained by using the equation of the soil weight pressure:
| ps = γsh, | (4) |
where ps is the pressure due to soil weight; γs is the unit weight of soil; h is the distance from the soil surface to a specific point in soil layers in metres.
Wind loading
The wind velocity on the top layer of the monopile can be affected by considering both the inverse of the annual probability of exceedance (R) and the height (z). The function of wind velocity for the structure with a height between 10 m and 100 m can be determined by (AS/NZS 1170.2:2002)
| V(z)1170.2 = VRMd (Mz,ca (Z) MsMt), | (5) |
where Md is wind direction multiplier; Ms is shielding multiplier; Mt is topographic multiplier; Mz, cat (z) is height multiplier as a function of height (z)
| Mz,cat = 0.15 ln z + 0.0003z + 0.67, | (6) |
where z is the reference height of the structure above the average local ground level in metres;
In (5), VR is regional 3 second gust wind speed in m/s at 10m height
| VR = 67−41R−0.1, | (7) |
where R is the inverse of the annual probability of exceedance of the wind speed.
267The wind pressure (p) in Pascal, can be followed by the code AS/NZS1170.2:2002, as a function of height (z):
| p(z) = (0.5ρair)[V(z)]2CfigCdyn, | (8) |
where ρair is density of air, taken as 1.2 kg/m3; Cdyn is dynamic response factor, taken as 1.0; and Cfig is aerodynamic shape factor defined by
| Cfig = Cp.b (θb) = kbCp1(θb), | (9) |
where θb is the angle from the wind direction to a point on the wall of the monopile, in degrees, kb is factor for a circular cylinder, given as:
| kb = 1.0 for Cp1 ≥ −0.15 | ||
| kb = 1.0−0.55(Cp1(θb) + 0.15) log10 (c/b) for Cpl < −0.15; | (10) | |
in which c/b is unit aspect ratio in a range 0.25 to 4.0; and Cp1 (θb) is external pressure coefficients as a function of angle θb.
Overturning force from wind turbine
The overturning force due to the wind turbine is expressed as
| T = 0.5CTρairπR2U2, | (11) |
where CT is thrust coefficient, taken as 8/9 for ideal case, ρair is the density of air, taken as 1.2 kg/m3, R is the radii of wind turbine, and U is free stream velocity. 268
Potential of offshore wind energy in Australia
Assessment of offshore wind farms sites
We have established a set of selection criteria to assess possible sites for offshore wind energy generation in Australia, (Tables 8.8–8.16). Based on existing offshore wind energy projects in Europe, the major criteria for the selection of sites for offshore wind farms are summarised below:
Water depth and distance to shoreline
Water depth and distance to shoreline are two extremely important criteria for the selection of offshore wind farms. All current offshore wind turbines are installed in shallow water with monopiles and gravity foundations. Current trends indicate that offshore wind turbines will become much larger even than the present largest structures (e.g. in the Irish Sea). It is well known that wind speed increases markedly with distance from shore with less visual impact and less competing use of the seabed. These criteria will gradually attract developers into deep water, that is substructures will change from current monopiles and gravity foundations in shallow water to floating structures in deep water. However, the costs of offshore wind farms will increase as water depth increases (Figure 8.8) (Dolan 2004).
Wind Speed
Wind Speed is another dominant criterion for the selection of sites, as it is the main resource for offshore wind energy. A comparison of potential power production at onshore and offshore sites was reported by Pryor and Barthelmie (2001). In their study, four sites in the Danish wind monitoring network were selected for case studies. Their observation indicated that offshore wind speed at Rødsand, located 9 km from the closest coastline, reached 17 m/sec. Their research also pointed out that the average power production in the offshore site (Rødsand) was a constant 900 kW/hour, which is double the peak value of the onshore site at Tystofte (Pryor & Barthelmie 2001). 269
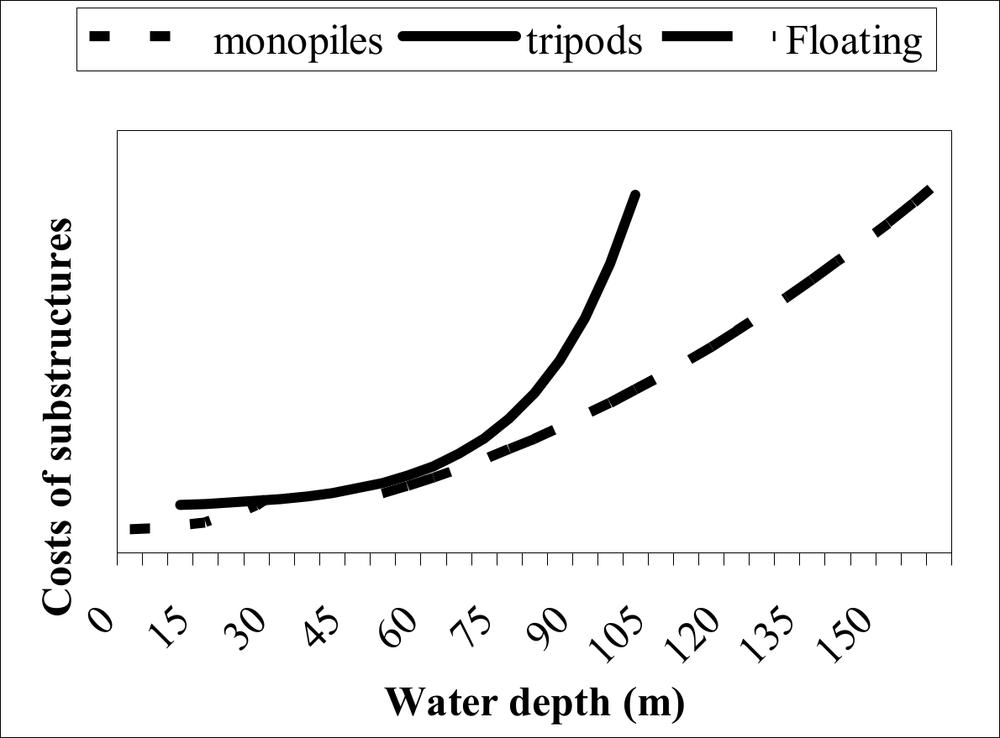
Figure 8.8 Cost of offshore wind turbine substructures with water depth (adapted from Dolan (2004))
Environmental and Biological aspects
The biological and environmental state of the proposed site needs to be thoroughly investigated as minor disturbances to the ecology may cause devastating effects. If there is not a full assessment and appropriate planning, environmental groups in Australia and the population living close to the proposed site would become extremely active. The surrounding environment should be assessed for possible parks, reserves and heritage protected areas and all levels of local, state and federal protected areas need be consulted.
Leisure
The level of boating and recreational activities may lead to complications for the construction of offshore wind farms. If the selected area has 270active boating and recreational use, public disapproval would result. Due to these difficulties, leisure is included as part of the criteria in selecting sites for offshore wind farming.
Land use (effects on population)
Types of land use on the adjacent coastline is important. If there is a large concentration of people, building a wind farm may obstruct water views, which would be extremely undesirable. Problems during and after construction can affect the local population, including job creation and social aspects.
Proposed development of sites
The size of the proposed development areas will affect the position of the offshore wind farms, as will the size and number of wind turbines. This will also affect operation and maintenance costs.
The aforementioned aspects are included in the general selection criteria listed in Table 8.8, and details of each item are listed in Tables 8.10–8.16. Note that the small number of selection criteria is favourable for offshore wind energy.
Table 8.8 General selection criteria
| Locations | |
| Distance to shoreline (km) | <3 |
| 4–9 | |
| 10–15 | |
| >15 | |
| Land use | Industrial |
| Settlement | |
| Rural | |
| Proposed area development | Large |
| Moderate | |
| Small 271 | |
| Water depth (m) | <1 |
| 2–5 | |
| 6–5 | |
| 6–9 | |
| 10–30 | |
| >30 | |
| Leisure | Major |
| Moderate | |
| Minor | |
| Environmental | Heritage area |
| Parks and reserves | |
| Shipping | |
| Biological | Birds |
| Fish school | |
| Mammals | |
| Wind speed (m/s) | <4 |
| 5–10 | |
| 11–15 | |
| 16–25 | |
| >25 | |
| Total score | |
| Rank (1, 2, 3 etc.) | |
| Overall sensitivity (pref, med, high) 272 | |
Table 8.9 Scoring for distance to shoreline
| Factor | Score | Description |
| <3 km | 3 | Too close to the shoreline |
| 4–9 km | 2 | Close to the shoreline |
| 10–15 km | 1 | Not close to the shoreline |
| >15 km | 0.5 | Far away from the shoreline |
Table 8.10 Scoring for water depths
| Factor | Score | Description |
| <1 m | 3 | Extremely large visual impact |
| 2–5 m | 2 | Large visual impact |
| 6–5 m | 1 | Moderate visual impact |
| 6–9 m | 0.5 | Small visual impact |
| 10–30 m | -1 | Minor visual impact |
| >30 m | -2 | No visual impact |
Table 8.11 Scoring for land use factor
| Factor | Score | Description |
| Industrial | 0 | Absent |
| 1 | Small scale factories & fishery activities | |
| 2 | Medium to moderate scaled factories & shipping activities | |
| 3 | International shipping activities & large scaled factories | |
| Settlement | 0 | Absent |
| 1 | Country town | |
| 2 | Township | |
| 3 | Metropolitan | |
| Rural | 0 | Absent |
| 1 | Scarcely populated | |
| 2 | Small to moderately populated | |
| 3 | Large populated 273 |
Table 8.12 scoring for proposed development area
| Factor | Score | Description |
| Small | 1 | < 20 turbines |
| Moderate | 2 | < 150 turbines |
| Large | 3 | >200 turbines |
Table 8.13 Scoring for leisure factor
| Factor | Score | Description |
| Major | 3 | Tourist destination, ferry & boating activities (>5000 hrs per yr) |
| Moderate | 2 | Leisure boating activities (< 5000 hrs per year) |
| Minor | 1 | Occasional boating activities (<500 hrs per year) |
| None | -2 | Absent |
Table 8.14 Scoring for environmental factor
| Factor | Score | Description |
| Heritage Area | 3 | Federal protection area |
| 2 | State protection area | |
| 1 | Local protection area | |
| -2 | Absent | |
| Parks | 3 | National reserves |
| 2 | State reserves | |
| 1 | Local reserves | |
| -2 | Absent | |
| Shipping | 3 | High intensity (7500–20000 hrs per annual) |
| 2 | Moderate intensity (2500–7500 hrs per annual) | |
| 1 | Low intensity (1 – 2500 hrs per annual) | |
| -2 | Absent 274 |
Table 8.15 Scoring for wind speed factor
| Factor | Score | Description |
| Wind speed | 3 | <4 m/sec |
| 2 | 5–10 m/sec | |
| 1 | 11–15 m/sec | |
| 0 | 16–25 m/sec | |
| -2 | >25 m/sec |
Table 8.16 Scoring for biological factor
| Factor | Score | Description |
| Birds | 3 | Internationally designed migrating & protected area |
| 2 | Nationally designed migrating & protected area | |
| -2 | Absent | |
| Fish schools | 3 | Spawning beneath sediment & benthic & demurral species |
| 2 | Spawning beneath water & pelagic species | |
| -2 | Absent | |
| Mammals | 3 | Protected species |
| 2 | Native species | |
| -1 | Unprotected species | |
| -2 | Absent |
Evaluation of potential sites for offshore wind energy in Australia
Based on the selection criteria proposed in the last section, we chose five sites around Australia for evaluation: (1) southern part of Western Australia, (2) Darwin, (3) Adelaide, (4) Sydney and (5) Whitsunday Islands, Queensland (Figure 8.9). The ranking scores for all sites are given in Table 8.17. As mentioned previously, the smaller number of selection criteria favour offshore wind energy over other renewable energy sources. As shown in Table 8.17, the southern part of WA is the preferred site for offshore wind energy in Australia (Figure 8.9). 725
Table 8.17 Ranking for selected sites
| Location | SWA | W | D | S | A |
| Distance to shoreline | 2 | 3 | 1 | 1 | 0.5 |
| Land use | |||||
| Industrial | -1 | 2 | 2 | ||
| Settlement | 1 | 2 | 2 | 3 | 3 |
| Rural | 0 | 2 | 0 | ||
| Proposed area development | 3 | 1 | 2 | 2 | 1 |
| Water depth | 0.5 | 2 | -1 | 0.5 | 0.5 |
| Leisure | 1 | -2 | 2 | 3 | 3 |
| Environmental | |||||
| Heritage area | 3 | 3 | 1 | -2 | -2 |
| Parks and reserves | 2 | 2 | 2 | -2 | -2 |
| Shipping | -1 | 3 | 2 | 3 | 3 |
| Biological | |||||
| Birds | -2 | 1 | 0 | -2 | -2 |
| Fish schools | -2 | 3 | 3 | 2 | 2 |
| Mammals | 2 | 3 | 2 | 2 | 3 |
| Wind speed | -2 | -2 | -2 | 3 | 3 |
| Total score | 6.5 | 21 | 14 | 15.5 | 15 |
| Rank | 1 | 5 | 2 | 4 | 3 |
Notes: WA = Southern part of WA; W = Whitsunday island; D = Darwin; S = Sydney; A = Adelaide
Regions off Queensland are not chosen due to the large protected world heritage areas, such as the Great Barrier Reef. The northern tip of Queensland and Northern Territory are not included in the list due to frequent cyclonic activity throughout the year, but especially during summer periods. The shorelines of New South Wales and Victoria are not favourable due to the high concentration of population which makes offshore wind farms unwelcome. Tasmania is a good location for 276offshore wind farms; however, it would attract excessive initial capital and operation and maintenance costs. This narrows potential areas down to regions of Southern Australia and the southern parts of Western Australia (Figure 8.9). The advantages of these two regions are the consistent wind supply and large areas of shallow water.
The above assessment is based on the assumption that offshore wind farms will be constructed in Australia as monopiles in shallow water. Perhaps this is the first option for energy companies in Australia at present. However, floating offshore wind farms in deep water will be another option for the development of offshore wind energy in Australia in the future.
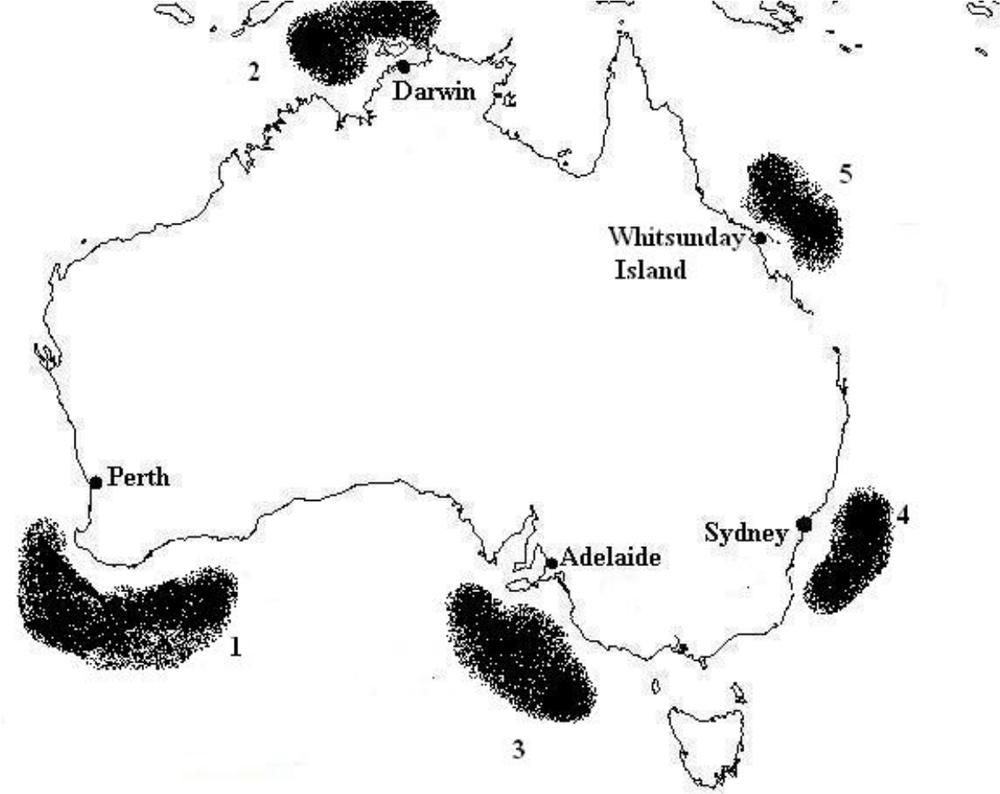
Figure 8.9 Potential site of offshore wind energy in Australia 277
Conclusions
An overview of offshore wind energy was provided in this chapter. Based on the numerical examples and discussions, it can be concluded that, compared with other renewable energy resources, offshore wind energy has great potential in the future – even if it has some shortcomings and limitations.
A set of selection criteria for an appropriate site of offshore wind energy has been established. Based on these criteria, the southern part of Western Australia is suggested as having the most potential for generation of offshore wind energy in Australia.
Acknowledgement
The authors are grateful for support from a University of Sydney Sustainable Energy Research Grant (2007–2009). 278
References
Barthelmie R J, Courtney M S, Højstrup J & Larsen S E, 1996. ‘Meteorological aspects of offshore wind energy: observations from the vindey wind farm’, Journal of Wind Engineering and Industrial Aerodynamics, vol. 62, pp. 191–211.
Dolan D, 2004. Deepwater fixed bottom wind turbine platforms, Deepwater Wind Energy Workshop, Washington DC http://www.energytics.com/deepwater.html.
Hansen A D & Hansen L H, 2007. ‘Wind turbine concept market penetration over 10 years (1995–2004)’, Wind Energy; vol. 10, pp. 81–97.
Henderson A R, Leutz R & Fujii T, 2002. ‘Potential for floating offshore wind energy in Japanese waters’, Proceedings of the 12th International Offshore and Polar Engineering Conference (ISOPE2002), Kitakyushu, Japan, pp. 505–512.
Houlsby G T & Byrne B W, 2000. ‘Suction caisson foundations for offshore wind turbines and anemometer masts’ Wind Engineering, vol. 24, no. 4, pp. 249–255.
Lavagnini A, Sempreviva A M & Barthelmie R J, 2003. ‘Estimating wind energy potential offshore in Mediterranean areas’, Wind Energy, vol. 6, pp. 23–34.
Musial W,2006) Energy from offshore wind, Offshore Technology Conference (OTC2006), Houston, USA, OTC18355.
Offshore Wind Energy, http://www.offshorewindenergy.org/ last accessed November 1, 2006
Owen A D, 2003. ‘Renewable energy: externally costs as market barriers’, Energy Policy, vol. 34, pp. 632–642.
Pryor S C & Barthelmie R J, 2001. ‘Comparison of potential power production at on- and offshore sites’, Wind Energy, vol. 4, pp. 173–181.
Tap-Johansen N J, Sempreviva A M & Barthelmie R J, 2006. ‘Application of design standards to the design of offshore wind turbines in the US’, Offshore technology Conference, Houston, USA (2006), OTC18357.
World Energy Council (WEC), 2003. Renewable energy targets http://www.worldenergy.org. 279
World Energy Outlook, WEO2006. http://www.worldenergyoutlook.org/.
World Wind Energy Association, http://www.world-wind-energy.info/
Zaaijer M B, 2002. Foundation models for the dynamic response of offshore wind turbines. Marine Renewable Energy Conference, Newcastle, UK.
Zhu S P, 1993. ‘Diffraction of short-crested waves around a circular cylinder’, Ocean Engineering, vol. 20, no. 4, pp. 389–407.