>meta name="googlebot" content="noindex, nofollow, noarchive" />
7
A short geological and environmental history of the Sydney estuary, Australia
Abstract
Sydney is blessed with one of the most beautiful harbours in the world. However, like many large, capital ports world-wide, this environment has been exposed to relentless stress due to a rapidly increasing population density and extensive residential, commercial and industrial expansion. In this chapter, we explain why the coastal zone is such an important environment, especially for the people of Australia, and describe changes to the Sydney estuary as an example of environmental transformation due to anthropogenic pressure. The geologic development of the Sydney estuary is briefly traced, showing how the feature was eroded into the Hawkesbury Sandstone, mainly during low sea levels of the glacial periods. The estuary and its catchment changed soon after Captain Philip landed in Sydney Cove. Early land clearing increased sedimentation in the waterway and rapid industrial growth, located mainly on the waterfront, resulted in increasing contamination of the estuary. At the University of Sydney, a novel collaboration between urban geographers working on changes in historical cadastral records of the city and environmental chemists studying estuarine sediments, have shown that as urbanisation and industrialisation spread through the catchment, so did the level and spatial extent of contamination in the estuary. The area of the estuary has been reduced by 22 per cent over 220 years of almost constant reclamation, resulting in ecological modification and possible additional contamination. The present contaminant status of the waterway is described in the concluding part 215of the chapter and a plea is made for a new effort for remediation and restoration of this iconic environment.
Introduction
Much of the character, and indeed the beauty, of Sydney can be attributed to its estuaries. Four deeply-incised, flooded valleys dissect the raised coastal margin of the region producing one of the longest coastlines of any capital city in the world. These beautiful waterways have ‘injected’ a maritime character deep into the heartland of suburban Sydney and have provided an extensive shoreline along which many beautiful historic homesteads have been built. These attributes have been vital in the development of Sydney into one of the most beautiful cities in the world.
These waterways have also provided excellent harbours for international trade and thus the city is at the intersection of domestic and international transport. Because of its locality, Sydney has attracted people and industry from many far off lands. The population of Sydney has grown rapidly since the Second World War and now exceeds four million – almost one quarter of the total population of Australia. The waterways have provided easy access for raw materials and export of produce and have supplied coolant for machinery, but they have also acted as a convenient receptacle for waste. All sewage and industrial waste was discharged directly into the estuaries until 1898 when three major coastal outfalls were constructed to disgorge effluent directly into the surf zone offshore from Sydney. Only in 1972 was discharge into the estuaries controlled by the Clean Waterways Act and, since 1990, sewage has been dispersed into the sea about four kilometres from the coast in approximately 80 metres of water (Birch 2000).
Australian population
Australia is a vast island continent with an area of almost 6 million km2 and a population of just 21 million. This extremely low average population density is deceptive as vast areas of internal desert and bushland are virtually uninhabited and over 85 per cent of the population live in the coastal zone (Zann 1996). Moreover, Australia is one of the most urbanised countries in the world with 67 per cent of the 216national population living in one of the eight state and territory capital cities, all of which, except for Canberra, are located on the coast (Phillips, et al 1992). Even the ‘coastal zone’, which is defined as a section of land three kilometres wide running parallel to the coastline, has an extremely uneven population distribution: 82 per cent of the coastal fringe population live in just 1170 km, or 3.9 per cent, of coastline with 72 per cent of coast having zero population (McDonald et al 1993).
Australian estuaries
Coastal ecosystems support a variety of vital biological, economic and cultural functions; however, these systems are under considerable and increasing stress due to rapid urban and industrial development. Estuaries, in particular, are being threatened from increasing human intervention due to changes in water circulation, sedimentation, habitat loss, decline in native species and contamination by heavy metals, organochlorine compounds and polycyclic aromatic hydrocarbons. Environmental degradation appears to be an inevitable consequence of urbanisation and industrialisation.
Port Jackson
The waterway has a complicated geological and human history and even the naming of the estuary is difficult. Roy (1981) includes Middle Harbour, Port Jackson, and the Lane Cove and Parramatta Rivers in the definition of ‘Sydney Harbour’, whereas others confine the meaning to the central harbour area, including Circular Quay, Darling Harbour and White, Rozelle and Blackwattle Bays (McLoughlin 2000). ‘Sydney estuary’ will be used in the present text to include all of the above locations, including Duck River, and tributaries up to the fresh water limit and to the weirs on the Duck and Parramatta Rivers.
Port Jackson is one of 80 recognised harbours and 970 estuaries on the Australian seaboard (NLWA 2002). The estuary is approximately 30 km long, 2 km wide and occupies about 50 km2, whereas the total catchment is about ten times the surface area of the estuary (500 km2). Eighty-six per cent of the Port Jackson catchment is urbanised and/or industrialised. Sensitivity to environmental harm is given by the 217relationship between the area of the estuary and that of the catchment. The Sydney estuary should have a low sensitivity to anthropogenic effect, however that is overwhelmed by the huge proportion of the catchment that is urbanised (86%), as will be seen in the following discourse.
The central east coast of Australia is micro-tidal and Port Jackson experiences a maximum 2.1 metre tidal range. Flushing times increase from three to seven days in the lower harbour to seven to ten days in the upper estuary. With such a small catchment, only a small quantity of fresh water enters the estuary under normal conditions and Port Jackson is almost completely saline. However, during heavy rainfall, large volumes of fresh water are delivered to the estuary quickly due to the short length of rivers. At these times, water in the harbour becomes stratified with a one to two metre thick layer of turbid, buoyant, fresh water at the surface and salty water below. These conditions for lowand high-rainfall periods are unusual for estuaries, which are typically more mixed with fresh and saline water.
Geological history
Permo-Triassic era
Port Jackson is located in the Sydney Basin which is Permian to Triassic age (300–220 million years). The most distinctive feature of the Port Jackson catchment is the beautiful outcrops of Hawkesbury Sandstone into which the estuary is dissected. Most of the high land in the outer catchment is comprised of Ashfield Shale which overlies the Hawkesbury Sandstone. The configuration of Port Jackson drainage system, the orientation of bays and shoreline are all controlled by underlying geological structures.
The Sydney estuary is a drowned river valley, which is eroded up to 85 metres into the Hawkesbury Sandstone. However, the origin and evolution of such a large river valley compared to its small catchment area has always been difficult to explain. Possibly the Parramatta River was once considerably larger than it is today and extended westwards to be connected to the Nepean River. Perhaps the Nepean River was later 218‘captured’ by the Hawkesbury River leaving the Parramatta River considerably reduced in size (Liu 1989). This history may explain the unusually deep erosion associated with what is currently a small catchment.
The ancient river, which is now Port Jackson, was an old, mature river that meandered across a flat plain 80 million years ago. During periods of uplift, the river eroded down into the elevated coastal plain forming steep-sided banks and at times cut through some of the meanders. During interglacial periods, sea level rises and the ‘river’ is flooded, leaving the breached meanders as islands, of which there are 14 under present sea level conditions. The great depth to bedrock in Port Jackson is attributed to the incision by the rejuvenated paleo-Port Jackson stream associated with uplift during and related to sea floor spreading when the Australian plate moved away from the Lord Howe Rise Plate (Liu 1989). Sediment, which accumulated in the valley bed during high sea level stands, was repeatedly eroded and flushed from the floor of Port Jackson valley during sea level lows. The present-day absence of sediment in depression in the Port Jackson channel is maintained by high water velocities and scouring by turbulent currents moving around headlands protruding into the estuary.
Quaternary period
Oscillations of sea level from 5 m above to 120 m below the present day position occurred every 100,000 to 150,000 years during the Quaternary due to global climate change and by glaciation. The penultimate glaciation ended about 135,000 years ago with the succeeding interglacial extending to about 80,000 years before the present. Sediments which accumulated in estuaries in this region during interglacials were eroded during intervening glacial periods. However, for the majority of the last 135,000 years, sea level was 20 to 70 m below the present and therefore erosion of estuaries was more pronounced than deposition during this period (Roy 1998). 219
Holocene epoch
The world started to come out of the grip of the last glacial period about 17,000 years ago and sea level started to rise quickly (Thom & Roy 1985). At this time the coast was about 25 to 30 km east of its present position, but, with a slope of considerably less than one degree, small increases in sea level advanced the coastline thousands of metres. By 10,000 years before the present, sea level had risen to 25 metres below today’s sea level and only 3–5 km off the present coastline. The sea reached its present position about 6000 years ago (Roy et al 1997).
Since the Australian Aborigines have inhabited the continent for more than 40,000 years, they would have experienced this rapid change in climate and rapidly advancing coastline. It is hard to visualise how they coped with such a rapidly fluctuating coastline which would have been highly unstable even over decadal periods. As the sea advanced across the continental shelf, it probably ‘swept’ ahead of it large quantities of sand that had accumulated on the shelf from rivers which disgorged sediment as the rivers flattened out and lost their energy. This sand was pushed into embayments and now form the beautiful golden sands which occupy the many beaches along the east coast of Australia. Some of this sand was transported by wave energy into the mouth of Port Jackson as a tidal delta. Meanwhile, as the sea advanced into the now drowned river valley, sediment transported by rivers started to be deposited in the upper parts of the estuary as a fluvial delta. Fine-grained sediments, carried mostly in suspension after floods, are deposited in the middle of the estuary between the tidal and fluvial deltas.
The present-day estuary comprises five sedimentological units. Shallow off-channel embayments of the central harbour are covered in thick mud, as is the 30-metre deep basin in Middle Harbour. The main channel of the upper harbour is moderately deep, and also mantled in mainly muddy sand, but in the central harbour, the main channel is deeply scoured. The sand content of bottom sediment increases gradually downstream and the main part of the lower harbour seaward of the Sydney Harbour Bridge is mantled in sandy sediment. 220
Environmental history
Early European occupation 1788–1800
Although the Aborigines had occupied the Port Jackson estuary area for ten thousands of years, evidence of their presence is hard to find. However, after the arrival of the Europeans in 1788, the environment changed rapidly. Soon after settlement the Europeans embarked on extensive land clearing, but because of the poor soils around Port Jackson, cultivation soon moved westwards to the Nepean and Hawkesbury Rivers. Clearing and poor land practices promoted erosion, and sedimentation rates increased more than ten times pre-European levels in the estuary.
The First Fleet, which had departed Portsmouth on 13 May 1787, landed in Botany Bay under the command of Captain Arthur Phillip between 18 and 20 January 1788. Captain Phillip quickly realised that the land in the Botany Bay area was not fertile enough to support the 1000-strong party of the First Fleet and decided to move to Port Jackson – “the finest harbour in the world”. On 26 January 1788 Captain Phillip laid anchor in a wonderful cove with “spring water” which he called Sydney Cove. The next day Captain Phillip established the colony and took possession of New South Wales, while the convicts began cutting down trees. The Second and Third Fleets arrived in June 1790 and July–August 1791 respectively and the colony spread rapidly. More fertile land to the west around Parramatta and further away in the Hawkesbury and Nepean Rivers was cultivated and settled (McLoughlin 2000).
Industrialisation and urbanization 1800–1854
Industries began to take shape on the banks of Darling Harbour in about 1800 and soon spread to nearby Cockle, Rozelle and Blackwattle Bays close to the present-day Sydney central business district (CBD). Metal foundries were the first to be established and the number of these industries increased from three to 14 between 1831 and 1851 (Taylor, Birch & Links 2004; Walsh 1963). Tanneries started operation in 1803 in the same area and were soon joined by other small industries. By 1828, metal foundries, coppersmiths and paint manufacturers were established adjacent to Blackwattle Bay due to readily available water supply and 221proximity to the city (MacDonnell 1975). The region south and west of the city grew rapidly during the 1820s and the Darling Harbour – Rozelle Bay area was by this time fully developed. By 1848 this environment had become so degraded that legislation was passed to remove all tanneries and polluting industries out of the city to Botany, Willoughby and Parramatta.
Period 1854–1889
Prior to 1870, effectively all industrial activity in the Sydney region was located close to the present-day CBD, but steam power led to considerable growth in Sydney after this time. Metal working, engineering, building materials, clothing and textiles became major industries between 1861 and 1890. The introduction of tramways, railways and major bridges in the late 1880s prompted rapid urban expansion. Industrial activity in the Iron Cove catchment in 1870 consisted of only one blacksmith shop, but by 1891 the number had increased to 10 (Links 1998; Taylor, Birch & Links 2004). Also at this time, chemical industries, metal working, boat building, dye use, electrical and glass manufacturing, as well as horse-drawn vehicle building had taken root in the Iron Cove catchment. Land adjacent to Homebush Bay has been used for industrial purposes, including a naval armament store and brickworks, since the 1880s (Homebush Bay Corporation 1994; Suh, Birch & Hughes 2004; Suh, Birch & Hughes 2004; Suh, Brown & Birch 2003; Taylor, Birch & Links 2004).
Period 1889–1922
Sydney spread rapidly westwards between 1889 and 1922 and Iron Cove, Hen and Chicken and Homebush Bays became urbanised and industrialised. Detailed land use mapping (Jolly 2005) shows Iron Cove catchment changed from a suburb supporting predominantly large estates (30–40% of the total area) to one of mainly small residential blocks (57% of land use) in the period 1905 to 1930. In 1916 major abattoirs were relocated from Rozelle Bay to Homebush Bay. A large base metal foundry and a smelter commenced operations on the shores of Hen and Chicken Bay during the early 1900s.
222Industry replaced agriculture in the Parramatta River region (Powell 1987) and because the movement of imported goods and manufactured items required proximity to waterways, almost all waterfront on the shores of lower Parramatta River was occupied by industry by the end of the 19th century.
1922 to the present
Factories manufacturing heavy electrical equipment, large oil refineries and power supply stations were constructed close to the estuary between the First and Second World Wars. Many heavy industries situated in the inner, mixed residential/industrial areas of the city were relocated outside the Port Jackson catchment after the Second World War (Links 1998; Taylor, Birch & Links 2004). However, these industries were soon replaced with light industry, wholesalers and transport companies. Further decentralisation of industry occurred in Sydney after the Second World War due to a movement of people to the outer suburbs and a change in transportation, mainly toward trucking and containerisation (Webber & Daly 1971). Hen and Chicken Bay catchment remained predominantly agricultural until after the Second World War when it changed to medium-density housing.
Extensive parts of the Homebush Bay shoreline were reclaimed. The western shore was completely remodified prior to 1955, whereas the Rhodes Peninsula, on the eastern shore, was reclaimed later, between 1956 and 1975, creating opportunities for housing, industrial, commercial and recreational redevelopments. However, many of these industries have moved away from this region in recent times.
Foreshore development and reclamation in the harbour
Port Jackson has been extensively modified by reclamation over the last 200 years, especially in the upper and central estuary. Approximately 77 km of the 322 km of original shoreline has been lost due to reclamation and infilling of intertidal areas (Pitblado, 1978). Reclaimed areas are used mainly for industrial, recreational and residential uses and cover a total 11.35 km2 of the total 50 km2 or 23% of the estuary (Birch & Murray 2007; Murray 2003). Natural foreshores of mud flats and mangroves have given way to sea walls, wharves and buildings. The head of many 223embayments have been enclosed by sandstone walls and intertidal areas reclaimed by infilling. Reclamation has resulted in a loss of almost 9 million cubic metres of water on each tidal cycle, which has resulted in large changes in water movement, water quality, sedimentation and ecology of the upper harbour (Liu 1989). Sea walls have changed a ramp foreshore to a vertical shoreface altering the hydrology and ecology of the estuary. The following history of reclamation is mainly from the work of Murray (2003).
Period 1788–1854
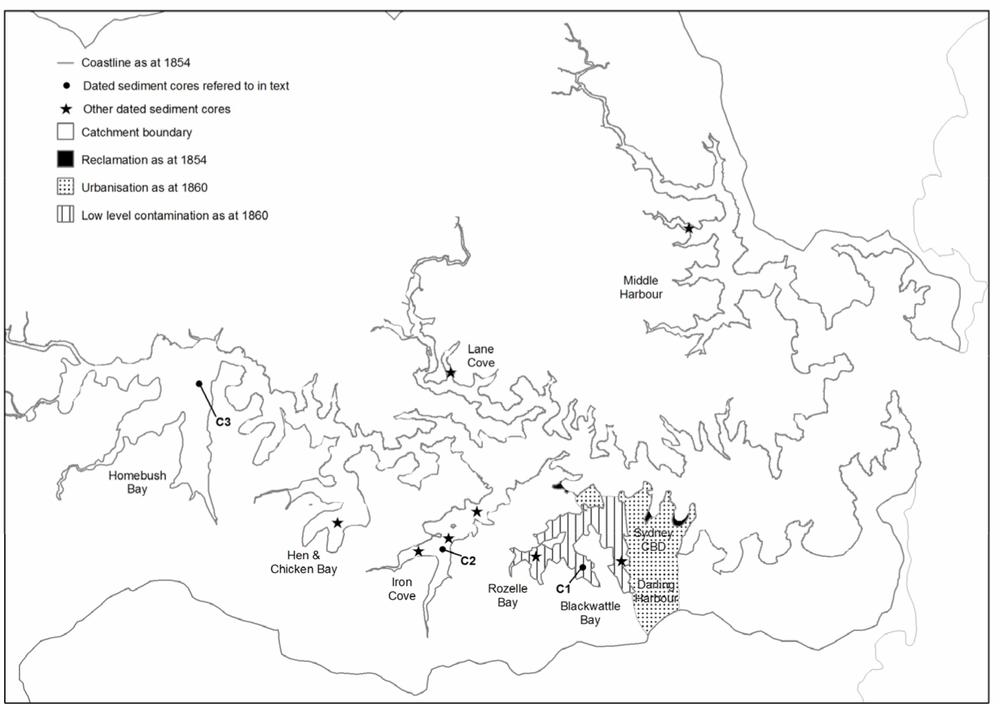
Figure 7.1 Only the central area of Sydney was urbanised by 1860 and foreshore reclamation was confined to Sydney and Farm Coves. The intensity of industrial activity can be judged by the number of ships in a photograph of Sydney Cove taken about this date (Figure 7.3). Sediment mantling Darling Harbour, Blackwattle Bay and Rozelle Bay began to show signs of heavy metal contamination by this time.
224The first change in the foreshore occurred when large allotments were given out to the military, civilian administration, wealthy merchants and the clergy and by 1830 minor reclamation had started for wharfage and farming (Godden Mackay Pty Ltd 1991; Liu 1989). The first major reclamation project in the harbour occurred in the period 1835–1854 when the head of Sydney Cove was remodelled into a semi-circular sandstone quay with the Tank Stream channelled and buried. Mort and Walsh Bays were infilled and the opening of the Australian Gas Light Company transformed Darling Harbour (Godden Mackay Pty Ltd 1991, 1993).
Period 1854–1889
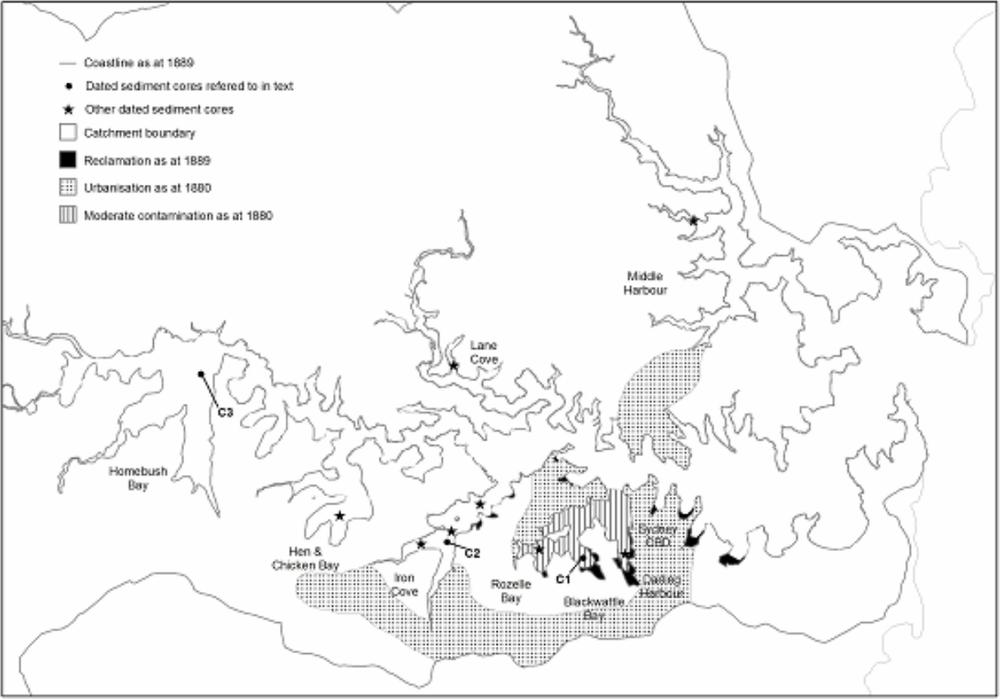
Figure 7.2 By 1880, urbanisation had spread to Iron Cove and most of the bay heads in the south, central part of the estuary had been reclaimed. At this time, sediments of Darling Harbour, Blackwattle Bay and Rozelle Bay had become moderately contaminated with heavy metals.
225The introduction of trams and trains lead to a boom in development and an increased need for residential, industrial and recreational space. This resulted in reclamation of embayments close to central Sydney, that is Sydney Cove, Blackwattle Bay, Pyrmont Bay, Darling Harbour, Woolloomooloo Bay and Rushcutters Bay (Fitzgerald & Golder, 1994; Godden Mackay Pty Ltd 1991, 1993; Shore 1981; Stephensen, 1966). A photograph taken of Sydney Cove in the late 1850s shows numerous ships and intense industrial activity in this area during these times (Figure 7.3). In the second half of the 18th century, domestic waste, sewerage, offal and dead animals were discarded into foreshore areas considered dumping grounds for unwanted waste (Stringer 1984). It was believed that disease was communicated by noxious vapours emanating from damp areas where faecal waste accumulated, and odours and the fear of disease emitted from these wetlands contributed greatly to reclamation during this period (Solling & Reynolds 1977).
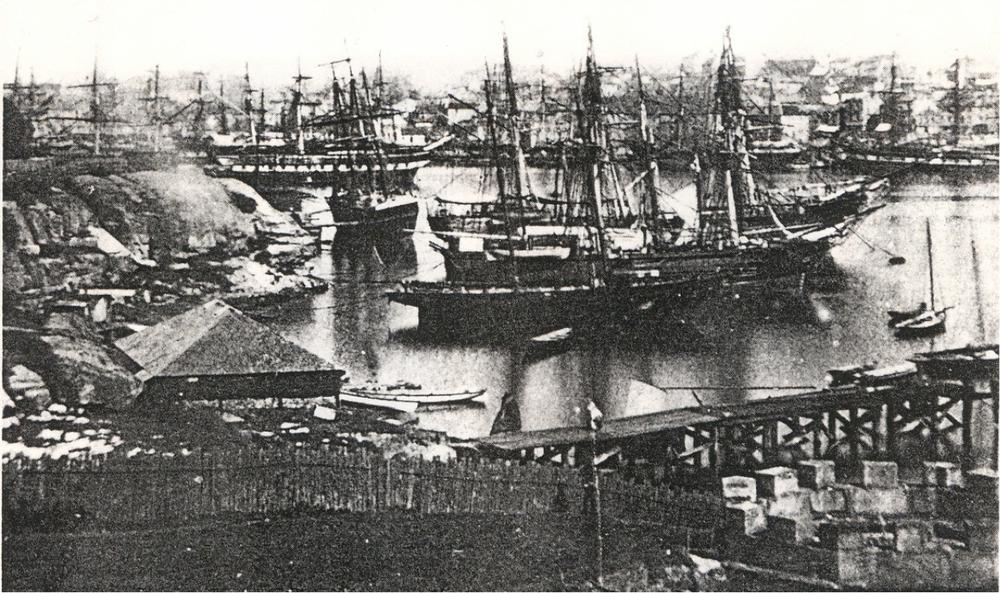
Figure 7.3 An early photograph of Sydney Cove taken in the late 1850s by an unknown photographer. The number of ships in the cove demonstrates the intensity of activity in this part of the harbour at this time. The period portrayed in this photograph correlates well with date of onset of contamination as indicated in a core taken from nearby Darling Harbour shown in Figure 7.6. The photograph is from the Macarthur Album titled “Sydney – The 1850s, the Lost Collections”, by Barry Groom and Warren Wickman from the Historic Photograph Collection, the University of Sydney. 226
Period 1889–1922
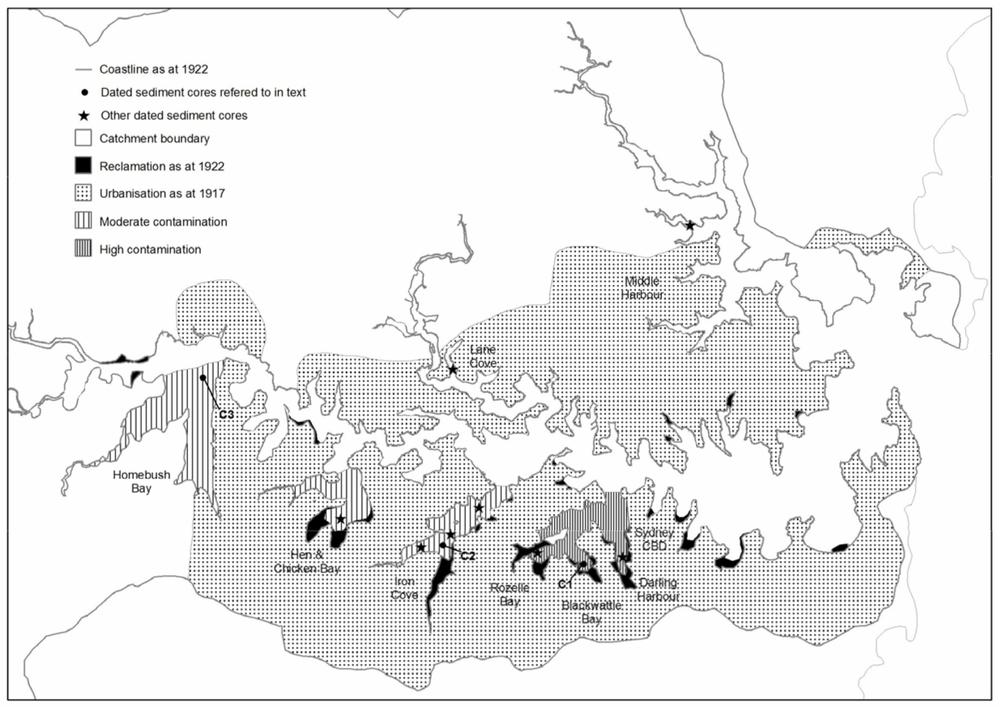
Figure 7.4 South of the harbour, urbanisation had spread from the estuary mouth to Homebush Bay by 1917, and the southern part of North Shore had become residential. Most of the upper ends of bays on the southern shores of the estuary had been reclaimed by 1922. Sediments in Darling Harbour, Blackwattle Bay and Rozelle Bay had become highly contaminated with heavy metals and Iron Cove, Hen and Chicken Bay and Homebush Bay sediments were moderately contaminated by 1917.
The continued widespread disposal of garbage in intertidal swamps (Coward 1988) to form industrial areas and parks (DEP 1986) was a major contributing factor to rat infestation and the outbreak of bubonic plague in 1898/99. The Sydney Harbour Trust (SHT) was formed under powers given by an Act of Parliament in 1900 to resume private 227enterprises and modernise dilapidated foreshores in Walsh Bay and Darling Harbour, which sheltered infestations of rats (Emery 1965; MSB 1974). Increased demand for accessible waterside land for port and industrial functions resulted in extensive reclamation in Canada Bay, Kings Bay, Hen and Chicken Bay, Iron Cove (Hawthorne Canal), White Bay, Rozelle Bay and Rose Bay.
Period 1922–2002
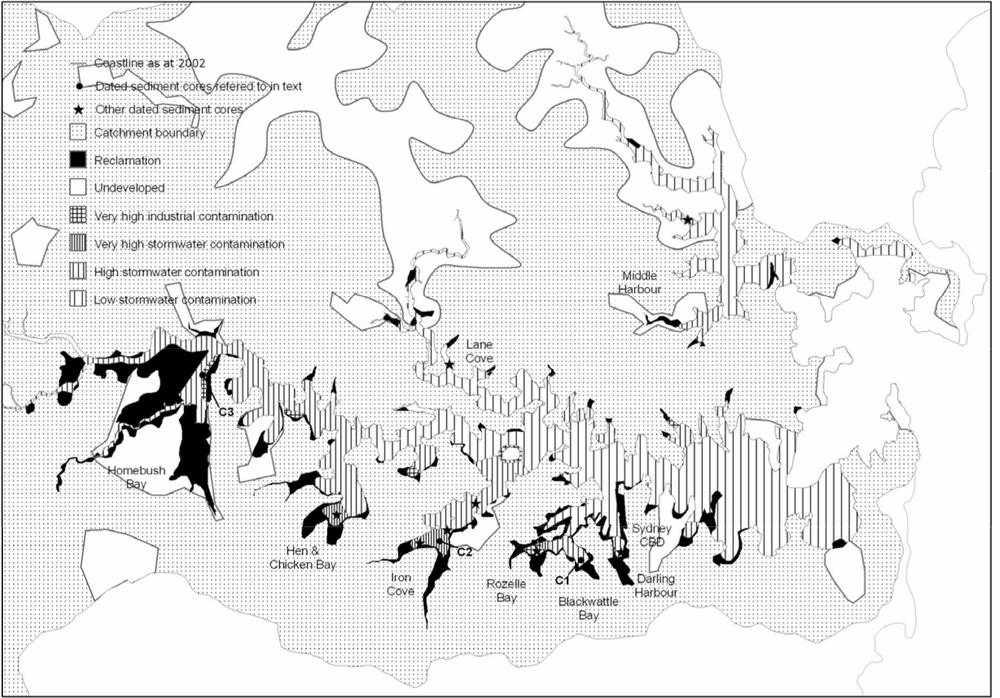
Figure 7.5 Urbanisation of the catchment is now almost complete, except for areas set aside for recreation and bush land reserves and foreshore reclamation has all but ceased. Sediments in the upper parts of bays, especially along the southern shores of the harbour, are highly contaminated with heavy metals and minor contamination is present in most sediment of the upper and central harbour, as well as in Middle Harbour and Lane Cove.
228The most active period of reclamation took place in Port Jackson between 1922 and 1955 when about 5.7 km2 of land was created adjacent to Parramatta River at Silverwater, Homebush Peninsula, Garden Island, Exile Bay, Kings Bay, Iron Cove, Glebe Island and Darling Harbour.
Between 1955 and 1978 reclamation was mainly by the use of landfill, including industrial wastes (Coward 1988) in low-lying areas adjacent to Middle Harbour, Parramatta River and Lane Cove River (McLoughlin, 1985). The last major reclamation period was from 1964 to 1981 when extensive foreshore areas were constructed to accommodate the new ‘roll-on, roll-off’ container shipping (Anglin & Associates 1990; Budin 1990; Fraser 1989; Proudfoot 1996).
Reclamation as a source of pollution
The total mass of material used to undertake 11.35 km2 of reclamation in Port Jackson has been estimated at over 100 million tonnes (Mt) (McLoughlin 2000). The most common method used to undertake this reclamation was to construct a sea wall and infill behind the barrier using garbage, industrial waste and sediments removed from the floor of the adjacent estuary. The composition of material used as infill varied with location and date of reclamation and although few records were made, the composition of one site is well known. The nature and extent of waste in the Homebush Bay area is well documented due to clean-up operations associated with the Sydney 2000 Olympic Games.
Prior to European settlement, this area comprised extensive tidal wetlands and thick woodlands, which were cleared and reclaimed from the early 1800s for farming. The region was used as a racecourse, brickworks, armaments depot and an abattoir between the mid-1880s and 1969. Unauthorised filling was commonplace from the late 1960s to the late 1970s. During this period over nine million cubic metres of commercial, domestic and industrial waste was dumped in the area (Suh et al 2004). A 25 metre-high engineered landfill rose above the southern bank of Haslams Creek and only 30 per cent of the Homebush Bay site retained its natural top soil and remnant vegetation. By 1970 Wentworth Bay ceased to exist and most of the low-lying land had been filled by 1978. Final filling along the north and south banks of Haslams Creek 229took place between 1979 and 1988. The significant ecological damage had been recognized by 1975 when licensing of landfills became law, but a further five years lapsed before regulations became fully enforced. A total of $137 million was allocated for clean-up of the site in one of the largest remediation projects carried out in Australia (Suh, Birch & Hughes 2004; Suh, Birch, Matthai et al 2004). Waste comprised putrescible, building, chemical and garbage municipal waste, construction debris, household garbage, demolition waste, ash fill and dredged sediment containing heavy metals, asbestos, a range of hydrocarbons, including dioxins, benzene, toluene, ethylbenzene and xylene (BTEX) compounds and polycyclic aromatic hydrocarbons, as well as organochlorine pesticides. A total of 400 tonnes of hazardous waste comprising dioxins, furans and other organochlorine compounds was classified as Scheduled Chemical Waste which had to be destroyed by a thermal/catalytic treatment under NSW REPA license (Birch, et al, 2007). In one of the largest surveys of its kind, 4531 soil samples were collected by coring through the infill for chemical analysis (Suh, Birch & Hughes 2004; Suh, Birch, Matthai et al 2004). Areas infilled with estuarine sediment from the adjacent bay contained elevated concentrations of heavy metals and in some areas soil metal concentrations were considered high enough to pose a threat to groundwater. This soil was removed and consolidated into small manageable areas capped with impermeable clay and surrounded by leachate drains to protect surrounding aquifers. To date, monitoring of the leachate drains indicate contaminant concentrations are at acceptable levels.
In a project specially designed to test leachate production in reclaimed lands due to rainwater filtration and tidal action, Suh, Brown & Birch (2003a, 2003b) placed six boreholes through infill at Bicentennial Park adjacent to Rozelle Bay. The Park (1.01 ha) was reclaimed between 1972 and 1980 by removal of approximately 31,000 m3 of material from the adjacent bay, primarily to attain navigation depths. In addition to the marine sediments, the fill comprised demolition waste, construction materials and industrial and domestic waste. Results of the experiment showed that during dry periods when water tables recede, oxygen ingress may lead to decreasing acidity (pH) and an associated increase in the concentrations of some heavy metals (copper, lead, zinc, arsenic and 230chrome). The results of the field study were tested under controlled conditions in the laboratory by percolating fresh and saline water through columns containing soil material from the park (Suh, Brown & Birch 2003a, 2003b). Although the parallel field studies had considerably higher concentrations of metals than that produced in the laboratory experiment, concentrations were orders of magnitude greater than natural sea water. It was concluded that elevated concentrations of heavy metals probably enter the estuary by tidal action and during periods of rainfall.
Although it has been demonstrated in the field and in controlled laboratory studies that the material used for infilling is a source of heavy metals to the estuary, the process has not yet been quantified. The juxtaposition of high contaminant concentrations in sediments at the heads of most estuary embayments and extensive reclamation in adjacent lands has obvious implications. However, stormwater canals also discharge to the estuary at these locations (Barry, Taylor & Birch 1999, 2001; Birch et al 1999) and differentiating the relative magnitude of each source is complex and has not yet been attempted. The extraordinary masses of materials dredged from the estuary floor for infilling and reclamation around Port Jackson gives an idea of the potential magnitude of this possible source. Almost a million tonnes of contaminated sediment from Iron Cove was used for reclamation at the mouths of Hawthorne and Iron Cove Creeks; 4.6 Mt in Homebush Bay and another 2.8 Mt on the banks of the Parramatta River (McLoughlin 2000).
Ecological effects of reclamation
It is not surprising that, with 23 per cent of the area of Port Jackson lost to reclamation, approximately 50 per cent of the shore is composed of retaining seawalls or other built habitats (Chapman & Bulleri 2003). Altered shorelines, particularly the construction of long stretches of seawalls, have major ecological impacts. The Centre for Research on Ecological Impacts of Coastal Cities at the University of Sydney is doing some excellent work on understanding the ecological role that seawalls and other intertidal structures have on urbanised estuaries (Blockley, Chapman in press; Chapman & Bulleri 2003;). Seawalls differ from natural rocky shores because they are usually steep and they have fewer 231crevices and overhangs than rocky shores and some habitats (e.g. rock pools) are absent. Also, vertical seawalls have a compressed intertidal area (1–2 m) in contrast to natural shores with lower gradients (10s of metres). These factors affect the distribution and abundance of intertidal organisms. At mid- and high-shore levels there are frequent differences between assemblages on natural shores and seawalls, but, at lower levels, differences between assemblages are considerably smaller.
The longest seawalls in Port Jackson have been constructed to support reclamation activities at the heads of embayments, for example Farm Cove, Woolloomooloo Bay and Iron Cove. These areas were once muddy, mangrove and saltmarsh wetlands with gentle slopes. The marked change in habitat in these areas has resulted in major alteration to ecological function, not to mention the reduction in biological productivity and changes in hydrology and physio-chemical attributes of the intertidal zone.
Historic effect of urbanisation and industrialisation on the Port Jackson estuary
The historic effect of increasing anthropogenic activity in the Port Jackson catchment on the adjacent estuarine environment has been established through an unusual collaboration by students and staff in urban geography and environmental chemistry in the Environmental Geology Group in the School of Geosciences at the University of Sydney (Birch & Murray 2007; Jolley 2005; Links 1998; Murray 2003; Taylor, Birch & Links 2004).
Studies of changing land use, development of industry and reclamation in Port Jackson, were undertaken by the School of Geosciences at the University of Sydney to determine potential adverse effects on the estuary by human activity in the adjacent catchment (Jolley 2005; Links 1998; Murray 2003; Taylor, Birch & Links 2004). Bottom sediments were used to determine possible effects on the estuary and to establish whether temporal changes in the catchment could be recorded in subsurface sediment in the estuary (Taylor, Birch & Links 2004). Sediment adsorbs contaminants from the overlying water column and thus has the ability to time integrate and to record the influx of contaminants into a water body. Because sediments are deposited layer-by-layer 232in a regular chronologic sequence, this sediment ‘memory’ can be used as an historic record of contaminant flux, which in turn reflects anthropogenic changes in the adjacent catchment (Taylor 2000). To test this concept in Port Jackson, 12 sedimentary cores where taken in nine highly contaminated embayments and down-hole samples were analysed for contaminants and dated using radioisotopes lead 210 and caesium 137 (Taylor 2000; Taylor, Birch & Links 2004).
Three of the 12 cores, one each from Blackwattle Bay (Core 1), Iron Cove (Core 2) and Homebush Bay (Core 3) are reproduced in Figure 7.6. These bays are all mantled in highly contaminated sediment and are located with increasing distance from central Sydney, that is, approximately 2, 5 and 12 km, respectively. All three cores show low concentration of heavy metals (copper, lead and zinc) at the bottom of the core and at some depth concentrations increase markedly. In some cases concentrations towards the top of the core remain constant, continue to increase, or begin to decrease. The depth at which concentrations begin to increase is the point, or time, where contaminants start to be discharged from the catchment, that is, the onset of contamination is faithfully recorded in the sediment. Contamination commenced in about 1860 in Blackwattle Bay (Core 1) and in approximately 1910 in Iron Cove (Core 2). Core 3 from Homebush Bay records adverse effects of human activity beginning at about 1925. The spread of urbanization and the development of industry outwards from central Sydney (Figures 1, 2, 4 and 5) are reflected in the expansion of contaminated sediment in the adjacent estuary.
The date of onset of contamination, as depicted in the cores, shows approximately the same timing as that of urbanisation and industrialisation in the adjacent catchments. Moreover, the severity of contamination in the sediment profile also decreases away from central Sydney with decreasing urban intensity. For example, zinc in sediment from the core taken closest to central Sydney (Core 1) in Blackwattle Bay is at a maximum of about 2000 μg/g and for the core taken in Iron Cove (Core 2) it is approximately 1500 μg/g, whereas in Homebush Bay the maximum zinc concentration in the sediment is approximately 1000 μg/g.
233The data provided here are for heavy metals, but the same trend is evident for organic contaminants as well (Taylor, Birch & Links 2004). Organochlorine compounds are entirely artificial insecticides and herbicides and these chemicals came into use in Australia after the Second World War. The onset of these organic contaminants in the core profiles are dated at 1945, almost precisely when they were introduced into the catchment.
These results provide confidence in the methodology and the science of the current approach. Although similar results have been obtained for individual, site-specific studies, this is the only catchment-wide demonstration of this approach.
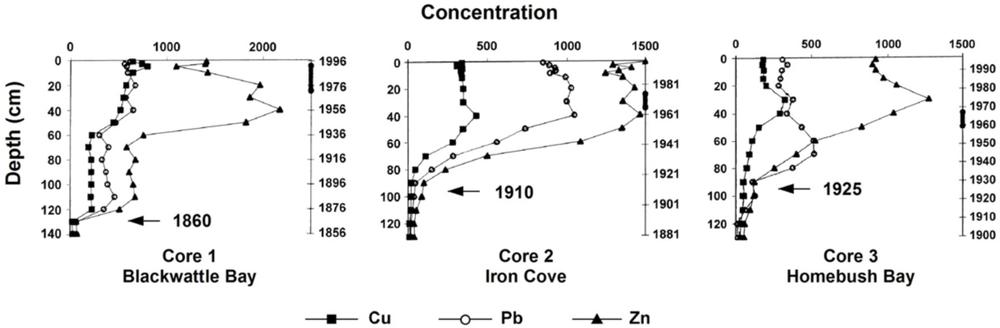
Figure 7.6 Cores from Blackwattle Bay, Iron Cove and Homebush Bay show the vertical distribution of heavy metal concentrations in the sediment. At the bottom of each core, the concentration of metals is uniformably low, but at some depth metal levels increase rapidly. This depth (marked with an arrow) is the date of onset of contamination. In Core 1, from Blackwattle Bay close to the city, onset of contamination was in about 1860, and onset dates are later for Cores 2 (Iron Cove) and 3 (Homebush Bay), which are located further from the city centre. This spread of contamination demonstrates how the estuary responded to encroaching urbanisation across the catchment. 234
Recent environmental history
More historic information can be gleaned from cores such as these. It is evident from Core 1 that zinc concentrations attained a maximum in the sediment in about 1955 and concentrations have been generally decreasing since that time. In fact, concentrations are almost half the maximum at present, whereas copper continues to increase in sediments at this location. There is evidence from the core profile that the concentration of lead has started to decline in recent times in Blackwattle Bay. There appears to have been two phases of contamination in this bay: a period of moderate contamination from 1875 to 1910, followed by a period of high contamination from 1910 to the present. In Iron Cove (Core 2), zinc concentrations reached a maximum in approximately 1960 and have remained high to the present day. Copper and lead also attained a maximum in Iron Cove at this time, but while lead appears to be decreasing slightly, copper concentrations have remained high and constant. Core 3 from Homebush Bay shows contamination reaching maximum concentrations in about 1970 for zinc and copper, but the maximum lead concentration occurred earlier in the 1940s, perhaps due to the introduction of industry manufacturing lead-based products on the shores of the bay. Increasing copper concentrations in recent times is commonly observed in sediments of Sydney Harbour, perhaps due to the continued use of copper-based antifouling boat paints, whereas declining lead over the last 15 years has been attributed to the introduction of unleaded petrol. The main source of zinc is vehicular emissions and component wear and is transported to the estuary by storm water.
Regional trends in contamination have been investigated by the Environmental Geology Group in the School of Geosciences at the University of Sydney using a considerably larger core database in conjunction with several vintages of surface sediment metal concentrations from about the mid-1970s to the present. Data from the cores and surficial sediments show that, in general, concentrations of metals in bottom sediment have been declining in the upper parts of the estuary, west of the Sydney Harbour Bridge, but have been increasing in the lower harbour, in Lane Cove and Middle Harbour over the last 25 years (Birch & Taylor 2004). The decrease in metal concentrations since the late 1970s is consistent with the introduction of the Clean Waters Act 235which required industry to discharge waste into the sewerage system and to reduce waste generation. A decision by industry to relocate out of the Sydney Harbour catchment over the last 25 years has also contributed to reduction of metal flux to the harbour. Relocating industry away from high-land value real estate on the water front with high-density housing has undoubtedly also reduced contaminant loads discharged directly to the estuary. The move has also changed appreciation of the harbour from former working class suburbs to high-value, middle class areas, for example Balmain and Woolwich.
Increased metals concentration over the same 25-year period in sediments of Lane Cove and Middle Harbour have been attributed to a rapid expansion of residential and commercial property, as well as increased transport services in the Chatswood and North Ryde areas (Taylor, Birch & Links 2004). High concentrations of metals in sediments of rivers and creeks draining these areas support this view (Birch & Taylor 2004).
Present status of Port Jackson
Sediment in some parts of Port Jackson is the most contaminated of any harbour worldwide. Sediments mantling the estuary contain high concentrations of a wide range of contaminants over extensive areas, including heavy metals, organochlorine pesticides, polycyclic aromatic hydrocarbons (PAHs), polychlorinated biphenyls (PCBs), polychlorinated dibenzo-p-dioxins and dibenzofurans (Birch & Taylor, 1999, 2000; Birch et al 2006; Irvine & Birch, 1998; McCready et al 2000). The origin of these substances can be broadly grouped as related to industrial activities, past and current stormwater discharge and leachates from reclaimed land. The industrial source is due largely to historical poor practices, whereas stormwater and leachate sources are past and contemporary. Early industry was located on the shoreline of the port for convenience and cheap delivery of raw materials, as well as for reducing haulage costs for coal to power stations. Export of heavy, bulky manufactured goods was also easy and inexpensive for shore-based industries. Contamination of adjacent sediment by waste associated with the movement of goods, and from cheap disposal of waste directly into the harbour, accounts for most of past industrially-sourced contamination.
236Sampling of rivers and creeks discharging to Port Jackson has shown that stormwater continues to provide large quantities of contaminants, mainly heavy metals to the receiving basin. Although it is known that contaminants are being sourced from waste material contained within reclaimed lands surrounding the harbour, the magnitude of this supply remains unquantified, as with other diffuse sources, such as atmospheric deposition.
The majority of these contaminants are associated with the particulate phase, but the processes whereby these particle-bound contaminants are transported within the estuary and the effects of these materials on flora and fauna are poorly known and are the subject of current studies. Recent large ecotoxicological studies (McCready et al 2004; McCready et al 2005; McCready, Birch & Long 2006; McCready et al 2006a 2006b, 2006c) have shown that sediment in high impact areas of the harbour are toxic to some benthic animals, as was predicted by earlier investigations of sediment quality (Birch & Taylor, 2002a, 2002b, 2002c). To date little work has been done on the transfer of contaminants in the water column and bottom sediment to benthic and pelagic animals, termed ‘bioaccumulation’, or on the movement of these materials up the food chain, called ‘biomagnification’.
Early studies detected high total PCB concentrations in mullet caught in Port Jackson (Woollard & Settle 1978), but mean values appear to have decreased since then (Richardson 1985). In a more recent study of chlorinated hydrocarbons in the tissue of seven fish types, concentrations exceeded National Food Authority Maximum Residue Limits for two species in Duck River, Homebush Bay and Iron Cove and one species in Parramatta River (Roach & Runcie 1998). High concentrations of polychlorinated dibenzo-p-dioxins and polychlorinated dibenzofurans in sediment in Homebush Bay have resulted in unacceptably high tissue concentration in fin fish. In 1989 fin fishing was banned in the bay and in the following year the ban was expanded to include the whole upper third of the harbour. More recent monitoring saw the NSW Food Authority posing a 3-month ban on commercial fin fishing in the whole harbour in December, 2005, which in January the following year was extended to include prawn trawling. 237These bans were made permanent in February 2006. Blood tests of prawn fishermen showed one individual with four-times the average dioxin concentrations and his son with seven times average levels. One grandfather had concentrations 10 times average values. However, these levels were not deemed detrimental to human health. Studies continue to determine the extent of the problem and how best to reduce bottom sediment concentrations to levels where fish and prawn tissue levels decline to acceptable values.
The appropriate and successful governance of this estuary requires high-quality, science-based information. The current challenges for scientists are to identify and quantify sources, understand the mechanisms controlling the fate of contaminants, determine the effects of these substances on living resources and construct management tools based on robust science. Modelling the source, fate and effects of these contaminants in Port Jackson will enable managers and planners to make decisions on such issues as stormwater remediation options, relaxation times (natural cleanup), and the amount of dredging required to reduce tissue concentrations to acceptable limits and to set maximum daily loading for creeks entering the water way. In recent times, considerable effort has resulted in reduced industrial waste entering Port Jackson. Now is an appropriate time to initiate a new concerted environmental effort to install second generation remedial devices to reduce current stormwater contaminant inputs. It is also time to undertake appropriate remedial work in the catchment and in the estuary to restore the harbour to a condition in which it can support a complete and healthy ecological community.
Acknowledgements
Funding for 210Pb and 137Cs radioisotopic dating of sediment cores was provided by the Australian Institute of Nuclear Science and Technology. The authors thank Henk Heijnis and Andrew Jenkinson of the Environmental Radioisotope Laboratory at Australian Nuclear Science and Technology Organisation, Lucas Heights for their advice with radioisotopic dating. The author thanks Marco Olmos for drafting the figures to this manuscript and to Phil McManus for comments on an early draft of the manuscript. 238
References
Anglin and Associates, 1990. Sydney Harbour: Maritime Services Board Heritage and Conservation Register: History, vol 1, Anglin Associates, Sydney.
Barry S C, Taylor S E & Birch G F, 1999. ‘Heavy metals in urban stormwater canals entering Port Jackson, Australia and their impact on the estuarine environment’, Proceedings of the Eighth International Conference on Urban Storm Drainage, Sydney, Joliffe & Ball J E (eds.), August, vol. 4, pp. 1825-1832.
Barry S C, Taylor S E & Birch G F, 2001. ‘Heavy metal supply to the Port Jackson Estuary, Australia by stormwater’, Australian Journal of Water Resources, vol. 4, no. 2, pp. 147–154.
Birch G F, Scollen A, Snowden R & Suh J, 1999. ‘Sources of heavy metals in stormwater draining into Port Jackson, Australia’, Proceedings of the Eighth International Conference on Urban Storm Drainage, Sydney, Joliffe & Ball J E (eds.), August, vol. 4, pp. 2202–2209.
Birch G F & Taylor S E, 1999. ‘Source of heavy metals in sediments of Port Jackson estuary, Australia’, The Science of the Total Environment, vol. 227, pp. 123–138.
Birch G F, 2000. ‘Marine pollution in Australia, with special emphasis on central New South Wales estuaries and adjacent continental margin’, International Journal of Environmental Pollution, vol 13, pp. 1–6 & 411–423.
Birch G F & Taylor S E, 2000. ‘The distribution and possible sources of organochlorine residues in sediments of a large urban estuary, Port Jackson, Sydney’, Australian Journal of Earth Sciences, vol. 47, pp. 749–756.
Birch G F & Taylor S E, 2002a. ‘Possible biological significance of contaminated sediments in Port Jackson, Sydney, Australia’, Environmental Monitoring and Assessment, vol. 77, pp. 179–190.
Birch G F & Taylor S E, 2002b. ‘Application of sediment quality guidelines in the assessment of contaminated surficial sediments in Port Jackson (Sydney Harbour), Australia’, Environmental Management, vol. 29, no. 6, pp. 860–870. 239
Birch G F & Taylor S E, 2002c. ‘Assessment of possible sediment toxicity of contaminated sediments in Port Jackson estuary, Sydney, Australia’, Hydrobiologia, vol. 472, pp. 19–27.
Birch G F & Taylor S E, 2004. Sydney Harbour and catchment: contaminant status of Sydney Harbour sediments: a handbook for the public and professionals, Geological Society of Australia, Environmental, Engineering and Hydrogeology Specialist Group.
Birch G F, Harrington C, Symons R K & Hunt J W, 2006. ‘The source and distribution of polychlorinated dibenzo-p-dioxin and polychlorinated dibenzofurans in sediments of Port Jackson, Australia’, Marine Pollution Bulletin, no. 54, pp. 295–308.
Birch G F & Murray O A, 2007. Reclamation in Sydney Harbour, 1788–2002, Australian Geographer.
Blockley D J & Chapman M G, (in press). ‘Exposure of seawalls to waves within an urban estuary: effects on intertidal assemblages’, Austral Ecology.
Budin W H, 1990. Change in the use of portside lands in Sydney Harbour, MURP thesis, University of Sydney, Sydney.
Chapman M G & F Bulleri, 2003. ‘Intertidal seawalls: new features of landscape in intertidal environments. landscape and urban planning’, vol. 62, pp. 159–172.
Coward D, 1988. ‘Out of Sight: Sydney’s environmental history 1851–1981’, Department of Economic History, Research School of Social Sciences, Australian National University, ACT.
DEP, 1986. Parramatta River Regional Environmental Study: open space and recreation: Heritage Study, Department of Environment and Planning, Sydney.
Emery J S, 1965. Port of Sydney, 1788–1945: a geographical study of development with particular emphasis on the influence of trade, MA thesis, University of Sydney, Sydney.
Fitzgerald S & Golder H, 1994. Pyrmont and Ultimo, Hale and Iremonger, Sydney.
Fraser D, 1989. Sydney, from settlement to city: an engineering history of Sydney. Engineers Australia Pty Ltd.
Godden Mackay Pty Ltd, 1991. Sydney and Middle Harbours Heritage Study. Final report. Report prepared for the NSW Department of Planning, Godden Mackay Pty Ltd, Sydney.240
Godden Mackay Pty Ltd, Conybeare Morrison & Partners, 1993. North Shore Heritage Study Review, part 1, vol 1, main report.
Homebush Bay Corporation, 1994. Briefing document on site contamination and environmental investigations at Homebush Bay, Homebush Bay Corporation, NSW.
Irvine I & Birch G F, 1998. ‘Distribution of heavy metals in surficial sediments of Port Jackson, Sydney, Australia’ Australian Journal of Earth Sciences, vol. 45, no. 1, pp. 169–174.
Jolley R, 2005. Onset and flux of Cu, Pb and Zn loads in runoff in relation to historical changes in land-use, Iron Cove, Port Jackson, Australia 1885–1996.
Links F, 1998. Assessment of catchment control on the contaminant characteristics of receiving basin sediments. A study of Sydney Harbour, Australia, BSc Hons thesis, University of Sydney, Sydney.
Liu K, 1989. Evolution of the sedimentation in Sydney Harbour, MSc. Thesis, University of Sydney, Sydney.
MacDonnell, 1975. The Glebe: Portraits and Places, Ure Smith, Sydney.
Marine Services Board, 1974. The Sydney Harbour Water-side Zoning Plan, The Maritime Services Board of NSW, Sydney.
McCready S, Slee D, Birch G F & Taylor S E, 2000. ‘The distribution of polycyclic aromatic hydrocarbons in surficial sediments of Sydney Harbour, Australia’, Marine Pollution Bulletin, vol. 40, no. 11, pp. 999–1006.
McCready S, Spyrakis G, Greely C R, Birch G F & Long E R, 2004. ‘Toxicity of surficial sediments from Sydney Harbour and vicinity’, Australia. Environmental Monitoring and Assessment, no. 96, pp. 53–83.
McCready S, Greely C R, Hyne R V, Birch G F & Long E R, 2005. ‘Sensitivity of an indigenous amphipod, Corophium sp. to chemical contaminants in laboratory toxicity tests conducted with field collected sediment from Sydney Harbour, Australia and vicinity’, Environmental Toxicology and Chemistry, vol. 24, no. 10, pp. 2545–2552.
McCready, S., Birch, G. F. and Long, E. R., 2006a. Metallic and organic contaminants in sediments of Sydney Harbour and vicinity – A chemical dataset for evaluating sediment quality guidelines. Environment International, 32, 455–465
McCready S, Birch G F, Long E R, Spyrakis G & Greely C R, 2006b. ‘Predictive abilities of numerical sediment quality guidelines for 241Sydney Harbour, Australia and vicinity’, Environment International, vol. 32, pp. 638–649.
McCready S, Birch G F, Long E R, Spyrakis G & Greely C R, 2006c. ‘Relationships between toxicity and concentrations of chemical contaminants in sediments from Sydney Harbour, Australia, and vicinity’, Environmental Monitoring and Assessment, vol. 120, pp. 187–220.
McDonald W S, Cocks L K, Wood N, Ive J R & Yapp G A, 1993. ‘The future population of Australia’s coastal lands’ Australian Geographic Studies, vol. 31, no. 2, pp. 177–188.
McLoughlin L C, 1985. The Middle Lane Cove River: a history and a future, Centre for Environmental and Urban Studies, Macquarie University, NSW.
McLoughlin L C, 2000. ‘Shaping Sydney Harbour: sedimentation, dredging and reclamation 1788–1990s’, Australian Geographer, vol. 31, no.2, pp. 183–208.
Murray O A, 2003. A history of reclamation in Sydney Harbour 1788–2002. MApplSci thesis, University of Sydney, Sydney.
NLWRA, 2002. National land and water resources audit (2002) Australian catchment, river and estuary assessment 2002, vol. 1. National Land and Water Resources Audit, Canberra.
Phillips D J H, Richardson B J, Murray A P & Fabris J G, 1992. ‘Trace metals, organochlorines and hydrocarbons in Port Philip Bay, Victoria, A historical review’, Marine Pollution Bulletin, vol. 25, pp. 5–8 & 200–217.
Pitblado R M, 1978. Estuarine modelling; the development and validation of a 2-layer, real-time model for the Parramatta River estuary, PhD thesis, University of Sydney, Sydney.
Powell C, 1987. A river revived: the Parramatta. NSW University Press, Sydney.
Proudfoot P, 1996. Seaport Sydney: the making of the city landscape, University of Sydney, Sydney.
Richardson J, 1985. ‘Polychlorinated biphenyls (PCBs) in Australian waters’, in Chan M W H, Hoare R W M, Holmes P R, Law R J S & Reed S B (eds.), ‘Pollution in the Urban Environment Palmet 85’, pp. 652–658, Elsevier Applied Science Publishers, London.
Roach A C & Runchie J, 1998. ‘Levels of selected chlorinated hydrocarbons in edible fish tissues from polluted areas in the 242Georges/Cooks Rivers and Sydney Harbour, New South Wales, Australia’ Marine Pollution Bulletin, vol. 36, pp. 323–344.
Roy P S, 1981. ‘Quaternary Geology’ in Herbert C, (ed.) Geology of the Sydney, 1:1000,000 sheet 9130, Geological Survey of New South Wales, Sydney, pp. 41–91.
Roy P S, Zhuang W, Birch G F, Cowell P J & Li C, 1997. Quaternary geology of the Forster-Tuncurry coast and shelf, Southeast Australia, Geological Survey of New South Wales, Department of Minerals Resources, Sydney.
Roy P S, 1998. ‘Cainozoic geology of the coast and shelf’, in Scheibner, E & Basden H (eds.), Geology of New South Wales Synthesis. vol. 2 Geological Evolution, Geological Survey of New South Wales, Memoir Geology, vol. 13, no. 2, pp. 361–385.
Shore H, 1981. From the Quays, NSW University Press, Sydney.
Snowdon R & Birch G F, ‘The nature and distribution of copper, lead, and zinc in soils of a highly urbanised sub-catchment (Iron Cove) of Port Jackson, Sydney’, Australian Journal of Soil Research, vol. 42, no. 3, pp. 329–338.
Stephensen P R, 1966. History and Description of Sydney Harbour, Rigby Limited, Sydney.
Solling M & Reynolds P, 1977. Leichhardt: on the margins of the city: a social history of Leichhardt and the former Municipalities of Annandale, Balmain and Glebe, Allen and Unwin, Sydney.
Stringer M, 1984. Sydney Harbour: a pictorial history from the first settlers to the present day, Rankin & Company, Sydney.
Suh J, Brown P & Birch G F, 2003a. ‘Geochemical factors affecting leachate composition derived from soils in reclaimed land using laboratory freshwater and saline water column experiments’, Marine and Freshwater Research, vol. 54, pp. 885–893.
Suh J, Brown P & Birch G F, 2003b. ‘Hydrogeochemical characteristics and importance of natural and anthropogenic influences on soil and groundwater in a reclaimed land adjacent to Port Jackson, Sydney, Australia’, Marine and Freshwater Research, vol. 54, pp. 767–779.
Suh J, Birch G F, Matthai C & Hughes K, 2004a. ‘Spatial distribution and sources of heavy metals in reclaimed lands of Homebush Bay; the venue of the 2000 Olympic Games, Sydney, New South Wales’, Australian Journal of Earth Sciences, vol. 51, pp. 53–66. 243
Suh J, Birch G F & Hughes K, 2004b. ‘Hydrochemistry in reclaimed lands of the 2000 Olympic Games site, Sydney, Australia’, Journal of Coastal Research, vol. 20, no. 3, pp. 709–721.
Taylor S E, 2000. The source and remobilisation of contaminated sediment in Port Jackson, Australia. PhD thesis, the University of Sydney, Sydney.
Taylor S E, Birch G F, & Links E, 2004. ‘Historical catchment changes and temporal impact on sediment of the receiving basin, Port Jackson, New South Wales’, Australian Journal of Earth Sciences, vol. 51, no. 2, pp. 233–246.
Thom B G & Roy P S, 1985. ‘Relative sea levels and coastal sedimentation in southeast Australia in the Holocene’, Journal of Sedimentary Petrology, vol. 55, pp. 257–264.
Walsh G P, 1963. ‘The Geography of Manufacturing in Sydney 1788–1851’, Business Archives and History, vol. 3, no. 1, pp. 20–52.
Webber & Daly, 1971. ‘Location of manufacturing growth within cities: a predictive model for Sydney 1954–1966’, Royal Australian Planning Institute Journal, vol. 9, pp. 130–136.
Woollard P & Settle H, 1978. ‘PCB residues in mullet, Mugil cephalus fed to captive Eastern Australian water rats, Hydromys chrysogaster’, Bulletin of Environmental Contamination and Toxicology, vol. 20, pp. 606–612.
Zann L P, 1996. ‘The state of the marine environment report for Australia (SOMER). Process, findings and perspective’, Ocean and Coastal Management, vol. 33, pp. 1–3 & 63–86.