2
Lessons from the Swedish experience
Introduction
An important principle in the Swedish welfare model is that all adults – women and men, mothers and fathers – should have the possibility to support themselves through wage work. Public child care constitutes a very important part of the social infrastructure which should make this possible (Bergqvist & Nyberg 2001, 2002). However, an adequate supply of public child care is not enough; it should also be accessible, of high quality and affordable. If not, public child care risks being a marginal phenomenon, a last resort for mothers (parents) who do not have a choice.
The policies laying the foundations of the dual earner model emerged in Sweden in the course of the 1960s and 1970s (Sainsbury 1996, 1999; Bergqvist et al. 1999; Löfström 2004). A new approach to gender equality in both employment and responsibility for children and family became acknowledged in the law and in policies, if not always in practice. However, at the beginning of the 1990s there was a sharp economic downturn. The employment rate fell dramatically and unemployment soared to levels unthinkable since the 1930s.1 The employment crisis, in turn, produced an accelerating public sector deficit, with revenues plummeting and public expenditures shooting up.2 The situation began to improve only as the decade came to an end, but the employment rate is considerably lower today than in 1990, while the unemployment rate is much higher and this is true for both women and men. In
39addition to the economic crisis, there were also other factors that might constitute a challenge to the stability of the traditional Swedish welfare model, the dual earner model and gender equality. First, the Social Democratic Party lost its historically dominant position, which opened the way for neo-liberal ideas on market forces and privatisation. The internationalisation of capital markets and financial transactions, plus Sweden’s participation in the European integration project also posed new challenges.
Given the unemployment situation, the financial strains, globalisation, and the spread of neo-liberal ideas, it is reasonable to assume that serious attempts to transform the Swedish welfare state might have been undertaken and the dual earner model might be undermined. The aim of this article is to assess the consequences of the economic crisis on publicly financed child care. What happened to the supply of child care, to the accessibility, affordability and to the quality in public child care between 1990 and 2005? To start with, however, the background in terms of mothers’ employment and the expansion of public child care is briefly presented.
Mothers’ employment and the expansion of child care
In Sweden, child care attracted considerable attention in the 1960s (Nyberg 1995, 2000; Bergqvist & Nyberg 2001). This was due to the increase in mothers’ employment and the activities of the feminist movement, which put pressure on the government to provide publicly financed child care (Elgán 2001). The demand for full-time child care was reviewed, bills were introduced into parliament, politicians and authorities were courted. In 1966, public grants to full-time childcare centres doubled to encourage expansion and improve the quality of care. The grants did stimulate expansion, and the number of places for full-time care grew faster than the number of places for part-time care, which meant that policies shifted from support of part-time care and ‘at-home mothers’ to full-time care and working mothers.
While childcare centres were the most common form of child care, family day care homes were also of considerable importance and a cheaper and easier way to expand child care than to establish day care centres/preschools. The number of children in family day care homes expanded and reached a peak at the end of the 401980s, but has since declined almost every year (Skolverket 1998, pp. 13–14)3.
A contributing factor to the government’s positive reaction to the demands for publicly financed child care was the rather large number of women involved in political decision making, especially concerning social and family policy (Bergqvist 2001). However, it takes time to establish preschools and leisure-time centres, and the shortage of publicly funded child care remained a problem for a long time and parents had to rely on informal child care.
It is often assumed that the rise in mothers’ employment in Sweden was more or less the result of an intensive gender equality policy and the expansion of public child care. However, as we can see from Figure 2.1, it would be more correct to describe the order of the development the other way around: mothers entered the labour market first and this created a demand for public child care. In 1970, about half of the mothers with preschool children (0–6 years) were employed, while only 16–17 per cent of the children were enrolled in public child care (see Figure 2.1).
The employment data underestimate the demand for child care since many mothers have more than one child, and there are mothers who study and children with special needs. On the other hand, the data overestimate the degree to which mothers are ‘at work’, since mothers on parental leave are regarded as being employed. Although publicly funded child care was not well developed, small children did not prevent their mothers from entering the labour market. Instead, child care was to a large extent arranged in the informal market (Nyberg 2000).
Between 1970 and 1990 the rate of employment of mothers with preschool children increased continuously. However, during the 1980s, the increase in the proportion of children in public child care stagnated. One reason for this, besides supply side factors, was the extension of parental leave. Parental leave was introduced in 1974, when it replaced maternity leave, which meant that the principal entitlement to leave following the birth of a child was no longer reserved for the mother, but could also be used by the father. At the beginning of the 1970s, maternity leave, and then parental leave, was set at six months per child. By 1975 the
41entitlement was lengthened to 7 months, in 1978 to 8 months, and in 1980 to 12 months. By 1990 parental leave had reached 15 months (Nyberg 2004). It was also possible to stretch out the parental allowance days, which meant that children were older when they entered public child care in 1990 than at the beginning of the 1970s. The length of the parental leave does not only affect the youngest children, but also older children as the parent on parental leave also cares for the older siblings of the new-born baby. However, in spite of the expansion of publicly financed child care, demand was still greater than supply in 1990.
Figure 2.1 Employment rate of mothers with children below the age of 7, and proportion of children 1–2 and 3–6 years in public child care between 1970–1990
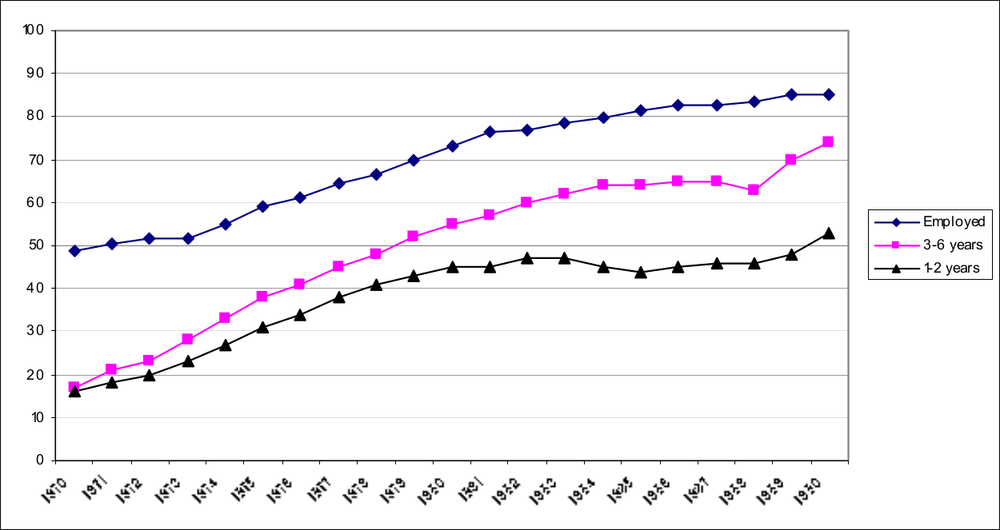
Source: Mothers’ employment – Labor Force Surveys (AKU); Children in public child care – Skolverket 1998, Table 2.
Legislation
From a comparative perspective, the Swedish welfare state is often described as universal, but in practice many social benefits are related to labour market participation. The right to child care has typically been restricted to children whose parents were employed (or studying) or to children with special needs, that is, labour 42market participation or need have formed the basis for eligibility for public child care.
The expansion in public child care that took place in the 1970s was governed by state grants to the municipalities earmarked for child care. The aim then was to guarantee a uniform public childcare system that offered the same conditions throughout the country. During the 1980s a new philosophy was introduced: ‘decentralization’ became the word of the day and decision making was transferred from the state to the municipalities. In 1993, therefore, program-specific state grants for child care were replaced by block grants (Bergqvist & Nyberg 2001, 2002).
In 1985 the Swedish Parliament decided that all children aged between 18 months and school age with working or studying parents or children with special needs were to be entitled to a place in public child care by 1991. But the municipalities were only obliged to include the expansion of child care in their plans, which meant that in reality the growth in the number of places was too slow in relation to demand, as seen in Figure 2.2. Therefore, in January 1995, new legislation came into force specifying the municipalities’ obligations to provide preschool activities and child care without unreasonable delay, meaning within three to four months of a parent applying for child care. A place must be offered as close to the child’s home as possible and with reasonable consideration being given to the parents’ wishes (Skolverket 2003a, p. 13).
Another change in the 1990s came when the non-Socialist parties opened up the way for government subsidies to go to profit-making childcare services. Although the Social Democrats had opposed this, they did not change this decision when they returned to power in 1994. Privately organised (but publicly regulated and financed) child care has become ever more common since then. The proportion of children in privately organised preschools increased from 5 per cent in 1990, to 15 per cent in 2000 and to 17 per cent in 2005 (Skolverket 2006, Table 1.5). However, many children in so-called private preschools are in preschools run by non-profit organisations. This is partly a legacy from the 1980s, when parents set up parent cooperatives – which could already at that time receive subsidies – as a response to the lack of places in public child care. Parent cooperatives are still the most common 43form of private preschools (44 per cent), but there are also preschools run by companies (22 per cent), employee cooperatives and other organisations. However, if looking at the proportion of children in different forms of preschools, slightly more children were found in company preschools than parental cooperatives in 2005. Privately run leisure-time centres are less common. Fifteen per cent of the leisure-time centres are privately run and 9 per cent of the children attend them (Skolverket 2006, Table 1.15 A).
A step towards universalism in child care was taken in July 2001 when the municipalities were obliged to offer child care to children of unemployed parents for at least 15 hours per week. This obligation was extended to include children of parents on parental leave with another child, starting January 1, 2002. In addition, preschool activities for four and five year olds were introduced on January 1, 2003, consisting of 15 hours of child care per week free of charge.
The supply of public child care
Today almost all children aged one to 12, have the right to public child care. This, however, does not necessarily mean that the supply is large enough to meet the demand. Legislation has to be accompanied by resources to make expansion possible. As demonstrated in Figure 2.1, the supply of child care has hardly ever matched demand, so not all employed or studying parents, who were entitled to public child care, have had access to the child care they needed. Waiting lists have been long and parents have had to make their own childcare arrangements in the informal sector (Nyberg 2000).
More rigorous legislation coupled with a mini baby boom around 1990 resulted in a substantial increase in the demand for public child care. In spite of the economic crisis, the number of places for children in public child care increased dramatically. Figure 2.2 shows the change in the proportion of children attending public child care in different age groups. As can be seen, the proportion of 2, 3, 4 and 5 year olds increased from 55–65 per cent in 1990 to 89–97 per cent in 2005. Hardly any children below the age of one are in public child care since they are at home with a parent on parental leave. This is also true for a large proportion of 44the one year olds since parental leave is longer than 12 months, and can be spread out over a longer period of time.
Figure 2.2 Proportion of children aged 1–5 years in public child care (preschool and family day care homes), 1990–2005
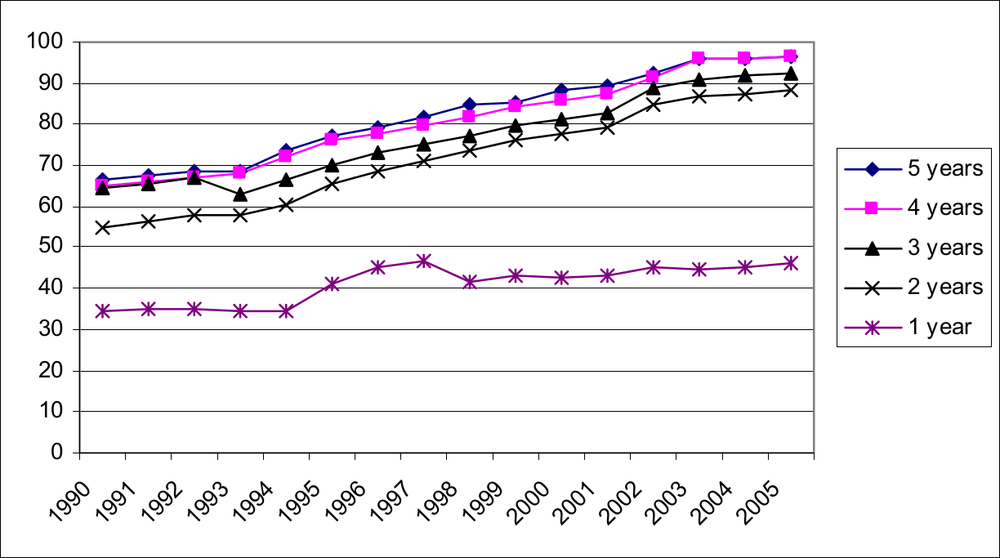
Source: 1990–1993 calculated from data on the number of children enrolled and the number of children in each age group in Statistisk årsbok; 1994–1999 calculated from Skolverket 2000a Table 1.4 B and Table 1.10 B; 2000–2005 calculated from Skolverket 2006a Table 1:4 and Table 1.11 B.
A very large proportion of six year olds (not seen in the diagram) were in public child care in 1990. However, during the 1990s, activities for six year olds were integrated into school activities. The preschool class has become a kind of school of its own and virtually all six year olds today are in preschool classes and leisure-time centres. Since 1991 children have been able to start school at the age of six, but few children do so – around 4 per cent in 2000 (Skolverket 2000c, p. 22).
Towards the end of the 1990s, the demand for public child care for children of working or studying parents was more or less met, but there was still an unmet demand. As already mentioned, at the beginning of the 2000s, the right to child care was extended to cover the children of unemployed parents, the children of parents 45on parental leave and all four and five year olds for at least 15 hours a week. Of children aged between one and five with a parent on parental leave 29 per cent were in preschool in 1999, by 2005 this figure had doubled to 59 per cent (Skolverket 2006b, p. 2). A relatively large share of the children of unemployed parents went to preschool even before the change in legislation in 2001. The municipalities’ rules were considerably more generous for these children than for children of parents on parental leave. But unemployed parents have also exercised their new right to a place for their children in preschool. In 1999, 58 per cent of all children between one and five years of age of unemployed parents went to preschool; in 2005 the proportion was 81 per cent.
The municipalities are also obliged to provide a place in public child care for school-aged children without unreasonable delay. This is the case until the child is 12 years old if the parents are working or studying or if the child has a special need. Care is offered before and after the school day and during vacation time. Leisure-time centres are today often in or close to school buildings, which means that parents do not have to arrange transport for the children between the school and the leisure-time centre (Knijn et al. 2005).
The number of children in leisure-time centres has increased considerably since the beginning of the 1990s (see Figure 2.3). The proportion of 7 and 8 year olds has increased from 55 and 61 per cent to 83 and 79 per cent respectively and among the 9 year olds from 38 to 66 per cent. Older children are seldom found in public child care. Also the municipalities have started to accept school children with parents on parental leave and unemployed parents. Many children also have parents who are on long term sick leave (Skolverket 2005c, p. 29).
In the 1970s and 1980s child care usage was influenced by the educational level, ethnicity and civil status of parents: the higher the educational level of parents, the more common it was for their child to be in preschool. Children of parents born outside Sweden and children of cohabiting parents were less likely to be in preschool than children of Swedish parents and single parents. While these differences have now almost disappeared and almost all children are in preschool, some differences still exist. Children of parents with a university education spend about three hours more 46per week in child care than children whose parents only have a nine-year compulsory school education and they are also more often in child care run by parental cooperatives. Children of parents with lower education are more often found in family day care than children of parents with higher education (Skolverket 2000b).
Figure 2.3 Proportion of children 7–12 years in public child care (leisure-time centres and family day care homes), 1994–2005.
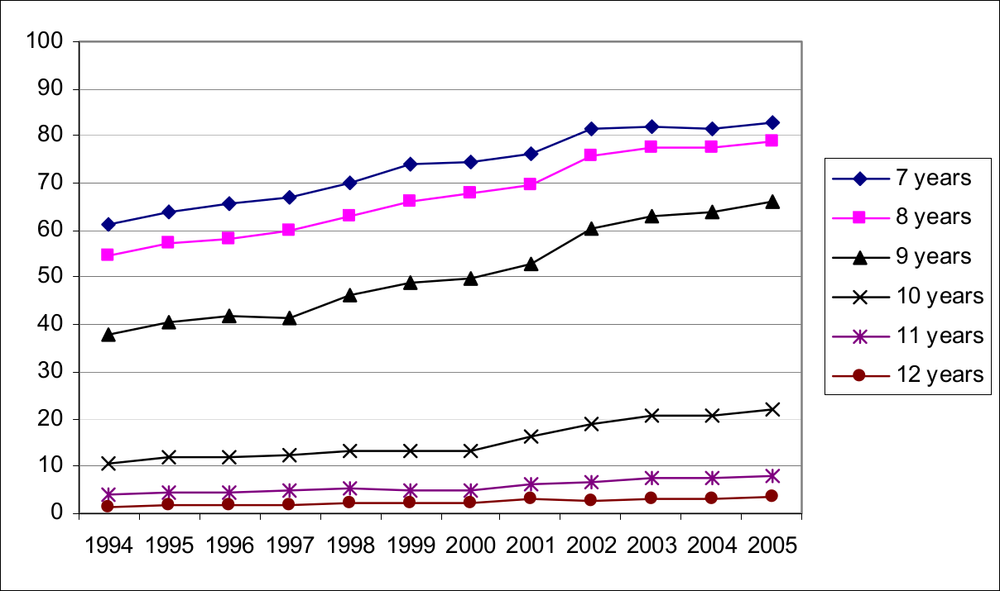
Source: 1994–1999 calculated from Skolverket 2000a Table 1.10 B and Table 1.14 B; 2000–2005 Skolverket 2006a calculated from Table 1.11 B and Table 1.15 B.
Since not all children 7–12 years of age are in public child care, the differences are bigger among children in leisure-time centres. It is much more common that the child is in a leisure-time centre when the parents have higher education and both are born in Sweden, than if the parents have a lower educational level and the parents are immigrants. School children not in public child care are either at home by themselves or together with a parent (Skolverket 2005c, p. 30).
In a study conducted in 2005, parents were asked if they were satisfied with their childcare situation. Ninety three per cent of the parents with children 1–5 years of age were satisfied and 7 per cent 47were not satisfied with their child care. Of those not satisfied around half (3–4 per cent) said they would rather their child be in preschool, and around one fourth (1–2 per cent) reported they would rather stay home with the child (Skolverket 2006b, p. 36). The result was similar for parents of children in leisure-time centres. Very few children are permanently at home with an ‘athome parent’ – only about 2 per cent.
Given the economic downturn of the early 1990s and the cost cutting and retrenchments that marked the Swedish labour market at that time, we might have expected to see a decline in the supply of public child care. However, as shown above, the proportion of children in preschool and in leisure-time centres grew during the 1990s. This leads us to ask what happened to accessibility, quality and parent’s fees in child care.
Accessibility
One aspect of accessibility is how long it takes before a child can get a place in public child care. Since 1995, the municipalities have been obliged to supply a place in child care ‘without unreasonable delay’, meaning within three to four months. The first year after the legislation 80 per cent of the municipalities could offer a place within that time frame, the corresponding figure in 2005 was 98 per cent. This is the case both in preschools and in leisure-time centres (Skolverket 2005a, pp. 9, 26).
Another aspect is opening hours. To facilitate parents’ working life, child care should offer a continuous service covering the whole working day and continuing beyond usual working hours in order to give parents time to get to the childcare centre. Shorter opening hours could force parents to work shorter hours or find informal solutions to complement formal child care. I have only been able to find data on opening hours for three years: 1996–1998 (Skolverket 1999a, Table 1.6). The report shows that a very large proportion of preschools (around 90 per cent) are open 10–12 hours per day. However, it also shows that this share decreased between 1996 and 1998 and that privately run preschools had shorter opening hours than those run by the municipalities. In 2003, 52 per cent of municipalities could also offer night-open childcare centres to the children of parents who work nights (Skolverket 2003b, p. 1). 48A large proportion of the other municipalities maintain that there is no demand for child care at night.
In 2005, children aged between one and five with employed or studying parents spent on average 32 hours per week in child care, which was the same as in 1999. In the leisure-time centres the children spent 17 hours a week there in 1999 and only 13 hours in 2005. Why the time in the leisure-time centres has become shorter is unknown (Skolverket 2006b, p. 3).
Quality in child care
Measuring the quality of child care is no easy task and there is no general agreement as to how this should be done. However, one possible way is by measuring the resources spent on child care on a per full-time child basis. Measured in this way, the cost per child in preschools decreased dramatically in the early 1990s, but then rose again during the latter part of the decade, and since 2002 has been above the 1991 level (Skolverket 2003c, Figure 1 and Figure 3; Skolverket 2005a, p. 29). As far as leisure-time centres are concerned, I have not been able to follow the development of the costs as far back as 1990. However, the cost per child was about the same between 1995 and 2001 (Skolverket 2003c, Figure 4).
Changes in the funding per child in preschools are also reflected in the child/staff ratio, with a decrease in the funding being reflected in an increase in the number of children per staff. However, while the funding per child now exceeds the 1991 level, this is not reflected in the child/staff ratio. If the child/staff ratio is used as an indicator of quality in preschools, then quality has deteriorated. In 1990 there were 4.2 children per full-time worker and in 2005 the corresponding number was 5.2 (see Table 2.1). The situation has deteriorated more in the leisure-time centres. In 1990 there were 8.3 children per staff, the number had more than doubled to 18.6 children by 2005.
Group size is another indicator of resources and quality. The average number of children per group also increased: in preschools from on average less than 14 children in 1990 to 17 in 2005. In the leisure-time centres the average number of children grew from less than 18 to almost 31 during the same period.49
Another dimension of quality is the educational level of childcare staff: a higher level of education is usually taken to mean higher quality, but it also implies higher costs. Up until 1990 childminders made up the largest group of employees in preschools, but today university-trained preschool teachers form the biggest category in the municipality run preschools – 51 per cent in 2005, although in recent years the average educational level has decreased somewhat. In the leisure-time centres, the educational level is higher. In 1990 more than half of the leisure-time centre staff had a pedagogical university education. This proportion increased into the mid-1990s, but has since declined considerably. One reason for this might be the problem of finding employees with a suitable university education. Another might actually be the rise in the proportion of privately run preschools and leisure-centres. The educational level is lower here and also the number of children per staff and groups size is higher in privately run child care than in municipality run places. Parents seem to choose a preschool primarily because it is close to where the child lives, except for parental cooperatives, which the parents choose primarily because they want to have their child in a preschool run by parents (Bergqvist & Nyberg 2001, Table 6).
Parents’ fees
One way for municipalities to handle the financial situation in the 1990s was to try to keep costs down by increasing the number of children per staff member and group; another was to increase revenues by raising childcare fees. More and more municipalities also tied the size of the fee to the parents’ income: 75 per cent of municipalities at the beginning of the 1990s and 90 per cent towards the end of the decade. In 1990 parents paid 10 per cent of the total gross costs of child care. By 2000 this proportion had increased to 19 per cent, that is, parents were paying a larger share of the costs. However, in 2002 a maximum childcare fee was introduced by the central government. This meant that a ceiling was set on the fees payable by parents for child care. One important reason for this was to level out the considerable differences in childcare fees between different municipalities; another was to lower the level of the fees and a third was to eliminate the marginal effects of childcare fees on parents’ (mothers’) income.50
Table 2.1 Number of children per full-time staff and per group and the share of staff with a pedagogical university education, 1990–2005
| No. of children per staff | No. of children per group | Share of staff with university education | ||||
| Preschool | Leisure-time centres | Preschool | Leisure-time centres | Preschool | Leisure-time centres | |
| 1990 | 4.2 | 8.3 | 13.8 | 17.8 | ? | 52.0 |
| 1995 | 5.5 | 11.5 | 16.7 | 23.7 | 54.0 | 67.6 |
| 2000 | 5.4 | 17.5 | 17.5* | 29.4** | 54.3 | 60.8 |
| 2005 | 5.2 | 18.6 | 17 | 30.6 | 51.4 | 59.2 |
* 2001, ** 1998
Source: Column 2 – 1990 Skolverket 2003c p. 24, 1995 Skolverket 2000a Table 1.7 A, 2000 and 2005 Skolverket 2006a Table 1.8 A. Column 3 – 1990 Skolverket 1999b p. 10, 1995 Skolverket 2000a Table 1.15 A, 2000 and 2005 Table 1.16 A; Column 4 – 1990 and 1995 Skolverket 2005b p. 23, 2000 Skolverket 2005b Table 7, 2005 Skolverket 2006a Table 1.4 A; Column 5 – 1990 Skolverket 1999b p. 10, 1995 Skolverket 2005b Table 7, 2005 Skolverket 2006a Table 1.15 A; Column 6 – 1995 Skolverket 2000a Table 1.7 B, 2000 and 2005 Skolverket 2006a Table 1.8 A; Column 7 1990 Skolverket 1999b p. 10, 1995 Skolverket 2000a Table 1.15 A, 2000 and 2005 Skolverket 2006A Table 1.16 A
For the municipalities, the introduction of the maximum fee was voluntary. The municipalities that adopted the new system received compensation from the state for loss of income and to ensure childcare quality. In the first year, the maximum fee was implemented by all but two of the 289 municipalities. Today all municipalities apply the maximum fee.
The maximum fee means that the fee in the preschool cannot exceed 3 per cent of the household’s taxable income for the first child, 2 per cent for the second child, 1 percent for the third child and nothing for the fourth. There is also an absolute ceiling for the 51fee. In Table 2.2 the fees in 2005 in preschools and leisure-time centres are shown.
Table 2.2 Fees per month in publicly financed child care (preschools, leisure-time centres, family-day-care homes), 2005
| Per cent of taxable income | Maximum fee SEK/AUD | |||
| Preschool | Leisure-time centres | Preschool | Leisure-time centres | |
| Child 1 | 3% | 2% | 1260/223 | 840/149 |
| Child 2 | 2% | 1% | 849/149 | 420/74 |
| Child 3 | 1% | 1% | 420/74 | 420/74 |
| Child 4 | No fee | No fee | ||
Source: IFAU 2006 p. 9
Almost 60 per cent of the municipalities have a fee system without any intervals at all, while one quarter have two time intervals, one full-time and one part-time. After the introduction of the maximum fee, almost all families pay lower fees and in 2004 parents paid 8 per cent of the total cost for public child care (Skolverket 2005b, p. 29).
Conclusion
A combination of growing employment among mothers, a strong demand from the feminist movement and a relatively large number of women among politicians contributed to the positive reception and support of the demand for publicly financed child care by the government in the 1960s and 1970s. Strong arguments at that time revolved around gender equality and the right for all adults, including mothers, to support themselves.
The 1990s was a critical period for the Swedish welfare model as unemployment increased, budget deficits grew and neo-liberal ideas began to gain influence. In spite of these changes Swedish legislation gave more children the right to a place in publicly financed child care. By 2005 the children of employed and studying parents, children with special needs, children with unemployed 52parents, children of parents on parental leave, and all four and five year olds were eligible for public child care. Since the 1990s child care, in terms of preschools, has became more or less a universal right in Sweden. This is reflected in attendance statistics with both the number and proportion of children in public child care increasing steadily. The proportion of two to five year olds increased from 55–65 per cent in 1990 to 89–97 per cent in 2005. Also the share of children in leisure-time centres expanded. Parental fees have decreased as a result of the introduction of a maximum fee and parents seem to be satisfied with child care. There has, however, been a decline in the quality of child care since 1990 reflected in the number of children per full-time worker and group size increasing – especially in leisure-time centres. Since the 1990s then, there has been a shift from problems of a shortage in quantity to problems in quality.
Child care has become more diversified in that more children today are found in privately run centres. However, it seems as if the quality in terms of average number of children per staff, group size and the level of the employees’ education are lower in privately run child care than in municipality run, probably with the exception of parental cooperatives. Diversity in the way preschools are run has probably increased also among municipality preschools.
The continued expansion of publicly financed child care can be explained by the fact that political commitment to child care has objectives other than furthering women’s employment and gender equality, and that the emphasis on the importance of different objectives has changed over time. One important objective of public child care since the 1990s has been the promotion of equality in children’s opportunities. This mirrors an increased focus on support for children’s development, the education of children and life-long learning. Preschool has become the first step in the education system as a growing number of children have been included in the system which is now seen as an important part of a ‘normal’ childhood. The terminology has changed from nursery/day care to preschool. In 1996 the responsibility for public child care was transferred from the Ministry of Social Affairs and Health to the Ministry of Education and Science and a special curriculum has been developed for children one to five years of age.53
The introduction of the maximum fee is another example of the shift in the public perception of the role of early childhood education and care. Public child care for all children is no longer seen mainly as a question of women’s employment but as a necessary investment in human capital in a post-industrial, knowledge-intensive economy. As such, it is important that all children are given the opportunity to use these services since they further equality, not only between the sexes, but also between children of different classes, ethnicities, etc. Child care is today, to a greater degree, seen as education and as children’s right rather than as women’s (parents’) right.
54
References
AKU, Arbetskraftsundersökningarna (Labour Force Surveys), 1990, 1993, 1997 & 2004, SCB, Stockholm.
Bergqvist, C 2001, ‘Jämställdhetspolitiska idéer och strategier’, Arbetsmarknad & Arbetsliv, vol.7 no.1, 15–29.
Bergqvist, C, Borchorst, A, Christensen, A-D, Ramstedt-Sile, V, Raaum, N & Styrkarsdottir, A (eds) 1999, Equal democracies: gender and politics in the Nordic countries, Oslo University Press, Oslo.
Bergqvist, C & Nyberg, A 2001, ‘Den svenska barnomsorgsmodellen – kontinuitet och förändring under 1990-talet’, in Marta Szebehely (ed.), Välfärdstjänster i omvandling, SOU 2001:52, Fritzes, Stockholm.
Bergqvist, C & Nyberg, A 2002, ‘Welfare state restructuring and child care in Sweden’, in S Michel & R Mahon (eds), Child care policy at the crossroads. Gender and welfare state restructuring, Routledge, New York.
Elgán, E (ed.) 2001, Kvinorörelsen och ’68: aspekter och vittnesbörd, Samtidshistoriska institutet, Södertörns högskola, Huddinge.
IFAU 2006, Påverkar maxtaxan inom barnomsorgen hur mycket föräldrar arbetar?, Rapport 2006:2, Institutet för arbetsmarknadspolitisk utvärdering, Uppsala.
Knijn, T, Jönsson, I & Klammer, U, Gerhard, U 2005, ‘Care packages: The organisation of work and care by working mothers’, in U Gerhard, T Knijn & A Weckwert (eds), Working mothers in Europe. A comparison of policies and practices, Edward Elgar, Cheltenham.55
Löfström, Å 2004, Den könsuppdelade arbetsmarknaden, SOU 2004, Fritzes, Stockholm, pp. 43.
Nyberg, A 1995, ‘Barnomsorgen. Ett kvinnligt nollsummespel eller?,’ (Childcare. A female zero-sum game) in E Amnå (ed.), Medmänsklighet att hyra?, Bokförlaget Libris, Örebro, pp. 47–82.
Nyberg, A 2000, ‘From foster mothers to child care centers: a history of working mothers and child care in Sweden’, Feminist Economics 1, vol. 6, no. 1, pp. 5–20.
Nyberg, A 2004, Parental insurance and childcare in Sweden, www.peerreview-employment.org, peer review programme of the European Employment Strategy, European Commission, DG Employment and Social Affairs.
Sainsbury, D 1996, Gender, equality and welfare states, Cambridge University Press, Cambridge.
Sainsbury, D 1999, ‘Gender and social-democratic welfare states’, in D Sainsbury (ed.) Gender and welfare state regimes, Oxford University Press, Oxford.
Skolverket 1998, Beskrivande data om baromsorg och skola 98, Skolverkets rapport nr 157, Skolverket, Stockholm.
Skolverket 1999a, Barnomsorg och skola i siffror 1999: Del 2 – Barn, personal, elever och lärare, Skolverkets rapport nr 167, Skolverket, Stockholm.
Skolverket 1999b, Finns fritids? En utvärdering av kvalitet i fritidshem, Skolverket, Stockholm.
Skolverket 2000a, Barnomsorg och skola i siffror 2000: Del 2 – Barn, personal, elever och lärare, Skolverkets rapport nr 185, Skolverket, Stockholm.
Skolverket 2000b, Tillgång och efterfrågan på barnomsorg. Enkät till föräldrar med barn i åldern 1–12 år, Skolverket, Stockholm.56
Skolverket 2000c, Förskoleklass – 6-åringaras skolform? Integration förskoleklass – grundskola – fritidshem, Skolverket, Stockholm.
Skolverket 2003a, Beskrivande data om barnomsorg, skola och vuxenutbildning 2003, Organisation, resurser, resultat, Skolverkets rapport 236, Skolverket, Stockholm.
Skolverket 2003b, Barnomsorg på obekväm arbetstid, Skolverket, Stockholm.
Skolverket 2003c, Gruppstorlekar och personaltäthet i förskola, förskoleklass och fritidshem, Skolverket, Stockholm.
Skolverket 2005a, Plats utan oskäligt dröjsmål? Uppföljning av tillgängligheten till förskoleverksamhet och skolbarnomsorg 2005, Rapport 267, Skolverket, Stockholm.
Skolverket 2005b, Beskrivande data om förskoleverksamhet, skolbarnsomsorg, skola och vuxenutbildning, rapport 265, Skolverket, Stockholm.
Skolverket 2005c, Skolverkets lägesbedömning 2005. Rapport till regeringen, Skolverket, Stockholm.
Skolverket 2006a, Barn, elever och personal – Riksnivå, Del 2. 2006, Skolverket, Stockholm.
Skolverket 2006b, Uppföljning av reformen maxtaxa och allmän förskola mm, Skolverket, Stockholm.
SOU 2000:3, Välfärd vid vägskäl. Utvecklingen under 1990-talet, Fritzes, Stockholm.
Statistisk årsbok (Statistical yearbook) 1991–1994, http://www.goteborg.se/statistiskarsbok
1 The unemployment rate (16–64 years) was 1.6 per cent in 1990, 8.2 in 1993, 8.0 in 1997 and 5.3 in 2004. The employment rate was 83 per cent in 1990, 73 in 1993, 71 in 1997 and 76 in 2004. The differences between women and men are rather small (AKU).
2 In 1990 the central government budget showed a surplus of almost 19 billion SEK. In 1993 the deficit amounted to almost 210 billion and in 1994 close to 200 billions SEK. In 1998 there was again a surplus. This time of slightly more than 20 billions SEK (SOU 2000:3, p. 40).
3 Skolverket is the National Agency for Education.