Chapter 9
SUSTAINABLE TRANSPORT PLANNING: ASSESSING TRANSIT ORIENTED DEVELOPMENT IN NORTH-WEST SYDNEY
The main aim of this chapter is to design a generic planning and assessment framework in economic perspectives to gauge the sustainability of Transit Oriented Development (TOD) around bus corridors in North West sector of Sydney – a case study of Sunnyholt Road in the city of Blacktown. It further elaborates the potential for increased development in the vicinity of Sunnyholt Road that could be associated with the Parramatta-Rouse Hill-Blacktown Transit Way (T-Way) which is currently under construction. In order to gauge the sustainability of TOD, indicators in six categories should be analysed, which are: institutional performance indicator, quality of the built environment and accessibility indicator, economic performance indicator, environmental performance indicator, social diversity and public perception indicator, and travel behaviour indicator. This chapter focuses only on the economic performance indicators.
Sustainable goals and TOD definition
The concept of Transit Oriented Development emerged relatively recently. Originating in US planning theory, it has at times struggled for understanding amongst the development industry and public sector. Dittmar and Ohland (2004) provide a range of late 20th century American TOD case studies, including major projects in Arlington Virginia, Dallas Texas, Atlanta Georgia and San Jose and San Diego, California. The principles for successful TOD precincts can, however, also be observed in the transit-rich city centres of Western and Central Europe. The integrated land and transport planning that has been pursued post-World War II in Europe provides clear lessons for current attempts to establish something similar in the new world context (Hale and Charles, 2007). 196
Figure 55: Transit oriented development definitions
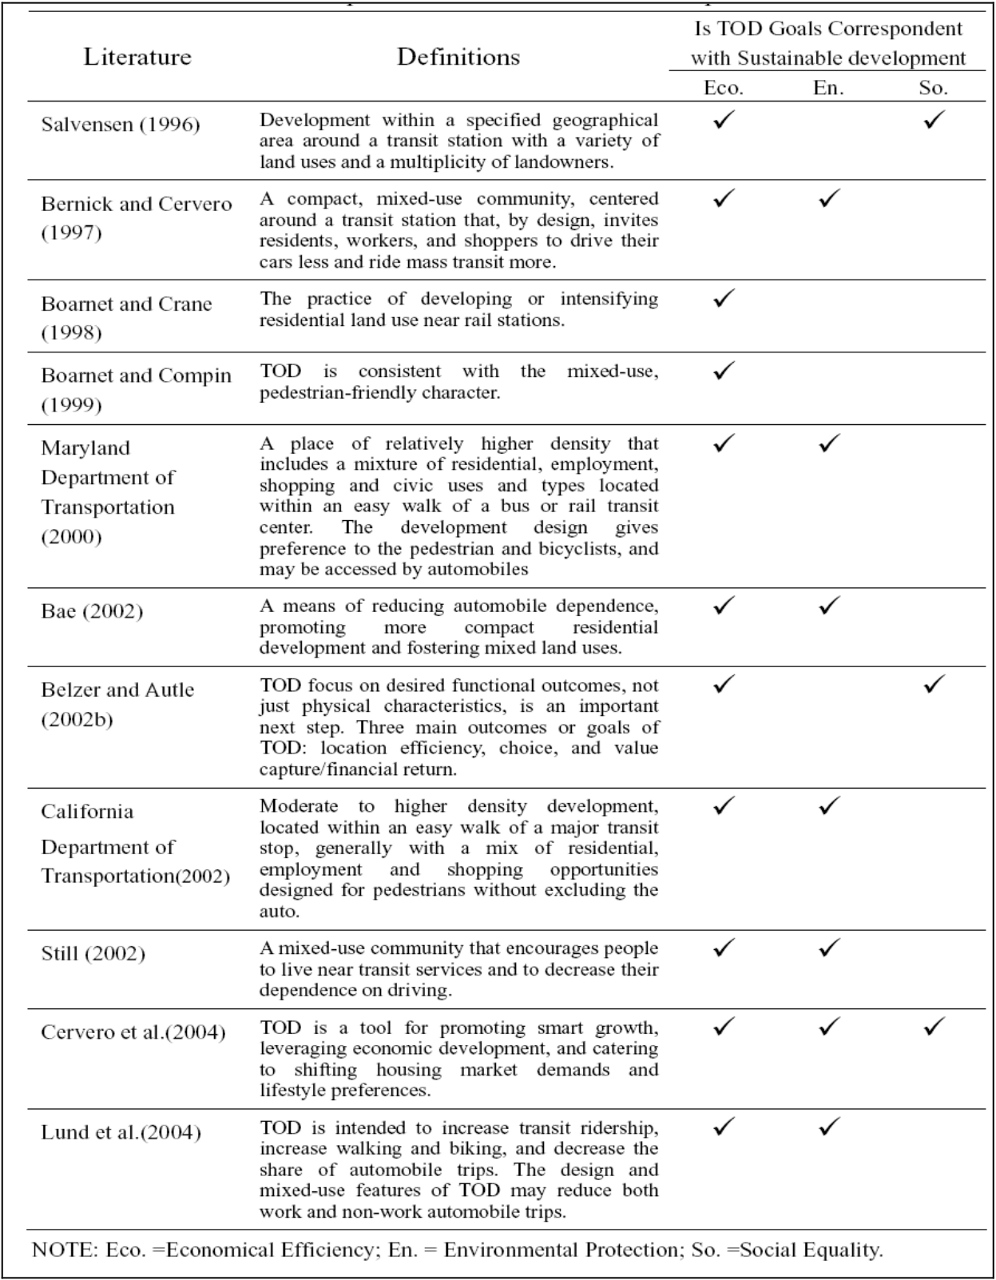
Source: Li, C. and Lai, T. (2006) 197
Transit oriented development has been defined as a set of urban design and land use characteristics conducive to generating journeys undertaken other than by car (Calthorpe, 1993). Various terms have surfaced over the years to convey the idea of TOD, such as ‘transit villages’, ‘transit-supportive development’ and ‘transit-friendly design’. Some authors use the term TOD quite liberally, referring to any form of ‘transport-oriented development,’ including bus- and rail-oriented development as well as development along freeways (Lefaver, 1997). While there is no single, all-encompassing definition that represents the TOD concept in its many forms, most definitions of TOD nonetheless share common traits. Figure 55 highlights definitions of TOD used by researchers.
While such definitions vary in scope and specificity, most TOD definitions share several common elements including: density (raising, density within 400mm to 500m of transit stations; diversity (mixed land use, extensive choices of housing and commuting); and design (pedestrian or friendly oriented design). It is also known as 3Ds, referring to density, diversity and design, as shown in Figure 56. Strategies of 3Ds are intended to increase transit ridership, increase walking and biking, and decrease the share of automobile trips. The design and mixed-use features of TOD may reduce both work and non-work automobile trips. Furthermore, these potential benefits can help amortise multi-billion dollar investments in rail transit infrastructure. TOD strategies are based on a theory that land uses near a rail transit stop will produce a different travel pattern than land uses in an automobile focussed area. The best way to ensure that TOD can help solve urban challenges is to provide solid analytic evidence about its effectiveness (Lund et al., 2004). In other words, wide and varied benefits of TOD contain economical, environmental and social effectiveness. Thus, it can be seen that strategies of TOD are able to achieve goals of smart growth and sustainable development.
The main goals of TOD are also to carry out dreams that our cities and countries are smart and sustainable. Cervero et al. (2004) defined it as a means of promoting smart growth, injecting vitality into declining inner-city settings, and expanding lifestyle choices. Basically, there are three key components in sustainable goals of TOD. Firstly, environmental protection means that TOD will restrain land development from environmentally sensitive areas and guide it to corridors and stations of 198transit in order to protect the ecological environment. Secondly, economic efficiency means that high density and mixed development of land use around transit stations and corridors will raise transit ridership, promote economic development and improve location efficiency. Thirdly, social equality means that TOD will offer affordable housing with diverse types and more choices of transportation modes to keep social justice. Finally, the comprehensive and ultimate goals of TOD are sustainable development, as shown in Figure 56.
Figure 56: Achieving urban sustainability
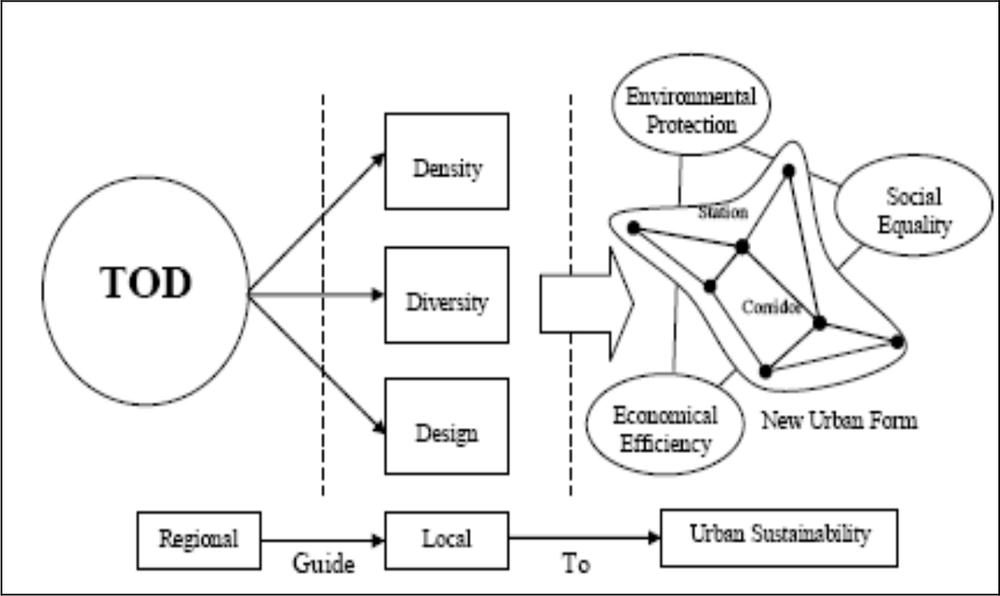
Source: Cervero et al. 2004
Bus corridor TOD
Calthorpe (1993) identified both an ‘urban TOD’ associated with rail stations and a ‘neighbourhood TOD’ associated with bus. Dittmar and Ohland (2004) suggest a hierarchy of transit modes related to a hierarchy of TOD types. While bus services are provided at every level, rail is more closely related to high-density/large-scale development and bus with low density/small-scale development. This is repeated in much of the literature. The term ‘transit oriented development’ (i.e., associating low density with bus) has also been associated with this. Cervero et al. 199(2004) identified consistently lower density expectations for bus than light rail in San Diego, Portland, and Washington Country, Oregon.
The collocation of bus services and bus terminals at some major rail stations has been suggested as a potential spur for TOD (Porter, 1997). Bus Transit Oriented Development was also commonly associated with bus stations in cities without rails. Bus Transit Oriented Development (BTOD) is more commonly associated with bus ways or Bus Rapid Transit (BRT). The ability of large scale bus transit systems to encourage land development has been identified as a major benefit of these forms of transit technology (Levinson et al., 2003).
The Ottawa transit system is a major icon of BTOD. Ottawa’s policy of combining integration of land use and transport planning with an emphasis on transit development over road construction is to be admired regardless of transit modes involved. Nevertheless, it was a bus way that achieved densification of development around bus way stations. Curitiba and Bogota are the other major icons of both BRT and associated BTOD (Bonsall, 1997). Evidence of development benefits of these systems has been identified (Rodriguez and Targa, 2004; Smith and Raemaekers, 1998).
Successful bus based transit systems such as Ottawa’s, Curitiba’s, Brisbane’s, and Adelaide’s all offer train-like trunk services on reserved corridors, along with buses that operate as feeder services in local communities, then join the transit corridor for express travel to a limited number of major stops. It all represents the ‘state-of-art’ in bus way design, infrastructure, and operations management. Guided bus way systems such as in Adelaide provide a high quality service, but the most noticeable aspect is the minimum space required for the guideways. This high capacity infrastructure has a cross-section of just 6.2m between outer edges of guideways (Adam, 2004).
It is appropriate here to compare conventional bus with its rail counterpart. Figure 57 compares the positive and negative aspects of both modes. While bus offers flexibility in routing and is cost effective, its routing tends to be complex and it has a poor public image. Rail, while considered inflexible, benefits from a positive public image, is seen as easy to understand and is permanent. 200
Figure 57: Comparison of conventional bus and rail attributes
| Bus | Rail | |
| Pros | Flexible Cost-effective Accessibility |
Simple Permanent Positive image |
| Cons | Complex Lacks permanence Poor image |
Lacks flexibility Costly Poor accessibility |
Planning and assessment framework
Any study of TOD must recognise the context of government policies and programs, and also the government’s goals for bus transport development and land uses associated with it. Integrated land use and transport developments should contribute towards a more sustainable city and monitoring of the key performance indicators as mentioned above. In any practical application of this approach, the end product is an outcomes report to the government (See Figure 58). Among the six indicators, only economic indicators are analysed in this chapter.
Transit Oriented Development is increasingly becoming a solution across Australia and overseas for encouraging more sustainable cities and extracting maximum value from public transport investment. TOD facilitates higher-density, mixed-use development well designed to encourage walking, bicycling, and public transport use within a ten-minute walk of major public transport nodes. TOD integrates land use with transport – a key objective of the NSW State Government’s Transport Planning and Metropolitan Strategy. Research in the past has shown that TODs have potential to create safer pedestrian environments, reduce private vehicle dependency, and create more vibrant communities.
In Australia, TOD-type examples have emerged almost ‘by accident’. Revitalisation of historical inner-city areas as locations of choice for residences and offices has occurred, largely due to transit advantages and the attractiveness of pre-car development patterns. Increasingly, low-density outer suburbs, poorly served by transit, are recognised as 201locations of economic vulnerability (Dodson et al., 2006), and lack of lifestyle and cultural choice. From the supporting components in evidence in European cities, and in many other locations throughout Australia and the world, common ‘success factors’ emerge for TOD locations. These success factors should be studied and replicated wherever TOD is attempted or where urban renewal is pursued (Hale and Charles, 2007). They are: (a) high frequency, high capacity public transit linking the precinct to the wider metropolitan area and providing good access. The Transit should be integrated sympathetically with the precinct; 202(b) mixed-use development with street-front retail. Longer opening hours are an indicator of success. Offices and workplaces provide a support base of customers. Residential accommodation provides additional patrons who hold a stake in the liveability of the precinct. The development needs to be competitive and viable in the open property market; and (c) public space provision that, while generous, is never too large that the space becomes empty and loses its lively character. Cafés and restaurants should intermingle with public space. Up-market design is required for public space, incorporating climate compatibility, quality hard-scaping and considerate planting.
Figure 58: Transit oriented development outcome analysis
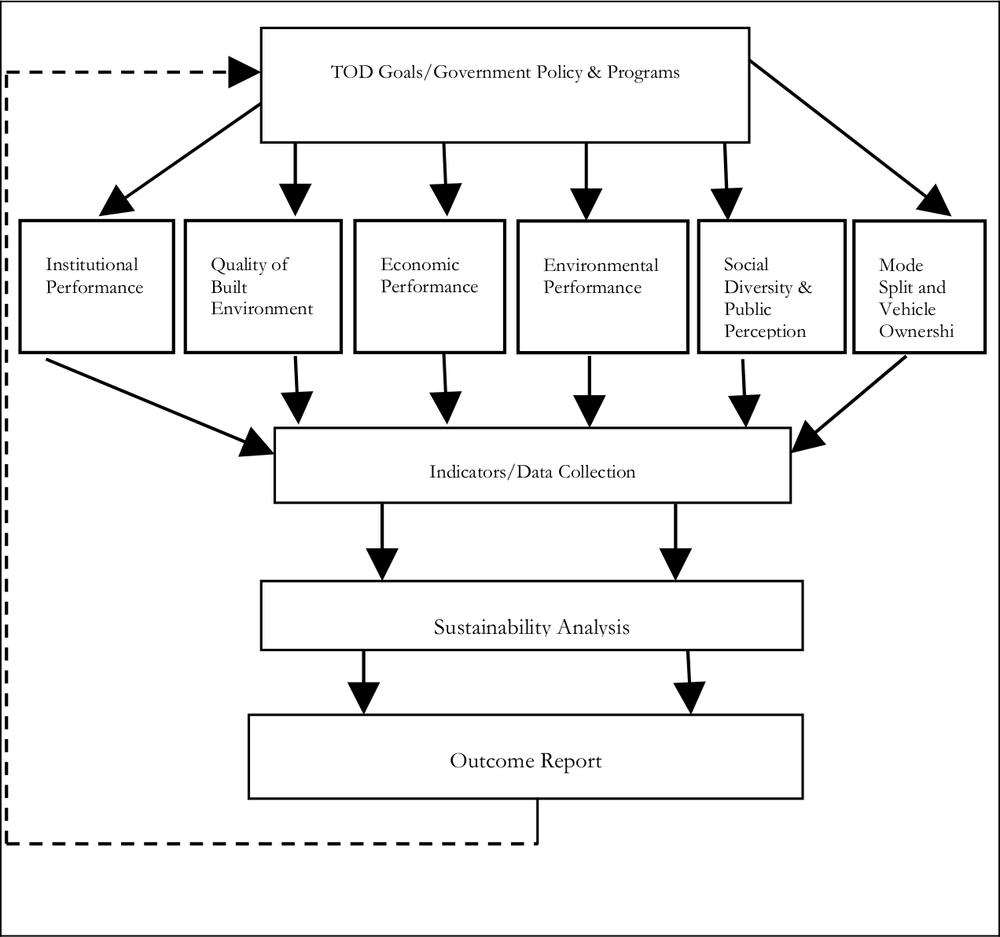
Source: Renne (2005)
NSW Government programs
In 1998, the NSW Minister for Roads and Minister for Transport released a strategic transport plan for New South Wales, ‘Action for Transport 2010’. It placed a special focus on Western Sydney where rapid growth in population and commercial activity demanded new and improved public transport investment. A network of dedicated bus transit way corridors was proposed in this document to create direct public transport connections across the West, Southwest and Northeast of Sydney. As the first and second stages of this program, the Liverpool-Parramatta Transit way is now operational, and the North-West Transit Way network is currently under construction.
The NSW Government is making a substantial investment in road-based public transport through the Transit Way network, Strategic Bus Corridors (for example, the recently announced Hurstville corridor), and bus service reform initiatives. In order to ensure the success of these initiatives, this investment needs to be matched by complementary land use and urban form initiatives. A TOD-related Urban Change Strategy and limited site investigations have already been carried out along the Liverpool–Parramatta T-way by the Roads and Traffic Authority (RTA) and other agencies. TOD can also be viewed as a pragmatic approach to implementing the State Government’s Integrating Land Use and Transport Policy, Sydney Regional Environmental Plan No 18 – Public Transport Corridors, and initiatives contained in the Metropolitan Strategy. In terms of broader government objectives, the application of TOD aims to slow the rate of land consumption on the urban fringe, minimise vehicle kilometres travelled and assist in meeting air quality 203targets – all key government transport objectives. Successful TOD projects depend upon a strong partnership between local and state government and a commitment to working closely with private developers and local communities towards practical solutions to constraints and eventually implementation.
Figure 59: Transit oriented development indicators
| Indicator | Measure |
| Range of businesses | Number of retail, commercial and industrial firms (possibly on GIS) |
| Suitability of local retail for residents (Index of Retail Variation) | |
| Business Success | Rate/number of vacant buildings/units (retail, commercial, industrial) |
| Number of jobs in area (by categories, full-time/part-time) | |
| Number of people in home-based employment | |
| Range of Housing | Number of residential units (houses/flats/apartments) |
| Number of rental and owner-occupied residences | |
| Number of affordable housing units (to be defined) Range of 1, 2 and 3+ bedroom | |
| Solid financial base | Property value (over time) |
| Percentage of income spent on housing and transport | |
| Rates collected by local government ($) |
Economic benefits of TOD
Figure 59 outlines an outcomes framework with the number of indicators which are desirable to analyse for any case study application of TOD along bus ways. It also classifies its benefits under different outcome headings. Its benefits under economic perspectives are analysed in more detail below.
A successful TOD is not merely a dormitory suburb, but is one where a wide range of businesses are thriving. A range of housing (both owner-occupied and rental) will be available, including affordable housing for 204lower income earners. For home owners, strong property values will ensure a solid financial base for future household prosperity as well as maintaining a healthy revenue stream for local government. Success against these aims could be measured using the following indicators.
Case study: Sunnyholt Road, Blacktown
Sunnyholt is located in the City of Blacktown, situated approximately 35 km west of Sydney CBD. It is defined by the M7 on the north, Richmond railway line to the west, the Western railway line to the south, and Johnston Avenue to the east. It covers the suburb of Kings Langley, Lalor Park and parts of Blacktown, Marayong and Seven Hills.
Figure 60: Map showing Blacktown study area
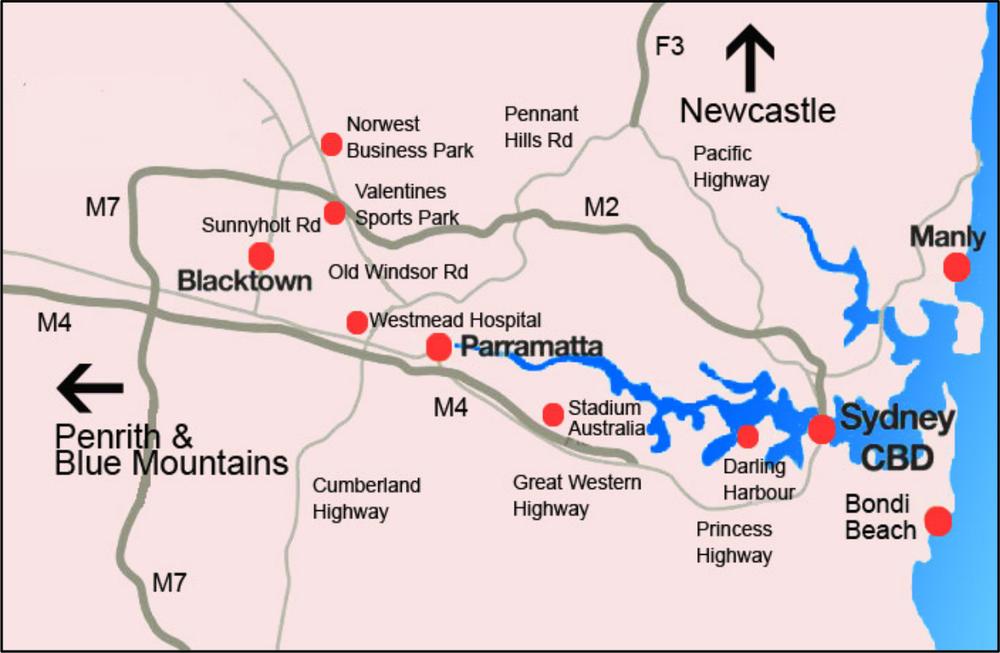
Source: Author
The two main motorways in the region are the M4 and the M7. Blacktown is connected with Sydney CBD both by the M4 via Prospect Highway and the M7 and the M2 via Sunnyholt Road. The Great Western Highway connects Blacktown CBD to Penrith on the west and 205Parramatta to the east via Reservoir Road, and Richmond Road connects the Blacktown CBD with Richmond. Sunnyholt Road is a major arterial road connecting Blacktown with the M7 and with Old Windsor Road.
The Western rail line connects Blacktown with Parramatta and Sydney to the east and with Penrith and Blue Mountains to the west. The Richmond line originates from Blacktown and connects to Richmond. The proposed North West Rail link will in some years time connect Rouse Hill to Epping via Northwest Business Park and Castle Hill. The proposed Northwest Transit Way will connect Parramatta to Rouse Hill and Blacktown along Old Windsor Road and Sunnyholt Road.
There is a wide range of job opportunities in the subregion, however few of these areas are readily accessible by public transport and the journey to work is mostly by car. Industrial areas near the study area are at Seven Hills, Baulkham Hills and Castle Hill. Major retail and business areas are located at Norwest Business Park and Castle Hill. There are small town centres at Kings Langley, Quakers Hill, Stanhope and markets at Parklea.
The topography of the Blacktown study area to the east of Sunnyholt Road is gently rolling; the streets are pleasant and there is reasonable street tree cover. It was largely developed after 1945 and the predominant building form is small cottages. In the earlier subdivisions, the street pattern is geometric, whereas areas developed later are characterised by a street system that respond to contours and contain cul-de-sacs.
A successful TOD in economic perspective possesses a wide range of retail opportunities for residents enabling them to meet their day-to-day needs from local establishments. Strong property values for home owners will ensure a solid financial base for future household prosperity as well as maintaining a healthy revenue stream for local government. Success against these aims could be measured using the subindicators detailed below:
Population and demographics
Blacktown has experienced considerable growth in recent years and it is anticipated that this will continue for some time. It is necessary to understand enough about the age and changing nature of the Blacktown population to anticipate the range of possible demand for medium or 206higher density housing over a long period. The population of Blacktown grew by 23,689 persons (10.2%) between 1996 and 2001, representing an annual growth rate of approximately 2%. The total population of the Sunnyholt study area (four suburbs combined) was 58,166 persons at the time of 2001 Census, representing around 22.8% of the total Blacktown LGA population (See Figure 61). In 2001, the most dominant age group in both Blacktown Local Government Area (LGA) and Sunnyholt area is represented by 0–14 age groups. But one interesting trend in the case of the Sunnyholt study area is its significant contribution to the ageing population. It has 11.7 % of the total population who are over 65 in the 2001 Census as against 7.6 % in Blacktown during the same period.
Figure 61: Population distribution: Blacktown and Sunnyholt, 2001
| Year | Blacktown LGA | Sunnyholt * | ||||
| Population | Projected population | Inter-period growth rate (%) | Population | Projected population | Interperiod growth rate (%) | |
| 1981 | 181,139 | |||||
| 1986 | 192,054 | 6.0 | ||||
| 1991 | 211,361 | 10.1 | ||||
| 1996 | 231,509 | 9.5 | ||||
| 2001 | 255,195 | 10.2 | 58,168 | 10.2 | ||
| 2005 | 283,536 | 11.1 | 64,102 | 11.1 | ||
| 2010 | 303,277 | 7.0 | 71,218 | 7.0 | ||
| 2015 | 322,338 | 6.3 | 76,203 | 6.3 | ||
| 2019 | 337,169 | 4.6 | 79,709 | 4.6 | ||
Source: Computed using ABS Census Data, 2001. * The study area comprises the suburbs such as Blacktown, Lalor Park, Kings Langley and Kings Park combined.
Of those reporting their weekly household income in 2001, there is no significant difference between Blacktown LGA and the Sunnyholt study 207area in the income bracket of A$0–A$299. Blacktown has less percentage of households in this category (i.e., 10.7%) as compared to 12.2% in the Sunnyholt area, whereas it is the opposite in the case of the higher income bracket of A$1500–A$1900. Blacktown LGA has 14.1% of the total population as against 13.4% in the Sunnyholt study area.
Figure 62: Job stocks by industry, 2001
| Employment Sector | Blacktown LGA | Sunnyholt | ||
| Number | % | Number | % | |
| Agriculture, forestry, fishing | 486 | 0.7 | 98 | 0.4 |
| Mining | 43 | 0.1 | 18 | 0.1 |
| Manufacturing | 14,281 | 20.1 | 4,207 | 16.5 |
| Electricity, gas, water supply | 1,394 | 2.0 | 207 | 0.8 |
| Construction | 4,800 | 6.7 | 2,084 | 8.2 |
| Wholesale trade | 6,815 | 9.6 | 2,118 | 8.3 |
| Retail trade | 12,806 | 18.0 | 3,757 | 14.7 |
| Accommodation, cafés etc. | 1,960 | 2.8 | 891 | 3.5 |
| Transport & storage | 3,837 | 5.4 | 1,355 | 5.3 |
| Communication services | 992 | 1.4 | 717 | 2.8 |
| Finance & insurance | 1,247 | 1.8 | 1,455 | 5.7 |
| Property & business services | 4,915 | 6.9 | 2,564 | 10.1 |
| Government & defence | 2,131 | 3.0 | 865 | 3.4 |
| Education | 5,865 | 8.2 | 1,377 | 5.4 |
| Health & community services | 5,295 | 7.4 | 2,421 | 9.5 |
| Cultural & recreation | 1,196 | 1.7 | 404 | 1.6 |
| Personal & other services | 2,375 | 3.3 | 971 | 3.8 |
| Total | 71,190 | 100 | 25,505 | 100 |
Source: NSW Transport Data Centre, based on ABS Census, 2001 208
Housing types
In 2001, the highest proportions of households in both places were found residing in separate houses: 83.1% in Blacktown LGA and 80.2% in the Sunnyholt study area. Although the total number of separate dwellings in Blacktown LGA increased from 1996 to 2001 (approximately 5399 dwellings), the percentage as a total of all dwellings in Blacktown LGA has declined from 85.6% to 83.1% in 2001.
Job opportunities
Blacktown is strategically located at the heart of a western region of more than 1.5 million people. Its outstanding features include transport infrastructure which provide road and rail network to Northern and Southern markets as well as to the Sydney CBD. The completion of the Sydney Orbital M7 and also the proposed TOD of the Sunnyholt study area will further enhance the accessibility of the city to market.
The manufacturing sector provides the largest segment of employment generation in Blacktown LGA with 14,281 jobs making up more than 20%. It has also the same ranking in the Sunnyholt study area, providing 4,207 jobs representing 16.5%. The second major employer in the Sunnyholt study area is property and business services (10.1%), whereas Retail represents this rank in Blacktown LGA. Finance & business sector employment in the Sunnyholt study area is also significant. There is little difference between the percentages of employed people in both places though the unemployment rate is slightly higher in Blacktown LGA compared to the Sunnyholt study area (See Figure 63).
The majority of people (more than 72%) use the car as the main mode of transport to work either in Blacktown or the Sunnyholt area (See Figure 64). Except the median household size, which is 3.1 in Blacktown LGA as against 2.9 in Sunnyholt, all other key averages in both places are similar such as median monthly housing loan repayment (i.e., $1000–$1199) and median weekly household income (i.e., $800–$999). 209
Figure 63: Employment: Blacktown and Sunnyholt, 2001
| Description | Blacktown LGA | Sunnyholt | |||
| Numbers | % | Numbers | % | ||
| Employed: | Full-time | 75,875 | 69.7 | 18,137 | 69.6 |
| Part-time | 28,889 | 26.5 | 7,011 | 26.9 | |
| Not stated | 4,113 | 3.8 | 909 | 3.5 | |
| Total | 108,877 | 100 | 26,057 | 100 | |
| Total labour force | 117, 930 | 28,001 | |||
| Unemployment rate (%) | 7.7 | 6.1 | |||
Source: ABS Census of Population and Housing, 2001
Figure 64: Methods of travel to work, 2001
| Methods | Blacktown LGA | Sunnyholt Corridors | ||
| Number | % | Number | % | |
| Train | 8,792 | 10.3 | 1,923 | 9.4 |
| Bus | 1,196 | 1.4 | 334 | 1.6 |
| Ferry | 4 | 0.00 | 3 | 0.01 |
| Tram | 11 | 0.01 | 3 | 0.02 |
| Taxi | 196 | 0.2 | 62 | 0.3 |
| Car, as driver | 62,205 | 72.8 | 14,993 | 73.5 |
| Car, as passenger | 7,734 | 9.0 | 1,735 | 8.5 |
| Truck | 2,292 | 2.7 | 500 | 2.5 |
| Motorbike/Motor scooter | 486 | 0.6 | 109 | 0.5 |
| Bicycle | 321 | 0.4 | 89 | 0.4 |
| Others | 356 | 0.4 | 93 | 0.5 |
| Walked only | 1,879 | 2.2 | 551 | 2.7 |
| Total | 85,472 | 100 | 20,395 | 100 |
Source: Transport Data Centre, using ABS Census data, 2001 210
Economic output
It is interesting to note that in terms of economic output, unlike the manufacturing sector, property and business services in Blacktown generated the highest revenue (i.e., $3.1 billion in GRP) in gross real terms across all industries in Blacktown LGA. This may be due to the booming construction business in the City. Manufacturing represented the second largest contributors (i.e., $1.8 billion), followed by Finance & Insurance with $0.9 billion in 2002–03 (ABS, 2003).
Property market
The property market is at a very low point in the market cycle with sales dropping since 2003 according to the ReMAX real estate broker in Blacktown (2007). The sales in May 2006 are approximately 60% less than what they were in 2005. The real estate agents interviewed do not see the market improving until 2008–2009 and believe this could be an appropriate period to buy land or property as prices are very low and should start to increase next year (See Figure 65).
Figure 65: Sunnyholt property market, 2006
| Description | Sunnyholt Study Area |
| Property Market | |
| 2 bedroom units sell at | $250,000–260,000 ($290k–$320k last year) |
| Town Houses | $ 290,000 |
| Detached Houses | $ 330,000 |
| Rental Market | |
| 2 bedroom units rent at | $230–$250pw |
| Town Houses | $230–$270pw |
| Detached Houses | $230–$250pw |
Source: ReMAX Real Estate Office, Blacktown, 2007
A number of opportunities for higher density housing and for more intense commercial development exist along the stretch of the T-Way that extends between Blacktown and the M7. These development opportunities could, over time, enhance its use and improve the quality and safety of the road. 211
Figure 66: Industry structure in Sunnyholt
| Standard International Industrial Classification & Industry Types | (A) Population needed for one firm |
(B) Potential businesses |
(C) Number of businesses |
(D) Gap (B – C) |
| Hardware store | 15,818 | 11 | 6 | +5 |
| Lawn and garden supplies | 20,082 | 6 | 2 | +4 |
| Department stores | 51,221 | 2 | 1 | +1 |
| General merchandise stores | 7,662 | 23 | 12 | +11 |
| Grocery stores | 3,575 | 49 | 21 | +28 |
| Motor vehicle dealers | 11,197 | 16 | 4 | +12 |
| Men’s & boys’ clothing | 45,747 | 4 | 13 | -9 |
| Women’s ready-to-wear | 12,643 | 14 | 17 | -3 |
| Shoe stores | 20,426 | 9 | 9 | 0 |
| Furniture stores | 12,530 | 14 | 11 | +3 |
| Drapery & upholstery | 20,178 | 3 | 3 | 0 |
| Household appliance stores | 18,673 | 9 | 4 | +5 |
| Radio & TV stores | 34,707 | 5 | 1 | +4 |
| Music Stores | 42,382 | 3 | 2 | +1 |
| Drug stores | 11,923 | 15 | 18 | -3 |
| Sporting goods & bicycles | 44,973 | 4 | 10 | -6 |
| Book stores | 41,478 | 2 | 3 | -1 |
| Stationary stores | 40,424 | 2 | 3 | -1 |
| Hobby, toy & game shops | 17,085 | 3 | 1 | +2 |
| Gift, novelty and souvenirs | 20,725 | 8 | 11 | -3 |
| Sewing, needlework etc. | 23,220 | 8 | 1 | +7 |
| Florists | 18,286 | 10 | 15 | -5 |
Source: www.yellowpages.com.au 212
Gap analysis
The gap analysis in Figure 66 is performed using the standard international industry classification of the firms’ entry threshold norms. Column A represents the number of populations needed for one firm entry by types to compute gap analysis. The number of potential businesses by types in Sunnyholt is shown in Column B. The number of existing registered businesses by types in the area is represented in Column C. The gap analysis is performed in Column D by subtracting Column C from Column B. The positive entry in the gap analysis indicates a prospect of more new businesses of this type could be established in Sunnyholt whereas negative entry reveals its saturation. From the gap analysis, grocery store, motor vehicle dealership and general merchandise stores businesses are still a huge prospect in the Sunnyholt study area.
Conclusions
This chapter has connected sustainability and transit-oriented development planning. It also designed a generic planning and assessment framework in economic perspectives to gauge the sustainability of TOD around bus corridors in the north-west sector of Sydney – a case of Sunnyholt in the city of Blacktown. The planning and assessment framework of TOD in general and policy and programs of the NSW government in particular was also analysed in this chapter. Many economic variables associated with TOD have been analysed minutely to gauge sustainable economic benefits and development along bus corridors in the Sunnyholt study area.
In order to know the potential new businesses in the area, a gap analysis method has been undertaken. The positive entry in the gap analysis (as shown in Column D) suggests that there is a possibility of new business entry in the area whereas a negative sign shows its saturation by industry types. From the gap analysis, grocery store, motor vehicle dealership and general merchandise stores businesses were found to be a high prospect in the Sunnyholt study area. For this to happen, the whole corridor of Sunnyholt needs to be included, recognising that it is the whole road and 213its edges that need to be improved. There is a need to look at a broader range of issues prior to designing of transit facilities of this nature. Although politically more complex, a much wider range of the stakeholders who stand to gain need to be involved and committed to the implementation of a common set of outcomes. Finally, a study like this one should have been carried out prior to the concept design of the T-Way comprising all the indicators as mentioned earlier in the chapter.
Notes
This chapter follows from a larger research project commissioned by the NSW Roads and Traffic Authority from Sydney University’s Planning Research Centre (2006).
214
References
Adam, J. (2004) Orienting Sydney to bus transit: a policy and practice comparison and analysis. A dissertation for the degree of MURP. Sydney: University of Sydney (unpublished).
Australian Bureau of Statistics (ABS) (2001) Census of population and housing. Canberra: Australian Bureau of Statistics.
Bae, C. C. (2002) ‘Orenco Station, Portland, Oregon: a successful transit-oriented development experiment.’ Transportation Quarterly. 56(3): pp. 9–18.
Belzer, D. and Aulter, G. (2002) ‘Countering sprawl with transit-oriented development.’ Science and Technology. 19(1): pp. 51–58.
Bernick, M. and Cervero, R. (1997) Transit villages for the 21st century. New York: McGraw-Hill.
Boarnet, M. and Crane, R. (1998) ‘Public finance and transit-oriented planning: new evidence from southern California.’ Journal of Planning Education and Research. vol. 17: pp. 206–219.
Bonsall, J. (1997) ‘Planning for a transit-oriented city: lessons from Ottawa-Carleton.’ Transport Engineering in Australia, pp. 12–18.
Calthorpe, P. (1993) The next American metropolis: ecology, community, and the American dream. Princeton: Architectural Press.
Cervero, R., Murphy, C. Ferrell, N., Goguts, T., Yu-Hsin, G.B., Arrington, J., Boroski, J., Smith-heimer, R., Golem, P., Peninger, E., Nakajima, R., Chui, R., Dunphy, M., Myrres, S., and Witenstein, N. (2004) Transit oriented development in the United States: experiences, challenges, and prospects, TCRP Report 102, Transportation Research Board.
Department of Infrastructure, Planning and Natural Resources (DIPNR) (2001) Department of Infrastructure, Planning and Natural Resources, Transport Data Centre, Government of New South Wales.
Dittmar, H. and Ohland, G. (2004) ‘Defining transit-oriented development: the new regional building block,’ in H. Dittmar and G. Ohland (eds.), The new transit town: best practices in transit oriented development. Washington DC and London: Island Press.
Dodson, J. and Sipe, N. (2006) Suburban shocks: assessing locational vulnerability to rising housing fuel and mortgage interest costs. Australian Transport Research Forum Conference, Gold Coast. 215
Hale, C. and Charles, P. (2007) A step-by-step approach to TOD project delivery. Paper presented at the 11th World Conference on Transport Research, University of California Berkeley, 24–28 June 2007.
Lefaver, S. (1997) Private land with public partnerships for transit based development. San Jose, California, The Mineta Transportation institute, San Jose State University, Report 01–05.
Levinson, R. (2003) Bus rapid transit, TCRP Report 90, Transportation Research Board.
Li, C. and Lai, T. (2006) ‘Sustainable development and transit-orientated development cities in Taiwan’. Unpublished: available from the website of the National Ceng-chi University Taipei at www.nccu.edu.tw
Lund, H. M., Carvero, R., and Wilson, R. W. (2004) Travel characteristics of transit-oriented development in California. Caltrans Transportation Grant, State-wide Planning Studies, FTA Section 5313 (b).
NSW Government (1998) Action for Transport 2010.
Planning Research Centre (2006) Transit oriented developments along bus corridors A Research Report Prepared by the Planning Research Centre, University of Sydney and the Jackson Teece for NSW Roads and Traffic Authority.
Porter, D. R. (1997) Transit-focused development. TCRP Synthesis 20, Transportation Research Board.
ReMAX (2007) ReMAX Real Estate Office, Blacktown.
Renne, J. (2005) Transit-oriented development in Western Australia: attitudes, obstacles, and opportunities. Paper prepared for the Western Australia Department for Planning and Infrastructure: Planning and Transport Research Centre, Murdoch University.
Renne, J. and Wells, J. (2005) Transit-oriented development: developing a strategy to measure success. Research Results Digest 295, Washington DC: National Cooperative Highway Research Program, Transportation Research Board of the National Academies.
Rodriguez, D. A. and Targa, F. (2004) ‘Value of accessibility to Bogotá’s bus rapid transit system.’ Transport Reviews. 24(5): pp. 587–610.
Salvensen, D. (1996) ‘Promoting transit oriented development.’ Urban Land. July 1996, pp. 16–20.
Smith, H. and Raemaekers, J. (1998) ‘Land use pattern and transport in Curitiba.’ Land Use Policy. 15(3): pp. 233–251.