6
Battlers and aspirationals: the Liberal Party and the median voter
Major political parties are perennially seeking the middle ground of politics, where electoral success or failure is often thought to reside. The search for the median voter – the person with middle-of-the-road opinions and concerns and who is open to changing her vote – has occupied considerable time and effort from parties, candidates and their large followings of advisers. Crafting policies that appeal to this group is considered to be crucial to winning an election. Indeed, the median voter model has come to assume such importance in theories of electoral behaviour that it has been referred to as ‘a fundamental property of democracy’ (Congelton 2004, 707).
Identifying the median voter and the demographic group that she belongs to has given rise to a minor public relations industry. In Britain, various terms have been used to denote this stereotypical voter, most recently with ‘Holby City Woman’ and ‘Motorway Man’ in the 2010 general election. The former was described as a female public sector employee in her 30s or 40s concerned about education and the cost of childcare (Aaronovitch 2009); the latter was seen as ‘aspirational, materialistic and car-dependent’ (Pickard 2010). Both were regarded as representing key demographic groups which could decide the outcome of the election. In the United States, the equivalent of ‘Holby City Woman’ is the ‘Soccer Mom’, a term that emerged in the mid-1990s, and her successor, ‘Hockey Mom’, who was associated with Sarah Palin’s vice-presidential candidature in the 2008 presidential election (Burns, Eberhardt and Merolla 2013).
Australia has generated its fair share of these median voter stereotypes. Most commonly used are the terms ‘aspirational voter’ and ‘battler’. The former term was added to the Australian National Dictionary in 2016, where it is defined as ‘a voter who is mainly concerned with material improvement or gain.’1 In the same edition, the Dictionary also added the term ‘Howard’s battler’, which it defined as ‘a person (especially working-class), traditionally regarded as a Labor voter, who was instrumental in electing John Howard’s conservative Coalition to power in the 1996 federal election; such a person who continues to vote for the Coalition.’ Like their international counterparts, these terms epitomise the concept of the floating voter, who comes from a key demographic group and whose support is crucial for electoral success.2
This chapter examines the extent to which the terms ‘aspirational’ and ‘battler’ represent identifiable social groups with distinctive political leanings, as opposed to catchy media phrases that serve to summarise the prevailing public mood and have few electoral implications. If such groups are identifiable, has their voting behaviour been as pivotal as is often alleged, most notably in the 1996 election? And perhaps most importantly, have any changes that are evident been permanent, or is the party loyalty of these voters continually open to change at each election? This chapter seeks to answer these questions using the 1993 to 2016 Australian Election Study (AES) surveys, which are national public opinion surveys conducted after each federal election using a common set of questions.
The first section examines the emergence of the median voter as a key demographic in Australia, and compares this experience with that of Britain. The second section outlines the theory that underpins the median voter and the assumptions on which the theory is based, while the third section uses the 1993–2016 surveys to identify various types of voters within the electorate and estimates their relative size. The fourth section seeks to identify the social groups that most characterise the median voter, while the fifth section examines their electoral support. Finally, the conclusion places the results in the context of international research on the policy implications of the median voter.
The emergence of the median voter
The terms ‘aspirational voters’ and ‘battlers’ are now widely used in Australian politics, and they are increasingly used internationally as well. The terms are often assumed to identify the groups of voters that the major parties must win over in order to gain office. They have their origins in the 1996 election victory by the Liberal Party led by John Howard, which ended 13 years of Labor government. Compared to the 1993 election, the Coalition gained 29 seats to give it a total of 94 seats, the largest number of seats the Coalition has secured in any federal election before or since.3 The scale of the victory led to the widespread belief that a key demographic group – previously supporting Labor – had shifted its support to the Coalition (Singleton, Martyn and Ward 1998). The fact that the 1996 win presaged three further election successes appeared to confirm the belief that this change had become permanent.
In theory, ‘aspirational voters’ and ‘battlers’ are distinct groups, but in practice there is considerable overlap. Both terms conflate occupational status, patterns of consumption, and political attitudes, as well as current and prior voting behaviour. The net effect of this conflation is that arriving at agreed definitions is problematic. Scalmer (2005, 5), for example, notes that aspirational ‘defies easy definition’, while Goot and Watson (2006, 4) talk of ‘conceptual confusion’. Brent (2004, 4) suggests that battlers are distinguished not just by their defection to the Liberals in 1996, but by their prior long-term loyalty to Labor. Haydon Manning (2014, 228) adopts a more precise definition: ‘battlers are taken to be those survey respondents who were blue collar or in lower-paid white collar employment and who believed that their household was a little or a lot worse off financially than 12 months previously.’
The definitions that appear in the Australian National Dictionary suggest that aspirationals are those who strive for material gain and by implication would normally regard the Liberals as most able to deliver that goal. Such voters could be more or less prosperous in terms of their economic position; the core point is that they seek to improve their current situation. In contrast, battlers are identified mainly by their defection from Labor to Liberal in the 1996 election with the goal of significantly improving their economic position; they are assumed to be much less prosperous than the general population. The common themes in these definitions are, first, the desire for material gain and/or upward social mobility and, second, a preference for the Liberals as the party most likely to create the conditions that will achieve those goals.
‘Battler’ resonates with an earlier term that gained much currency in conservative politics in the mid-twentieth century – ‘the forgotten people’ (Dryenfurth 2005). This term was first used by Robert Menzies in a 1942 radio speech following the fall of Singapore. In the speech, Menzies characterised the ‘forgotten people’ as ‘those people who are constantly in danger of being ground between the upper and the nether millstones of the false class war; the middle class who, properly regarded, represent the backbone of the country’ (quoted in Brett 1984, 255). The parallels between the ‘forgotten people’ and the ‘battler’ are obvious; both imply that there is an existential political threat to the economic position of these citizens, and that the opportunity to achieve material prosperity through hard work and skill may be denied to them.
Similar terms have also been widely used in British politics, starting with ‘Selsdon Man’ in 1970. This term was coined by the Labour prime minister Harold Wilson following a workshop for the Conservative shadow cabinet held in the Selsdon Park Hotel, London. The outcome of the workshop was a policy agenda based on free-market economic policies, and the venue gave its name to a free-market pressure group formed in 1973. Wilson used the term to disparage free-market policies, but in fact they appealed to many voters seeking upward social mobility and the Conservatives won the subsequent general election.4 Since 1970, there has been a long list of terms used to identify what have been thought to be key demographic groups in British politics.
Most of these British stereotypes have been used to identify demographic groups which it was thought would defect from Labour to the Conservatives, but several have canvassed defection in the opposite direction. One of the most important of these was ‘Mondeo Man’, which was seen by Tony Blair as the key demographic that Labour had to win in the 1997 election in order to end the long period of Conservative government. Blair launched the term at the 1996 Labour conference, when he spoke of meeting a self-employed electrician who was polishing his car: ‘his instincts were to get on in life and he thought our instincts were to stop him’ (quoted in Moran 2005, 237). Another key Labour demographic was ‘Worcester Woman’, ‘a middle class mother in her 40s or 50s who had previously voted for the Conservatives, but was swayed by Tony Blair’s charismatic and youthful energy and his policies targeted to woo the middle class’ (Christophersen 2010, 17).
While stereotypical labels of voters change, the idea that a voter should be free to improve her economic position and that government should assist in this process has underpinned all of these ideas. The idea also appears to be gaining momentum, at least as it is reflected in newspaper mentions. Figure 6.1 shows the number of mentions of ‘aspirational voter’ in the Australian and the London Times newspapers.5 The first mentions of the term appear in the early 1990s and their frequency in the Australian climbs steadily with each election, peaking at 86 mentions in the 2007 election. In the 2010 election there were just 29 mentions, but rising to 50 in 2013 before declining slightly to 41 in 2016. The frequency of mentions in the London Times is lower, but it is notable that there is a sharp increase, to 44 mentions, during the 2015 general election.
Figure 6.1 Mentions of ‘aspirations voters’ in Australia and Britain, 1992–2016.
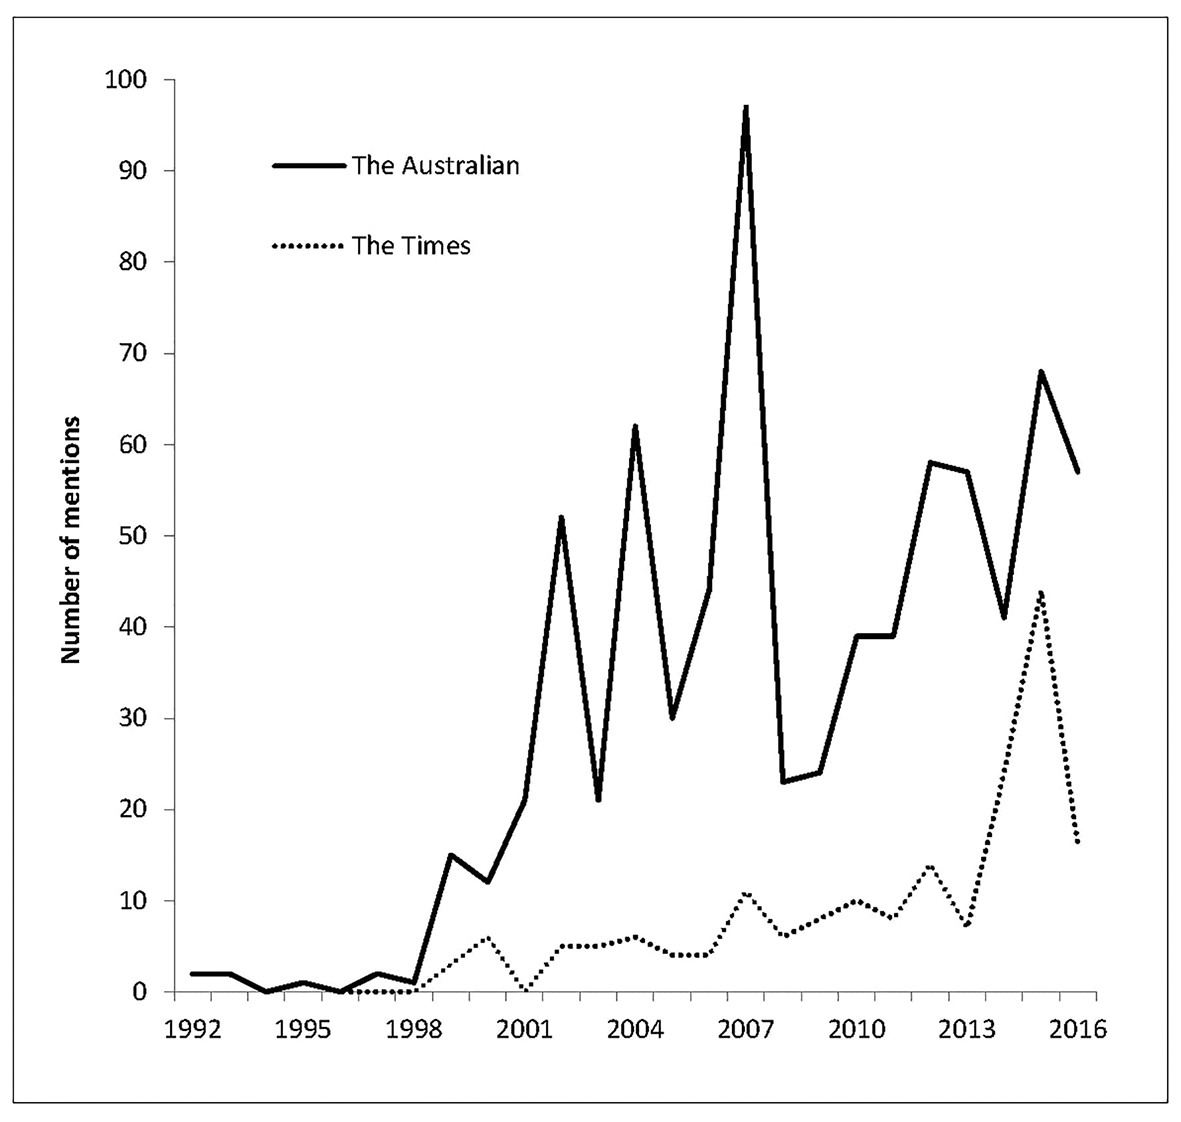
Note: The figures are the number of mentions of ‘aspirational voter’ or ‘aspirational voters’ in the two newspapers for the period for which data is available.
In Australia, ‘aspirational voters’ and ‘battlers’ have come to epitomise the concept of the floating voter, and the idea that government should assist rather that impede individuals who wish to achieve material gain through hard work and effort. In Britain, the concept has progressed further, with places, consumer goods and even television programs being used to identify the key demographic group to which these individuals are thought to belong. Underpinning this interpretation is the view that elections are won or lost in the centre-ground and that a normal distribution of public opinion encourages centripetal party competition. The next section examines the theoretical background to this claim.
The median voter theory
First applied to politics by Anthony Downs in 1957, the median voter theory predicts that parties will shift their appeals to the political centre in order to win votes, since this area is assumed to contain the largest proportion of uncommitted voters. The model is based on three assumptions. First, it assumes that there is a plurality electoral system and a two-party system. If, for example, there is a proportional electoral system and/or a multiparty system, the main parties will have less incentive to appeal to the centre. Instead, they may seek alliances with the parties that occupy the political space closest to themselves. Second, the model assumes that voters’ opinions are distributed along a single continuum, such as left versus right. If there is a second cross-cutting continuum, such as freedom versus authority, then the assumption of linearity does not apply. In this case, what constitutes the political centre becomes blurred and the optimum party strategy is unclear. And third, the model assumes a unimodal distribution of opinion. If public opinion is bimodal then there is no identifiable political centre.
The median voter model rapidly gained prominence in voting research, and has been widely applied to many countries with highly varied institutional arrangements (for a review, see Holcombe 1989). It soon became clear that the model was highly sensitive to a country’s institutional design characteristics, and if specific characteristics were not present, the model would not behave as predicted. However, empirical research has demonstrated that if the three conditions noted earlier are met, then two-party convergence is indeed likely to occur. While party candidates will tend to be closer to the median voter in their own party, it does appear that their views will also shift towards appealing to uncommitted voters who occupy the centre (Grofman 2004, 40).
In Australia, the Liberal and Labor parties’ pursuit of the median voter is encouraged by three factors. First, while partisanship has remained relatively stable since 1996, with about one in six voters not identifying with a political party, the extent of voting volatility has increased consistently. In 1967 almost three in every four voters said that they had always voted for the same party in federal elections; by 2016 that figure had declined to 40 per cent (Cameron and McAllister 2016, 21), although in the vast majority of cases, voters will defect from their partisanship only once or twice during a voting lifetime. Second, the vote gap that separates the two political parties is consistently small. In the 28 federal elections conducted since 1945, the mean vote difference between the parties, based on the two-party preferred vote, was just 4.4 per cent, meaning that little more than 2 per cent of the electorate would need to change their vote in order to alter the election outcome. Third, compulsory voting brings to the polls around one in seven voters who would not attend under a voluntary voting system.6 These voters are more likely to be uncommitted, thus increasing the pool of voters potentially occupying the centre-ground of politics (Mackerras and McAllister 1999).
The pursuit of the median voter has obvious attractions for the major political parties. Institutional design provides a strong incentive for the major parties to seek the support of the uncommitted median voter, and to largely take their own supporters for granted since they have few other alternatives. Where support for minor parties has periodically posed a potential threat – for Labor, from the Australian Democrats and latterly the Greens, and for the Liberals, from One Nation – the operation of the preferential electoral system for the House of Representatives ensures that the major parties regain the bulk of the minor party vote through the distribution of preferences. The trend towards two-party convergence in Australia corresponds very closely to the predictions of the median vote theory.
Identifying the median voter
The confusion over defining an aspirational voter and a battler makes operationalising the concept of the median voter using public opinion surveys difficult. Past research has used a variety of measures covering occupation, political attitudes, and voting behaviour. Manning (2014, 228; see also Manning 2005) identifies battlers as those in blue-collar or lower-paid white-collar employment who considered their household to have become worse off financially over the previous year. Using this definition, Manning estimates battlers to represent around 17 per cent of the electorate in 1996. Goot and Watson (2006, 5) use two definitions for aspirational: a narrow occupational definition based on self-employment; and a broader definition that includes attitudes towards getting ahead in one’s job and achieving a high income, among other things. According to this latter definition, around 7 per cent of the electorate are aspirational.7
Building on this previous research, the approach used here is to identify aspirational voters by their attitudes to government policies that may either encourage or impede their ability to achieve material gain. Using a subjective rather than an objective measure is based on the logic that aspiration is more a state of mind than a consequence of a person’s position in the employment structure. By contrast, being a battler is less attitudinally based and is more likely to stem from a person’s objective economic situation; in this case, a battler is defined by her gross family income and by her evaluation of the performance of the household’s income over the past year.
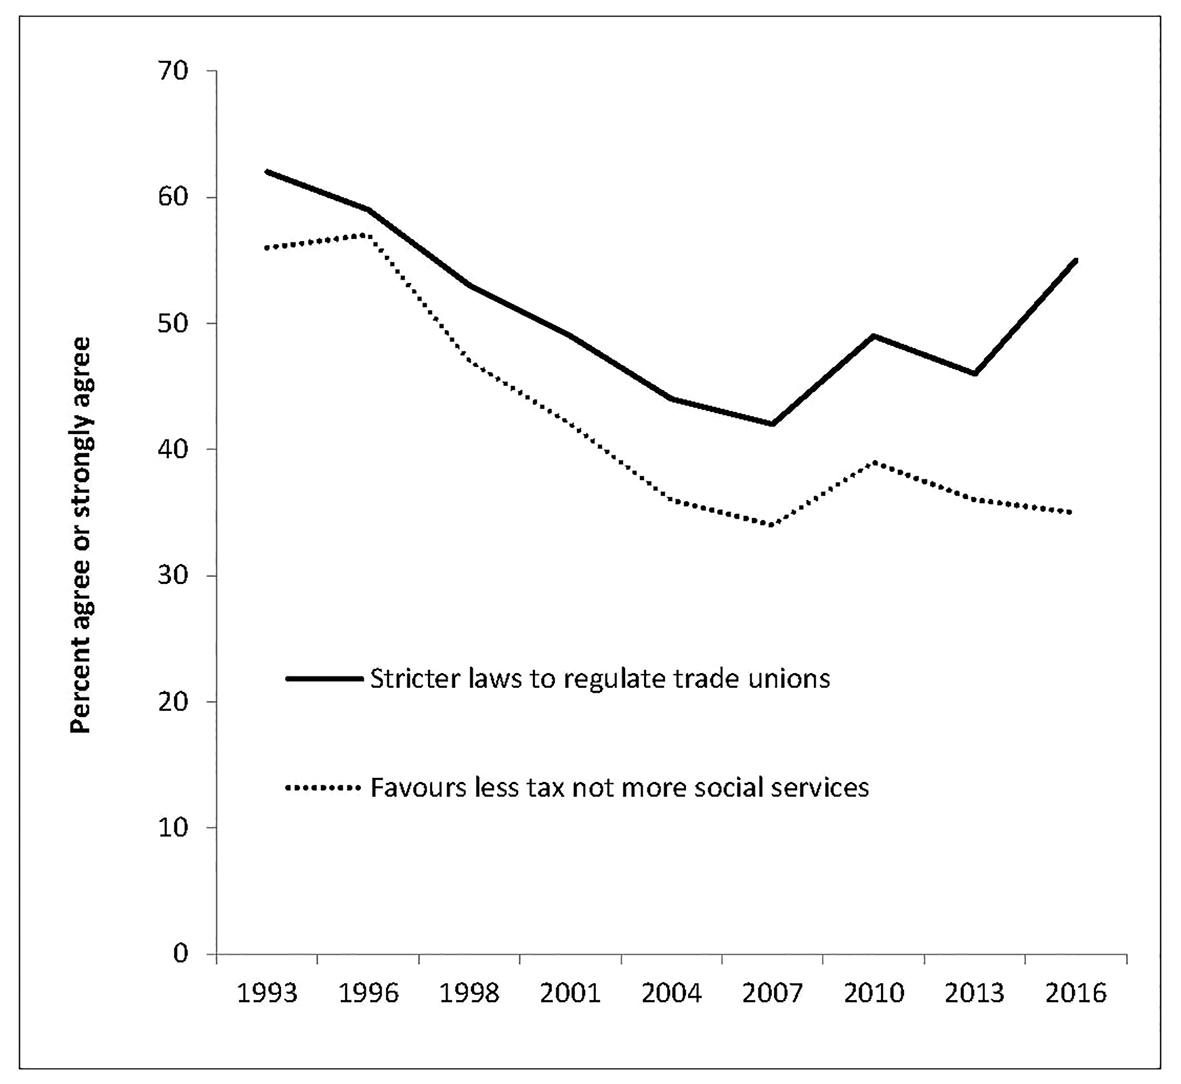
In order to identify aspiration, two broad issues are used: attitudes towards the direction of government spending, and views of trade union regulation. How government approaches both issues has the potential to affect a person’s ability to achieve material gain through public policy, the first by choosing between more government spending towards social services or tax cuts, and the second by whether or not to increase the level of trade union regulation.8 In principle, reducing taxes and weakening trade union influence should increase the opportunities for material gain, especially for the self-employed. Both the level of government spending and trade union laws have been major issues in most of the elections conducted over the 1993 to 2016 period. Both therefore focus on how government policies can shape a voter’s level of economic prosperity.
In 1993 and 1996 the electorate’s views were strongly in favour of regulating the activities of trade unions. Figure 6.2 shows that around six out of every ten respondents took this view. The proportion in favour of more regulation has declined consistently since then, to a low of 42 per cent in 2007, when the Liberal government’s industrial relations policy called WorkChoices was a major issue. Support for regulation has gradually increased since 2007, to 55 per cent in 2016 when the Liberal government made union activities in the building industry an election issue. Attitudes towards less tax as opposed to greater government spending on social services shows a similar pattern. In 1993 and 1996 just under six in every ten respondents favoured less tax, but that proportion has declined consistently, reaching its lowest figure – 34 per cent – again in 2007. Since then, the proportion in favour of less tax has remained at around one in three of the electorate, about the same proportion who favour more spending on social services.9
Figure 6.2 Attitudes towards unions and taxation, 1993–2016.
Source: Australian Election Study (AES), 1993–2016.
In contrast to using attitudes towards public policy to define aspirational voters, battlers are defined by the perceived condition of their household economy. More specifically, a battler is considered to be someone whose family income falls into either the fourth or fifth quintile in the survey in question, together with an assessment that the financial situation of the household has become either ‘a little worse’ or ‘a lot worse’ over the previous year. This definition therefore identifies someone who has a relatively low income, at the same time as feeling that their household income is under pressure and shows little sign of improving.
Although battlers and aspirationals are based on different definitions, in practice there is necessarily some overlap between them. A battler trying to cope with the difficulties caused by a low income can also be aspirational, insofar as she sees a remedy to her situation in terms of changes in government policy. However, in 1996 just 17 per cent of aspirational voters were also battlers, little different from the population figure of 16 per cent.10 For the purposes of classification, then, battlers are considered as a discrete group, while aspirationals are those who have the political views outlined above but who are not battlers. At the other end of the spectrum, the responses to the two attitude questions enable us to identify those who are broadly collectivist in their views, by favouring more government spending on social services and by opposing more union regulation.11 Those who do not fall into any of these three categories are classified as indifferent.
It is also important to bear in mind that in an over-time analysis such as that presented here, these groups will be composed of different people at different points in time. For example, an individual may improve her economic position over time, and while being classified as a low-income battler in the 1990s, could be a relatively prosperous aspirational voter in the 2000s. In other words, underlying the trends examined in this chapter is a dynamic which involves a degree of fluidity in the individuals who occupy the various categories.
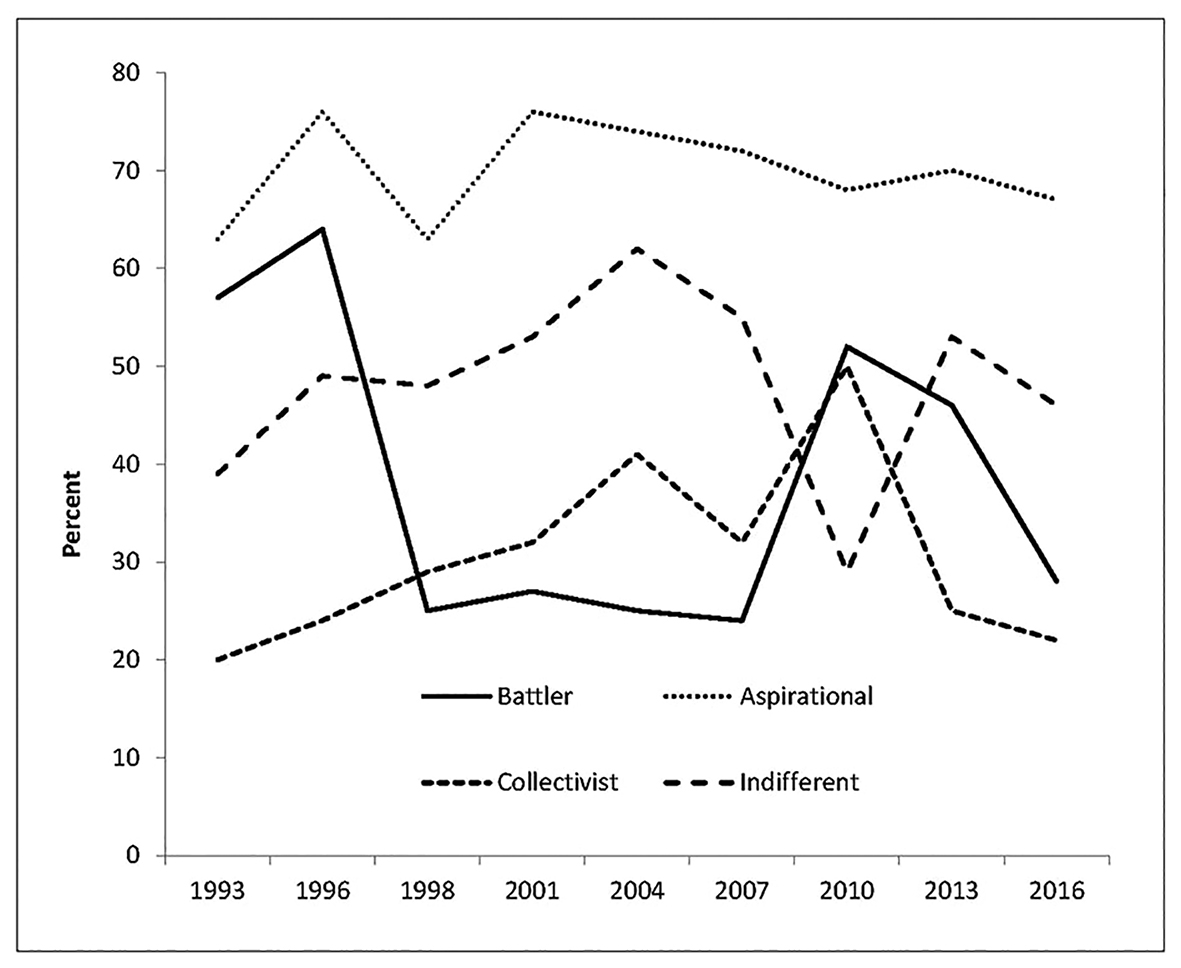
These four groups of voters have varied considerably in size from 1993 through to 2016 (Figure 6.3). In 1993, the first year for which we can make an estimate,12 battlers constituted one in five of the electorate. This estimate comes in the wake of the 1990–91 recession, when unemployment peaked at 10.8 per cent and interest rates at just over 16 per cent. With improving economic conditions, the proportion of battlers declined to 15 per cent in 1996 and 1998, only to increase again to 18 per cent in 2001 following the economic slowdown of 2000. Since then battlers have declined in size; in 2016 they represented 16 per cent of the electorate. The proportion of aspirational voters has also declined over the period, from three in every ten voters in both 1993 and 1996, to just 20 per cent in 2016. At the other end of the political spectrum, collectivist voters numbered just over one in four voters in 1993, but by 2007 this had increased to almost half of the electorate. In 2013 and 2016 collectivists numbered around one in every three voters.
Figure 6.3 Types of voters, 1993–2016.
Source: AES 1993–2016.
The patterns in Figure 6.3 emphasise the declining size of the two groups that are taken to represent the median voter. In 1993 and 1996 battlers and aspirationals together accounted for 50 per cent and 45 per cent of the electorate, respectively. However, by 2016 they together accounted for 36 per cent. This decline has been driven by the relative economic prosperity generated by the mining boom that occurred between the mid-2000s and 2011–12. Prosperity has changed attitudes to government spending as well as towards trade unions, and generated improved living standards. At the same time, collectivists have grown substantially in size and were most prevalent at the time of the 2007 election, which brought the election of the Rudd Labor government following 11 years of Coalition government.
Table 6.1: Socioeconomic characteristics of types of voters, 1996 and 2016.
| 1996 | 2016 | |||||||
|---|---|---|---|---|---|---|---|---|
| Battler | Aspirational | Collectivist | Indifferent | Battler | Aspirational | Collectivist | Indifferent | |
| Social background | ||||||||
| Gender (per cent male) | 45 | 51 | 53 | 43 | 44 | 61* | 48 | 45 |
| Age (mean years) | 50.6* | 45.8 | 46.6 | 43.8 | 55.1* | 51.3* | 46.2 | 46.1 |
| Urban resident (per cent) | 37* | 54 | 55 | 50 | 40* | 54* | 67 | 52* |
| Education and occupation | ||||||||
| University degree (per cent) | 10* | 23* | 34 | 23* | 18* | 41* | 48 | 33* |
| Trade qualification (per cent) | 27* | 22 | 16 | 16 | 22* | 18* | 11 | 14 |
| Employed (per cent) | 30* | 51 | 50 | 49 | 34* | 69 | 63 | 58 |
| Non-manual worker (per cent) | 39* | 58 | 60 | 56 | 63 | 40* | 60 | 57 |
| Government employee (per cent) | 10* | 17* | 28 | 20* | 23 | 18* | 26 | 18* |
| Self-employed (per cent) | 26* | 30* | 11 | 14 | 17 | 32* | 15 | 18 |
| Economic status | ||||||||
| Family income (mean, ’000s) | 13.5* | 45.5* | 38.9 | 38.0 | 32.0* | 103.0 | 102.0 | 94.3* |
| Union member (per cent) | 24* | 18* | 39 | 23* | 13* | 10* | 24 | 17* |
| Middle-class image (per cent) | 30* | 57* | 45 | 47 | 29* | 61 | 59 | 49* |
| (N) | (273) | (539) | (435) | (471) | (435) | (523) | (854) | (840) |
* significantly different from collectivist at p<.01, two-tailed. Ns for individual items vary due to missing values.
Source: AES 1996, 120=2016.
Who is the median voter?
Accurately identifying the social composition of the four groups is the first step to understanding their potential importance in shaping electoral outcomes over an extended period. If the groups that represent the median voter can be readily identified, then the parties can craft individual appeals to try and win their support. To see how socially distinctive the groups are, three broad categories of background characteristics – social background, education and occupation, and economic status – are examined across the four groups of voters (Table 6.1). The 1996 election is chosen as the baseline for the analysis as it has been identified as the election in which the battlers first became electorally important.
Judged against collectivists, there are relatively few differences in terms of social background across both elections among battlers and aspirationals, the only significant differences being that battlers are more likely to be older and non-metropolitan residents. There are, however, very substantial differences between the groups in terms of their education and occupation which are replicated in each election. Aspirational voters and especially battlers are less likely to have a university education, less likely to be employed, and more likely to have a trade qualification. In addition, aspirational voters are consistently more likely to be self-employed.
Important differences between the groups also emerge on economic status. Income is not a relevant point of comparison for battlers since that is one of the two criteria by which they are measured. However, income was important for aspirationals in 1996, who had a significantly higher family income than the other groups, but not in 2016. Nevertheless, aspirationals have the highest family income of any of the four groups. Aspirationals were also more likely than anyone else to regard themselves as being middle class. And they are also significantly less likely in both elections, along with battlers, to be trade union members.
The median voter – either battler or aspirational – can therefore be identified with a high degree of precision by their socioeconomic characteristics. This enables the political parties to target these groups, and to develop policies designed specifically to try and win their votes. Battlers and aspirationals are similar in many of their background characteristics, with the crucial exceptions that battlers have much lower incomes, do not see themselves as middle class, and are older and less urban-based. In principle, then, policies aimed at the redistribution of wealth and support for social welfare should appeal to battlers to a greater extent than aspirationals, who prioritise retaining as much of their wealth as possible. We return to the policy implications of this interpretation in the conclusion.
The electoral impact
Following each federal election, the Liberal Party federal director and the Labor Party national secretary traditionally give a National Press Club speech reassessing their election campaign, and explaining the reasons for their success or failure. In 1996 the Liberal federal director, Andrew Robb, attributed Liberal success to a fundamental shift in votes to the Coalition from a specific demographic group. Using an exit poll based on 52 electorates, Robb argued that these votes had come ‘from workers and their families – Howard’s battlers’. This change, he argued, had come about because Labor had decided ‘to chase the votes of the socially progressive, often highly educated, affluent end of middle Australia’.13
Robb’s speech is often cited as the genesis of the view that the Coalition’s four successive electoral successes starting in 1996 were attributable almost solely to the support of ‘Howard’s battlers’ (Brent 2004). Without the key support of this group, it was argued, this unbroken run of election successes would have been impossible. The idea of the ‘battler’, engaged in an unequal fight against an uncaring corporate elite, fitted the populism of the times (Greenfield and Williams 2001). It has entered the lexicon of the political class, and is regularly used as a convenient shorthand label to identify working-class conservatives. The term was also soon part of the media’s election rhetoric, and there have been numerous stories since 1996 purporting to identify the archetypal ‘Howard battler’ and to trace her views of the contemporary political scene.
Identifying the four types of voters allows us to trace their vote over the 1993 to 2016 period (Figure 6.4) and to test this argument empirically. The evidence suggests that whilst battlers did support the Coalition in large numbers in 1996, they deserted them almost as rapidly in 1998. In 1996 almost two in three battlers voted for the Coalition, but in 1998 the proportion voting for the Coalition was just one in four – a massive shift in support in a short period of time. Moreover, battlers remained consistently unlikely to vote for the Coalition through the 2000s until 2010, when their support shifted back to the Coalition, although not in the numbers seen in 1996. Moreover, by 2016 battler support for the Coalition had returned to the levels found between 1998 and 2007. The evidence would suggest, then, that the idea of Howard’s battlers defecting from Labor to Liberal in 1996 and continuing their support after 1996 is a myth. These voters did defect from Labor to Liberal in 1996, but the Liberals did not retain their loyalty.
Figure 6.4 Coalition voting among battlers and aspirationals, 1993–2016.
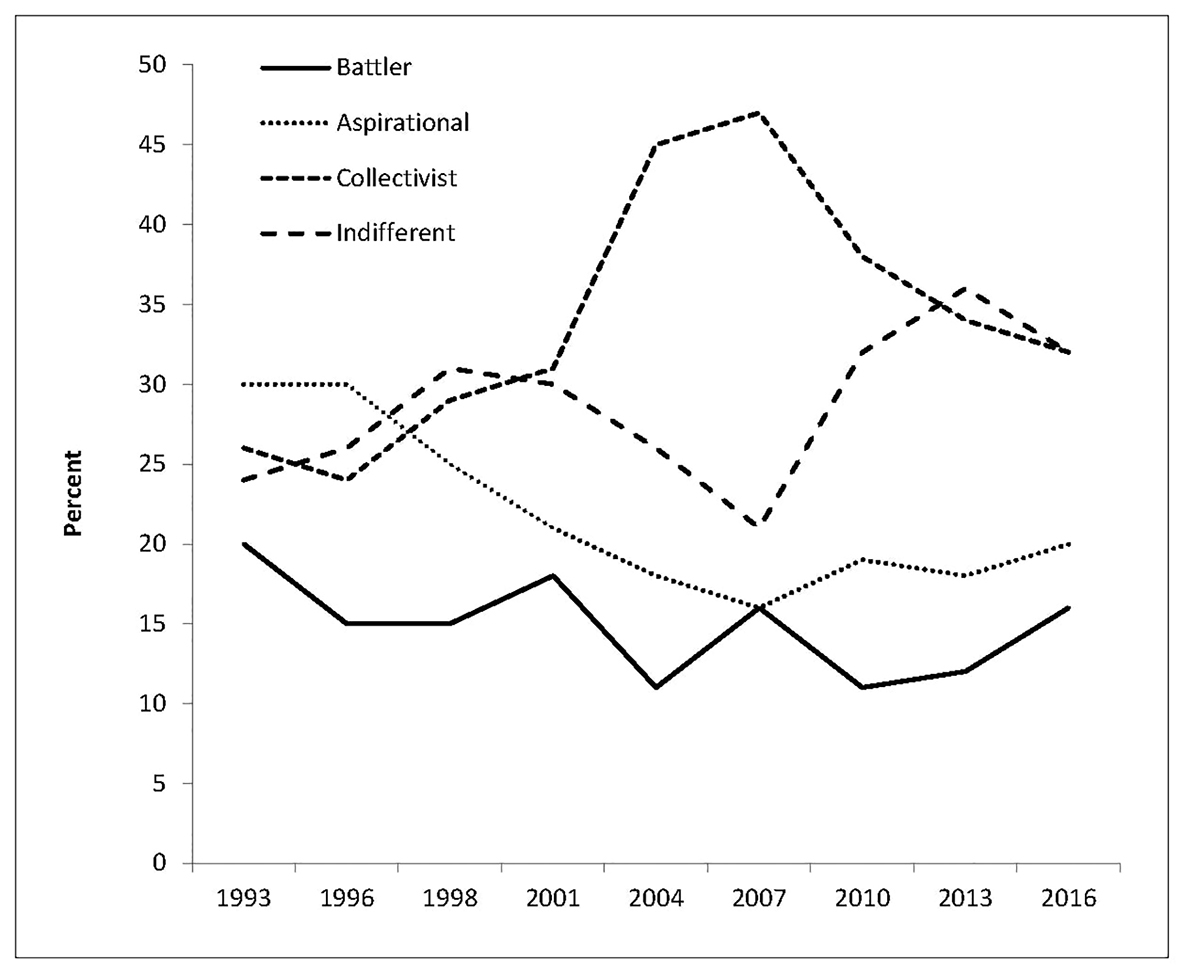 Source: AES 1993–2016.
If the battlers were unlikely to vote for the Coalition between 1998 and 2007, who did they vote for? The main beneficiary of the defection of the battlers from the Coalition after 1996 was Labor. In 1998, 54 per cent of battlers voted Labor, as did 53 per cent in 2001. This proportion gradually increased to 60 per cent in 2004 and peaked at 65 per cent in 2007. The defection of the battlers from the Coalition in 1998 has two main explanations. First, the rise of One Nation proved attractive to a significant minority of battlers, with 11 per cent of them voting for the party. Second, concerns about the impact of the introduction of a goods and services tax on their household economy caused many battlers to return to Labor. Among battlers, 59 per cent preferred Labor policy on the new tax compared to 42 per cent of the general population.
The surge in battler support for the Coalition in 2010 was equally temporary. That appears to have been driven by the twin concerns of declining economic performance following the Global Financial Crisis and the high numbers of refugee arrivals by boat following Labor’s changes to border protection policy. By 2016 battler support for the Coalition had again dissipated. Labor was once again the main beneficiary, but not at the level they experienced in 1998 and 2001. In 2016, 39 per cent of battlers voted Labor, but one in four voted for minor parties – the highest proportion doing so among any of the four voter groups. While the numbers in the survey are small, particular beneficiaries of this move away from both major parties in 2016 appear to have been One Nation and the Nick Xenophon Team.
In contrast to the battlers, aspirational voters have remained consistently supportive of the Coalition throughout the 1993 to 2016 period. Figure 6.4 shows that around seven in every ten aspirational voters have supported the Coalition with peaks of 76 per cent in both 1996 and 2001. The only partial exception to this pattern occurs in the 1998 election when 63 per cent voted for the Coalition, the same figure as in 1993. For all practical purposes, then, aspirational voters are a core part of the Coalition’s electoral support. However, because the proportion of aspirationals within the population is declining, their overall contribution to the Coalition vote has also declined, from 45 per cent of the Coalition vote in 1993, to a low of 25 per cent in 2004. In the 2016 election, 34 per cent of the total Coalition vote came from aspirational voters.
The evidence would suggest, then, that the majority of battlers who defected from Labor to Liberal in 1996 simply returned to Labor in 1998. Moreover, throughout the period of the Howard Liberal government they remained staunch Labor voters, only again turning their backs on Labor after the experience of the dysfunctional 2007–10 Rudd–Gillard government. There is some survey evidence from the 2007 AES that this shift among the battlers away from Labor may have been driven by disapproval of Julia Gillard’s replacement of Kevin Rudd.14 The belief that ‘Howard’s battlers’ were a distinct group who permanently shifted their support from Labor to Liberal therefore has no empirical evidence to support it. Between 1998 and 2007, battlers were much more likely to see their interests being served by Labor rather than by the Liberals.
Conclusion
The pursuit of the median voter has come to occupy much time and effort among party professionals. The narrowness of the vote gap between the major parties, with typically a 1 to 2 per cent shift in votes delivering success or failure, has given added urgency to this search. But does the median voter exist? If the median voter does exist, who is she, and what drives her defection between the major parties? The evidence presented here, relying on national election studies conducted immediately after each federal election since 1993 and using exactly comparable measures, has suggested that there is a median voter, but that she owes no loyalty to one or other party. Moreover, the stereotypical Howard battler invented by Andrew Robb in 1996 just as rapidly defected from the Liberals in 1998 and did not return for another five elections.
To a large extent the myth of the median voter has been driven by the mass media, for whom the appeal of a catchy phrase to symbolise the times outweighs the requirement to test it against the evidence. Indeed, it would seem that the Australian National Dictionary is wrong to define ‘Howard’s battlers’ as an identifiable group that remained loyal to the Liberals after 1996. Not unsurprisingly, the battlers took the view that the introduction of a goods and services tax in 1998 would not be in their economic interests and largely shifted their support back to Labor. They only returned to the Liberals in 2010, again temporarily, and then not in the proportions seen in 1996. By 2016 they had moved to Labor, as well as supporting several of the more prominent minor parties.
The other median voter group, the aspirationals, have consistently remained loyal to the Coalition, and their importance to the Liberal vote has diminished not because of any change in their partisan loyalty but as a consequence of the decline in their absolute size within the electorate. But the support of aspirational voters for the Liberals has been gradually declining since the peak in 2001. Among this older and more prosperous demographic group, concerns about the changes introduced by the Coalition government in 2015–16 to superannuation, pensions, and aged care have served to erode Liberal support.
Median voters have the potential to decide election outcomes, but they can also shape policies. Since the parties identify them as key groups to appeal to, they are more likely to develop policies that the groups will find attractive. And if they win the election, then the party will implement the policies that the median voter favours. Kang and Powell (2010), for example, show that welfare policies are shaped by the preferences of voters, so that a shift to the left among voters will result in government policies aimed at bolstering social welfare, while a shift to the right will result in an opposite effect. In this way, the median voter may not only affect party strategy; she may affect the direction of public policy as well.
References
Aaronovitch, David (2009). Can Tories win over Holby Woman? Times, 28 July.
Australian Election Study (2016).The AES studies: 1993–2016. http://www.australianelectionstudy.org/voter_studies.html.
Brent, Peter (2004). Howard’s battlers: the electoral evidence. Paper presented to the Australasian Political Studies Association Conference, University of Adelaide, 29 September–1 October 2004.
Brett, Judith (1984). Menzies’ forgotten people. Meanjin 43(2), 253–65.
Burns, Sarah, Lindsay Eberhardt and Jennifer F. Merolla (2013). What is the difference between a hockey mom and a pit bull? Presentations of Palin and gender stereotypes in the 2008 presidential election. Political Research Quarterly 66(4), 687–701.
Cameron, Sarah and Ian McAllister (2016). Trends in Australian political opinion, 1987–2016. Canberra: ANU. http://australianelectionstudy.org.
Christophersen, Mariette (2010). David Cameron’s electoral strategy: a winning formula? British Politics Review 5, 7–8.
Congleton, Roger D. (2004). The median voter model. In The encyclopedia of public choice. Charles K. Rowley and Friedrich Schneider, eds. 25–42. London: Springer.
Downs, Anthony (1957). An economic theory of democracy. New York: Harper.
Dyrenfurth, Nick (2005). Battlers, refugees and the republic: John Howard’s language of citizenship. Journal of Australian Studies 28(1), 183–96.
Goot, Murray and Ian Watson (2006). Are aspirationals different? Paper presented to the Australasian Political Studies Association Conference, University of Newcastle, 25–27 September 2006.
Goot, Murray and Ian Watson (2007). Explaining Howard’s success: social structure, issue agendas and party support, 1993–2004. Australian Journal of Political Science 42(2), 253–76.
Greenfield, Cathy and Peter Williams (2001). ‘Howardism’ and the media rhetoric of ‘battlers’ vs ‘elites.’ Southern Review 34(1), 32–44.
Grofman, Bernard (2004). Downs and two party convergence. Annual Review of Political Science 7, 25–46.
Holcombe, Randall G. (1989). The median voter model in public choice theory. Public Choice 61(1), 115–25.
Kang, Sin-Goo and G. Bingham Powell (2010). Representation and policy responsiveness: the median voter, election rules, and redistributive welfare spending. Journal of Politics 72(4), 1014–28.
Mackerras, Malcolm and Ian McAllister (1999). Compulsory voting, party stability and electoral advantage in Australia. Electoral Studies 18(2), 217–33.
Manning, Haydon (2005). ‘Aspirational voters’ and the 2004 federal election. Australian Review of Public Affairs. http://www.australianreview.net/digest/2005/07/manning.html.
Manning, Haydon (2014). Voters and voting. In Government and politics in Australia. Alan Fenna, Jane Robbins and John Summers, eds. 79–97. Sydney: Pearson.
McAllister, Ian (2017). Howard’s battlers and the 1996 election. In The ascent to power, 1996: the Howard government, vol. 1. Tom Frame, ed. 80–95. Sydney: UNSW Press.
Moran, Joe (2005). The strange birth of middle England. Political Quarterly 76(2), 232–40.
Pickard, Jim (2010). British parties in election drive to track down Motorway Man. Financial Times, 22 January. Available at http://on.ft.com/2x6w6ze.
Scalmer, Sean (2005). Searching for the aspirationals. Overland 180, 5–9.
Singleton, Jeff, Paul Martyn and Ian Ward (1998). Did the 1996 federal election see a blue-collar revolt against Labor? A Queensland case-study. Australian Journal of Political Science 33(1), 117–30.
1 The OED defines an aspirational voter as ‘A voter whose primary concern is the achievement of personal success and material gain.’
2 Another new entry in the 2016 edition relevant here is ‘mortgage belt’, which is defined as ‘an area where many people are paying off a mortgage on their home, regarded as electorally volatile.’ These themes are also explored in relation to the 1996 federal election in McAllister (2017). The current chapter also draws on parts of this work.
3 The Coalition gained 91 seats in the 1975 election, based on a total of 127 seats, which represents a larger proportion of the total. Labor lost 5.1 per cent of its two-party vote in 1996 and recorded its lowest primary vote since 1934.
4 ‘Selsdon Man is designing a system of society for the ruthless and the pushing, the uncaring. His message to the rest is “you’re out on your own.”’ http://www.bbc.com/news/election-2015-england-32212380.
5 Goot and Watson (2006, 2; see also Goot and Watson 2007) present similar data from 1999 to 2004 using the term ‘aspirational’ in conjunction with the terms ‘Latham’ and ‘Howard.’ They show a steady increase in the use of the term, particularly for Howard. The term ‘battler’ is rarely used in Britain, hence the graph is restricted to estimating the frequency of ‘aspirational.’
6 This estimate is based on the question: ‘Would you have voted in the election if voting had not been compulsory?’ In 2013, 14 per cent of the respondents said that they ‘probably’ or ‘definitely’ would not have voted under a voluntary system.
7 The estimate is based on the 2005 Australian Survey of Social Attitudes.
8 The AES has consistently asked another question on support for the redistribution of wealth. However, this does not include any reference to the role of government in achieving redistribution.
9 Around one in three of the electorate take an intermediate position. (See Cameron and McAllister 2016.)
10 The correlation between the two items is also negligible, r = .051 (p = .034).
11 The categories are defined as follows. Strongly aspirational: strongly favours reducing tax, and strongly agrees with stricter union laws. Aspirational: strongly favours reducing tax and agrees with stricter union laws, or mildly favours reducing tax and strongly favours stricter union laws, or mildly favours reducing tax and favours stricter laws. Collectivist: strongly or mildly favours reducing tax and strongly disagrees or disagrees on stricter union laws. Indifferent: all others who do not fall into the three categories above.
12 The 1990 AES did not include a family income question, and the 1987 survey did not include the trade union question. Hence the starting year for the analysis is 1993.
13 http://australianpolitics.com/1996/03/13/andrew-robb-the-1996-federal-election.html.
14 In the 2010 AES, battlers were more likely to rank Rudd higher than Gillard (4.7 and 4.3 on the 0 to 10 thermometer scale, respectively). In turn, just 17 per cent of battlers approved of Rudd’s replacement by Gillard, compared to 18 per cent of aspirationals and 33 per cent of collectivists.