7
No steps further! Australian attitudes to ‘the right of free assembly’ in comparative perspective
No steps further! Attitudes to ‘the right of free assembly’
The right of peaceful assembly shall be recognized. No restrictions may be placed on the exercise of this right other than those imposed in conformity with the law and which are necessary in a democratic society in the interests of national security or public safety, public order (ordre public), the protection of public health or morals or the protection of the rights and freedoms of others.
Article 21, International Covenant on Civil and Political Rights
After the experiences of the atrocities of the Second World War committed by totalitarian regimes, the United Nations came together and declared several basic human rights. This Human Rights Charter includes the freedom to express one’s opinion and the freedom of assembly and association. These rights were re-enforced in 1966 in the International Covenant on Civil and Political Rights, which was signed by Australia in 1972 and ratified in 1980 (see https://bit.ly/1lEGjfc). In total, this treaty is now ratified by 168 countries and signed by another seven. Only 22 states have not signed, a group that includes countries such as Saudi Arabia, Malaysia and South Sudan.
The freedom of assembly and speech is a human, political, and civil right (Barendt 2005). Yet, one of the big questions in comparative sociology is if the content of such institutions is also reflected in the public attitudes and views of citizens. What do individuals think about public protesters who express extreme opinions? What are the boundaries of the freedom of assembly and freedom of speech in people’s views? Such questions are not only of academic interest, but are also of immediate relevance for politics, given that many countries have seen a resurgence of protests by religious extremists, racists and totalitarian groups.
Recently, Australia has seen a number of protests from groups that oppose an ‘Islamisation’ of the country and try to reclaim a ‘white’ Australia. Among the supporters of this movement is the street protest group United Patriots Front and the voters of the right-wing political parties One Nation and Rise Up Australia. These rallies were frequently accompanied by counter-protests from various anti-racism groups, which have led to some violent conflicts (for example in June 2016 in Melbourne1). At the same time, the 20-year-old Section 18C of the Racial Discrimination Act came under discussion because liberal politicians considered it a threat to free speech in Australia. Section 18C aims to protect people and particularly minorities from public humiliation and thus penalises ‘racial vilification’ or ‘hate speech’ (McNamara 2016).
Given these developments, this chapter investigates to what extent Australians are open to protests of extremist groups and also compares their attitudes to public opinion in other countries. We use the 2014 Citizenship Module fielded as part of the International Social Survey Programme (ISSP) (see ISSP Research Group 2016) which was fielded in Australia as part of the Australian Survey of Social Attitudes (2014) and in similar general social surveys in a total of 34 countries.It includes three questions on the right of assembly of three groups: religious extremists, people who want to overthrow the government, and groups who are prejudiced against any racial or ethnic group. These three items are at the centre of our analysis and we refer to them collectively as the ‘acceptance of the freedom of assembly’.
When considering possible influences on this ‘acceptance’ of the freedom of assembly, we draw on the closely related literature on social and political tolerance and further consider the impact of economic and social-psychological factors. These include institutional arrangements such as democratic experience, the effect of international civil society, and political rhetoric, as well as economic circumstances and group threat. The next section thus offers an overview of these various theoretical backdrops, which is then followed by a description of our data sources, variables, and analytical strategy. The results section starts with a comparison of the acceptance of the freedom of assembly of extremists in Australia to that in other countries. This international overview is followed by an Australia-specific analysis that shows which social groups are particularly opposed or in favour of these rights. The discussion and conclusion section then relates our findings to the existing literature.
Political and social tolerance
Political tolerance is a fundamental precondition of liberal democracies and implies that political minorities ‘must be given the means of contestation – the right to try to convince others of the rightness of their positions’ (Gibson 2013). From this point of view citizens should tolerate the freedom of assembly for extremist groups. However, philosophers such as Karl Popper (1945) emphasised the paradox of tolerance, namely that limitless ‘tolerance of intolerance’ in the long run will lead to the disappearance of tolerance.
When considering the literature on political and social tolerance, we can distinguish a more ‘materialistic’ and a more ‘cultural/ideational’ conceptualisation of this question (see Figure 7.1). While the former emphasises social and psychological forces such as economic circumstances and threat from different groups, the latter focuses upon the role of institutions such as democratisation, party positions, and international ideas. Our review starts with a brief summary of the former.
Figure 7.1 Explanatory approaches to social and political tolerance.
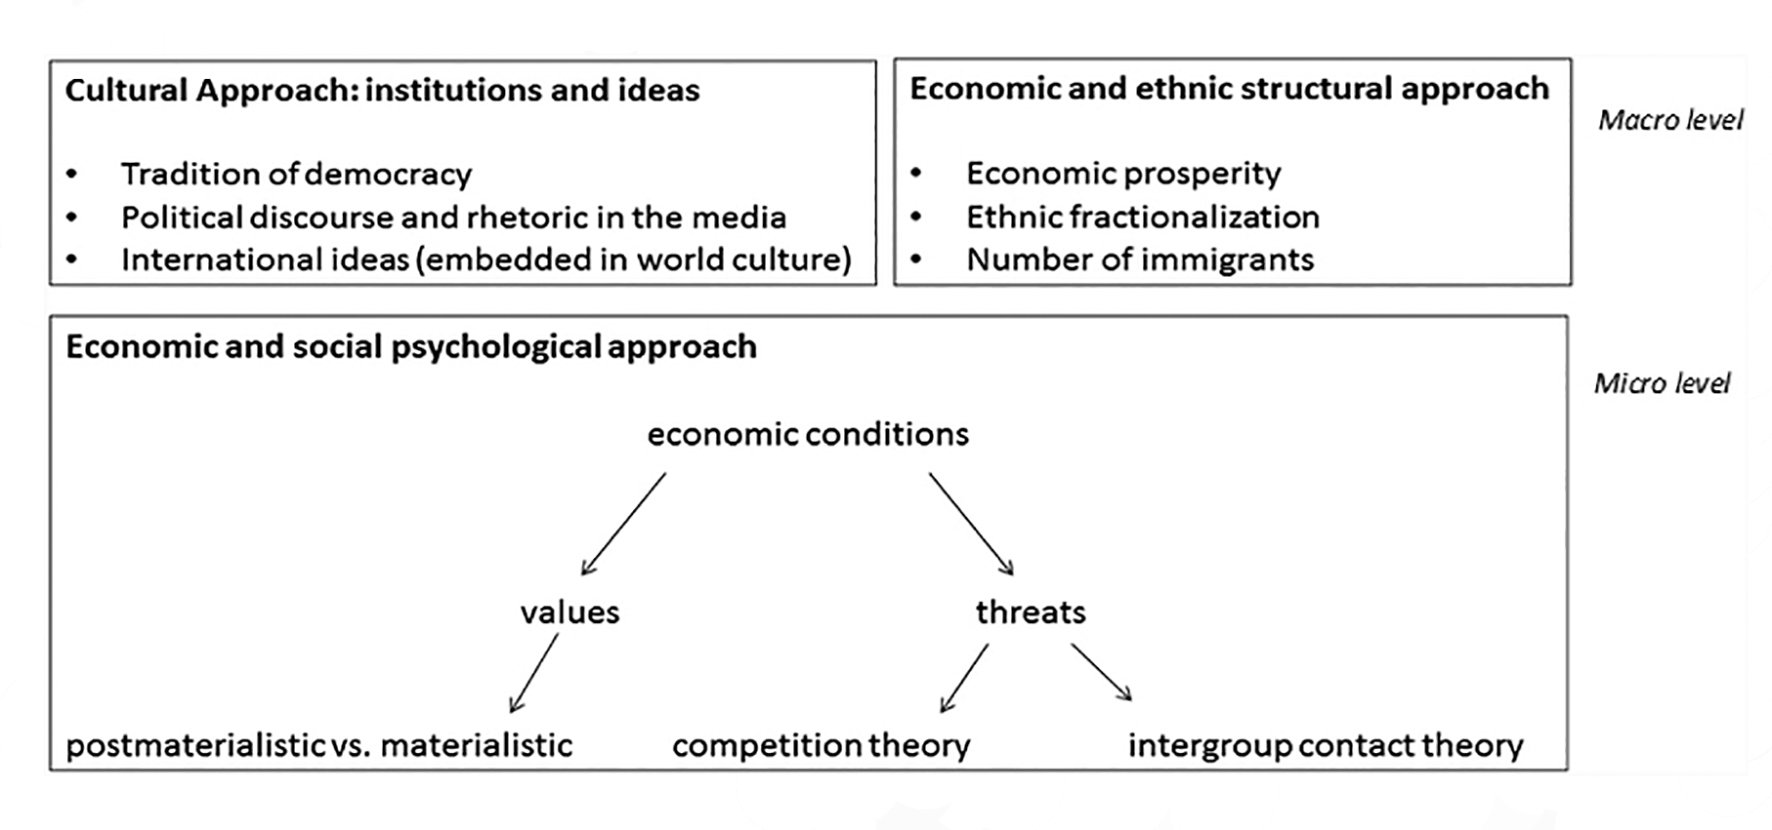
Group threat and economic circumstances
At a very basic level, the role of economic development and affluence is considered in the postmaterialism thesis (Inglehart and Baker 2000; Inglehart and Welzel 2005). This thesis asserts that individuals develop postmaterialist values once a sufficient level of economic security is achieved, whereas individuals who experience scarcity maintain materialistic values. Inglehart (1999) considers this economic insecurity conducive to xenophobia and authoritarian attitudes, while postmaterialists value diversity and emphasise self-expression. Social and political tolerance as well as acceptance of democratic norms are thus supposed to be more common among postmaterialists.
The role of economic circumstances is also considered within the approaches emphasising group threat. Group threat theory and competition theory in the field of ethnic and racial relations point out that antagonism is more likely when different groups rival for limited resources (Blumer 1958; Quillian 1995). The perceived threat depends on the size of the other group; further, other groups are more likely to be seen as a threat during periods of economic hardship (Persell, Green and Gurevich 2001).
Alternatively, intergroup contact theory postulates positive effects of intergroup contact on tolerance. These effects, however, occur only if, among other conditions, intergroup interaction is sanctioned by authorities, law, or custom (Allport 1954; Pettigrew 1998; Pettigrew and Tropp 2011). Both prejudices against racial or ethnic groups and social interactions with people from other ethnicities are more likely in ethnically heterogeneous societies. In this regard previous research has shown that social interactions of people from diverse ethnicities contribute to an increase in interpersonal trust (Stolle et al. 2008).
In sum, we can expect that affluence fosters the acceptance of the freedom of assembly while economic hardship will result in less acceptance. As for contact with other groups, two contrary effects have been postulated within group threat and intergroup contact theory. As will be pointed out in the following section, political rhetoric and ideas might be intervening factors that shape individual reactions to the presence of other groups and their activities.
The role of institutional and ideational factors
The most basic institutional factor in creating political tolerance is the level of democratisation. Democracies are built on the idea of free speech and expression of opinion. In a democracy, individuals are thus constantly exposed to varying views and opinions. Following Peffley and Rohrschneider (2003), such exposure can result in learning effects and attitudinal change, and will lead to a higher level of tolerance and greater acceptance of opposing opinions and possibly political actions.
Within democracies, political players, and here, particularly parties and mass media, are said to influence group relations (Allport 1954; Blumer 1958). Political rhetoric may affect normative conceptions in three ways (Bohmann 2011): it may reinforce or mitigate symbolic boundaries arising from longer-standing institutional frameworks or exogenous processes such as economic prosperity; it may increase the visibility of diversity; and it may bring ethnocentric views into the sphere of acceptance. Party rhetoric thus may make things acceptable to say, e.g. due to freedom of speech, due to protection of minorities, or due to concerns about safety or public order. In addition, we would also expect that individuals in countries with more political rhetoric on issues of diversity are more likely to show more openness and thus are also accepting of meetings of extremists. However, depending on how groups are portrayed, media reports may also reinforce existing stereotypes and lead to divisions within societies.
Finally, we also need to consider the international environment. As pointed out in the introduction, human rights, among them the right of free assembly, became increasingly important after 1945. This intergovernmental network has been accompanied by a more influential civil society of NGOs and various other groups (Boli and Thomas 1999). Together, they form an institutional skeleton, which furthers the spread of global ideas such as human rights. The underlying rationale across these different realms is that rights are extended to individual actors and not assigned to specific social groups. Local actors then more frequently align with the associated cultural models (Meyer et al. 1997; Hafner-Burton and Tsutsui 2005) – through this process, there is an increasing emphasis on individual rights such as freedom of opinion. Given that such international models are diffused through international associations, we would expect that individuals who are more exposed to global cultural models, through individual characteristics or by residing in a country that has greater linkages to international society, should be more accepting of assembly rights.
Methods and data
The empirical analysis is based on public opinion data collected by the International Social Survey Programme (ISSP) in 2014 (ISSP Research Group 2016). Data was gathered in 34 countries (when distinguishing between East and West Germany), resulting in a total sample size of 49,807 respondents (see Table 7.1 for an overview). The surveys are random samples, were collected in face-to-face or mail interviews, and are representative for the adult population of each country.
Our dependent variable – the acceptance of the freedom of assembly – is derived from a battery of questions on political tolerance towards three different groups. Respondents were asked:
- Should religious extremists be allowed to hold public meetings?
- Should people who want to overthrow the government by force be allowed to hold public meetings?
- Should people prejudiced against any racial or ethnic group be allowed to hold public meetings?
The response categories are: Should definitely be allowed; Should probably be allowed; Should probably not be allowed; Should definitely not be allowed; and Cannot decide.
Independent variables for the entire sample
We considered the following items as independent variables:
- Aspects of group threat and economic position are considered by the following items: a) respondent income (in various brackets, plus a dummy variable for those who do not have any income or didn’t report their income); b) work status (working for pay, unemployed, disabled, in training or mandatory services, retired, housemaker, and others); and c) immigration background, which considers the place of birth of the respondents and their parents (Australia, English-speaking countries, and non-English-speaking countries or being Aboriginal or Torres Strait Islander).
- Religious denomination is also included, and measured by subjective belonging to the major religious groups.
- The number of contacts is captured by an item asking respondents how many people they are in contact with each day, with answer possibilities 0–4, 5–9, 10–19, 20–49, and 50 or more. This ‘social contact’ is an indicator of social trust and might relate to a higher level of tolerance.
- Education can be related to group threats, as the type and degree of threats change with educational attainment. Education, however, is also a proxy for exposure to global cultural models. It is measured in the various national degrees. The other indicators of exposure to world society are age and residency due to the stronger exposure to global cultural models among younger groups and urban dwellers. Age is measured in years and residence captured by categories ranging from a large city to a rural area and the state (or territory) of residency. As the rhetoric of parties differs vastly between left- and right-wing parties, we also consider the respondents’ reported party preference at the last federal election. Finally, gender is included as an additional control variable.
Independent variables at the country level
Economic circumstances and ‘threat’ due to immigration are captured by the level of prosperity and the size of the immigrant population. National prosperity is captured by GDP (in US$1,000) drawn from the World Bank (2016). Immigration numbers are based on UN-collected data at the time or shortly before the ISSP surveys were conducted (United Nations, Department of Economic and Social Affairs 2015). Immigration levels are measured as the size of the immigrant population as a percentage of the country’s whole population. Immigration numbers for Taiwan were taken from the webpage of the National Immigration Agency (Ministry of Health and Welfare 2016).
We measure multicultural policies with the Multiculturalism Policy Index (MCP) by Banting and Kymlicka (2013), which captures several important conceptions of citizenship. The MCP provides a measure of multiculturalist accommodation policies ‘designed to recognize, accommodate and support the cultural differences of minority groups’ (Banting and Kymlicka 2013, 583). To construct the index, the authors scored and aggregated indicators of multicultural policies across areas such as education, media, and culture as either 0 (no such policy), 0.5 (partial) or 1 (clear policy).
A country’s ethnic ‘fractionalisation’ was captured by an index developed from James D. Fearon, who identifies 822 ethnic groups in 160 countries (2003, 204). He defines ethnic fractionalisation as ‘the probability that two individuals selected at random from a country will be from different ethnic groups’ (Fearon 2003, 208). If a country is ethnically homogeneous, the value of the index will be 0; if there are two groups, one makes up 95 per cent and the other 5 per cent of the population, the value will be 0.10; if there are three groups, each with 33 per cent, the index is 0.67, and so forth. Thus, the index of ethnic fractionalisation covers the population shares of ethnic groups and not only the number of groups. Analogous to the measure of ethnic fractionalisation, Fearon provides a measure of cultural fractionalisation that focuses on the ‘cultural proximity’ of the spoken languages within a country. ‘In a country with a large number of groups that speak structurally unrelated languages, the expected resemblance will be closer to zero’ (Fearon 2003, 212).
In order to measure a country’s tradition of democracy we used data from the Polity IV Project (Marshall et al. 2010). The project ‘examines concomitant qualities of democratic and autocratic authority in governing institutions, rather than discrete and mutually exclusive forms of governance’. In order to account for the diverse traditions of democratisation, or, more concretely for first, second and third waves of democratisation (Huntington 2012), we consider a country’s democratic experience in the course of the last 50 years. Thus, a country’s democratic tradition includes the number of years between 1960 and 2010 in which it was democratic or autocratic with the underlying scale ranging from -10 to +10. We transformed the data into a ten-point scale (1 means autocratic and 10 means democratic).
Complementary to a country’s democratic tradition in the broader sense, the degree of non-institutionalised participation in the narrower sense was included in the analysis. Non-institutional participation regards the number of people who indicate ‘having signed petitions’ and ‘attended lawful demonstrations’. Data stems from the Democracy Barometer (Merkel et al. 2016) which uses weighted survey data from different sources (e.g. European Social Survey, Comparative Study of Electoral Systems, International Social Survey).
As for political rhetoric, we use data from the Comparative Manifesto Project (CMP, Volkens et al. 2015), which codes quasi-sentences of party manifestos for negative/positive stances towards a variety of policy dimensions. Civic rhetoric is captured by manifestos’ positive references to equality (category 503), civic mindedness (606), and multiculturalism (607). Ethnic rhetoric covers positive references to national way of life (601) and traditional morality (603) as well as negative references to multiculturalism (608). We calculated the average salience per party for the respective elections before 2014 for civic and ethnic rhetoric and the combined index considering both dimensions.
Ties to world society are measured by ‘the number of organizations of which a country or territory is a member, whether directly or through the presence of members in that country’ (UIA 2014, 45). World society scholars consider this variable a proxy for embedding in a world culture. It was taken from the Yearbook of International Organizations (Union of International Associations various years) and logged.
Results
Table 7.1 presents an overview of attitudes towards the freedom of assembly for our three different groups and the overall measure of an index considering all three items for all countries that fielded the 2014 ISSP survey. Table 7.1 also presents the level of acceptance in the previous survey of 2004, and the change over the subsequent ten years, for those countries that took part in both waves. The countries are sorted according to the overall level of political acceptance in 2014 (or 2004 in case the 2014 data is not available).
Table 7.1: Acceptance of the freedom of assembly across countries and over time (higher score=more accepting).
| Country | Religious extremists | Overthrow govt | Racists | Overall 2014 | Overall 2004 | Change in overall |
|---|---|---|---|---|---|---|
| US-USA | 3.00 | 2.09 | 2.21 | 2.41 | 2.35 | 0.06 |
| IL-Israel | 2.64 | 1.91 | 1.98 | 2.18 | 2.15 | 0.03 |
| PH-Philippines | 2.85 | 1.79 | 1.77 | 2.13 | 1.92 | 0.21 |
| IS-Iceland | 2.16 | 2.31 | 1.96 | 2.13 | NA | NA |
| IN-India | 2.71 | 1.79 | 1.83 | 2.12 | NA | NA |
| ZA-Sth Africa | 2.45 | 1.92 | 1.96 | 2.11 | 1.90 | 0.21 |
| SE-Sweden | 2.41 | 1.71 | 2.11 | 2.06 | 1.78 | 0.28 |
| GE-Georgia | 1.99 | 1.95 | 1.92 | 1.96 | NA | NA |
| DK-Denmark | 2.05 | 1.77 | 1.95 | 1.92 | 1.81 | 0.11 |
| VE-Venezuela | 2.65 | 1.59 | 1.48 | 1.90 | 1.82 | 0.08 |
| NO-Norway | 1.96 | 1.67 | 2.04 | 1.89 | 1.94 | -0.05 |
| CZ-Czech Republic | 1.92 | 1.84 | 1.80 | 1.85 | 1.74 | 0.11 |
| FI-Finland | 2.24 | 1.34 | 2.01 | 1.80 | 1.86 | -0.06 |
| KR-Korea (Sth) | 1.87 | 1.71 | 1.82 | 1.80 | 1.84 | -0.04 |
| AU-Australia | 1.91 | 1.60 | 1.88 | 1.80 | 1.68 | 0.12 |
| TW-Taiwan | 2.03 | 1.56 | 1.75 | 1.78 | 1.73 | 0.05 |
| PL-Poland | 1.78 | 1.88 | 1.63 | 1.78 | 1.78 | 0 |
| SK-Slovak Rep | 1.65 | 1.93 | 1.73 | 1.77 | 1.71 | 0.06 |
| LT-Lithuania | 1.75 | 2.00 | 1.48 | 1.75 | NA | NA |
| HU-Hungary | 1.81 | 1.73 | 1.68 | 1.74 | 1.46 | 0.28 |
| GB-Great Britain | 1.79 | 1.63 | 1.76 | 1.73 | 1.84 | -0.11 |
| HR-Croatia | 1.62 | 1.83 | 1.52 | 1.66 | NA | NA |
| FR-France | 1.65 | 1.64 | 1.62 | 1.64 | 1.63 | 0.01 |
| SI-Slovenia | 1.60 | 1.72 | 1.46 | 1.61 | 1.82 | -0.21 |
| CH-Switzerland | 1.64 | 1.50 | 1.58 | 1.58 | 1.52 | 0.06 |
| ES-Spain | 1.78 | 1.46 | 1.41 | 1.55 | 1.55 | 0.00 |
| CL-Chile | 1.74 | 1.40 | 1.43 | 1.52 | 1.41 | 0.11 |
| DE-Germany | 1.53 | 1.38 | 1.56 | 1.50 | 1.41** | 0.09 |
| JP-Japan | 1.51 | 1.37 | 1.53 | 1.47 | 1.41 | 0.06 |
| AT-Austria | 1.32 | 1.34 | 1.56 | 1.41 | 1.32 | 0.09 |
| BE-Belgium | 1.38 | 1.36 | 1.46 | 1.40 | 1.39 | 0.01 |
| TR-Turkey | 1.49 | 1.35 | 1.35 | 1.40 | NA | NA |
| NL-Netherlands | 1.50 | 1.19 | 1.48 | 1.39 | 1.48 | -0.09 |
| RU-Russia | 1.37 | 1.34 | 1.37 | 1.36 | 1.48 | -0.12 |
| Total | 1.93 | 1.66 | 1.71 | 1.77 (1.75*) | 1.70 | 0.05 |
2014: Total N= 49,807; Australia: N=1,432; Sample range: N=899 (Sweden) to N=3,124 (South Africa).
2004: Total N=52,550; Australia: N=1,914, Sample range: N=853 (Great Britain) to N=2,784 (South Africa).
Source: International Social Survey Programme (ISSP) 2014.
Notes: * countries that took part in both waves, ** average of East and West Germany.
1=Definitely not allowed to have a meeting to 4=Definitely allowed to have a meeting.
The mean values represent the average answer to the question of whether or not these groups are supposed to be allowed to hold public meetings, with a reversed order so that 4 represents ‘definitely allowed’, 3 ‘probably allowed’, 2 ‘probably not allowed’, and 1 ‘definitely not allowed’. A higher value represents more acceptance of such assemblies. Considering the three different extremist groups and the averages across countries, people who would like to overthrow the government are the least tolerated, followed by racists and religious extremists. The averages are around 2, closest to the answer ‘probably not allowed’.
Considering the ranking of our countries in Table 7.1, the lowest level of acceptance can be found in Russia, followed by the Netherlands, Turkey and Belgium. The highest level of acceptance can be reported for the United States, followed by Israel, the Philippines and Iceland. Australia lies in the middle of all considered countries, with an average value of 1.8 in 2014. Comparing the acceptance of the freedom of assembly for the three different social groups in Australia, people who would like to overthrow the government are the least tolerated, followed by racists and religious extremists. As for the change over time, comparing the overall level of acceptance in 2014 and 2004 indicates a small shift towards more tolerance. The average across country means is 1.77 in 2014 (1.75 when considering only countries that took part in both waves) and 1.70 in 2004. The change is thus a minor shift towards more tolerance of 0.05. Yet, a paired sample t-Test using the country means indicates that this change is significant. With a mean change of 0.12 in this period, the acceptance of the freedom of assembly increased by an above-average amount in Australia. Australians thus have become more tolerant over time than the average respondent in most other countries.
This descriptive overview raises a few further questions. Our basic idea that political tolerance and the acceptance of the right of assembly should be higher in consolidated democracies is certainly not supported. Some Western democracies such as the US, Iceland and Denmark are among the most open societies, but the populaces of the Netherlands, Belgium and Austria are among the least supportive, as far as the freedom of assembly for extremist groups is concerned. A possible explanation is differences in the inclusion of individuals in their polities (Schofer and Fourcade 2001). While the US places a lot of emphasis on individual participation, demands and actions, the latter countries are rather state-centred societies, with little preference for individual demands and actions. This fundamental difference might also affect the tolerance towards individual actions such as protests.
Further, considering the changes over time in the least accepting European countries, the level of rejection of these freedoms was high in 2004 as well; only in the Netherlands did it improve over the last decade. This stability points to the influence of more steady societal characteristics such as the aforementioned differences in the integration of the individual into the polity. It also shows that explanations pointing to the influence of recent political developments and terror threats in Europe as a cause of a high scepticism towards public protesters who express extreme opinions do not seem to apply.
Given these questions, the following analysis considers other influences on public opinion in this area, particularly the role of institutions and social structures (such as the level of immigration, economic circumstances, political rhetoric, etc.) that might have an influence on citizens’ attitudes toward the freedom of assembly. For the purposes of simplicity, only the overall acceptance index averaging all three groups and the latest wave from 2014 are considered. Table 7.2 displays the results of this analysis as correlations between the average level of acceptance and the societal characteristics related to the theories we discussed in the first section of this chapter.
Table 7.2: Correlation between the average national acceptance of freedom of assembly for extremist groups in 2014 and country characteristics.
| Acceptance 2014 | Acceptance 2004 | Affluence (GDP) | Immigration | INGOs* | Democracy score | Non-institutional participation** |
| 1.00 | 0.90 | -0.13 | 0.00 | -0.24 | 0.07 | 0.03 |
| Multicultural policy | Ethnic rhetoric | Civic rhetoric | Overall rhetoric | Ethnic fractionalisation | Cultural fractionalisation | |
| 0.28 | -0.08 | 0.15 | 0.03 | 0.31 | 0.18 |
N=34. Source: ISSP 2014.
Notes: * International Non-Governmental Organisation, ** Non-institutional participation includes ‘having signed petitions’ and ‘attended lawful demonstrations’.
The strongest effects can be found among indicators that are related to societal heterogeneity such as ethnic fractionalisation. The correlation between these factors and the acceptance of the freedom of assembly for extremist groups is around a moderate -0.3. Therefore, acceptance is higher in societies which are characterised by strong ethnic fractionalisation. This result supports the intergroup contact theory. Multicultural policies, and to a lesser extent a civic rhetoric in party programs, foster the acceptance of the freedom of assembly for extremist groups. However, the size of the immigrant population does not have any verifiable effect. Hence, attitudes toward freedom of assembly for extremist groups seem to depend on the proportion of ethnic groups within societies as well as on the concrete policies addressing multicultural issues and the political discourse within countries.
The findings further indicate that a country’s democratic experience has no verifiable effect on people’s acceptance of the freedom of assembly for extremist groups. However, non-institutionalised forms of democracy do explain country differences. The acceptance of freedom of assembly for extremists is higher the more common non-typical forms of participation are. Thus, the classical institutional approach of the tradition of democracy fails to explain cross-country differences, whereas a wider practice of non-institutional forms of democracy (‘having signed petitions’ and ‘attended lawful demonstrations’) goes hand in hand with a higher acceptance of the freedom of assembly for extremist groups. Moreover, the refusal of the freedom of assembly for extremists is somewhat lower in less affluent societies, a result that contradicts the general assumptions of the competition theory on the macro-level. Also contrary to expectations, a stronger integration in global cultural models is associated with lower acceptance of public meetings by extremists.
Table 7.3: Structural and cultural characteristics of Australia compared to 33 countries.
| Australia | Other countries minimum value | Other countries maximum value | |
|---|---|---|---|
| Affluence (GDP per capita) | 65,400 | 5,500 | 67,300 |
| International Non-Governmental Organisation (number) | 6,167 | 1287 | 11,754 |
| Democracy score (10-point scale) | 10 | 2 | 10 |
| Non-institutional participation (%) | 84.1 | -2.2 | 92.4 |
| Immigration (%) | 23 | 0.2 | 26.5 |
| Multicultural policy (0 to 1) | 8 | 0 | 8 |
| Ethnic rhetoric (0–15) | 11.8 | 0.1 | 15.2 |
| Civic rhetoric (0–18) | 11.4 | 3.3 | 14.8 |
| Overall rhetoric (0–26) | 23.3 | 3.7 | 26.1 |
| Ethnic fractionalisation (0 to 1) | 0.15 | 0 | 0.9 |
| Cultural fractionalisation (0 to 1) | 0.15 | 0 | 0.7 |
Source: See methods and data section.
Before we continue with the analysis of the internal dynamics in Australia, we briefly summarise the country’s relative position in terms of its structural and cultural characteristics (see Table 7.3). Australia is an affluent, democratic, and multicultural society with a distinct ethnic and civic rhetoric in party programs. Although the number of immigrants in Australia is high, ethnic and cultural distance between the major social groups is rather low according to the used index. Finally, the number of people signing petitions and attending lawful demonstrations is very high in Australia.
After considering the associations at the country level, we now turn to the differences among Australians. These further analyses of micro-factors are needed to understand to what extent competition theory and/or intergroup contact theory explain differences in the acceptance of the freedom of assembly for extremist groups. Also, in face of the distinct effect of multicultural policy, the impact of political orientations on the micro-level should contribute to a deeper understanding of the country-comparative findings.
Acceptance of the freedom of assembly among Australians
After situating Australia in a global context and a brief consideration of potentially influential country-level factors, this section now turns towards differences among Australians. For this purpose, the sample was limited to Australian respondents and analysed using a general linear regression. The dependent variable is a mean index of the three different items on the freedom of assembly. It includes a total of 1,112 respondents out of 1,432, due to missing responses for some of our core variables.
The independent variables included all the variables mentioned in the methods section. However, it turns out that the model effects are not significant for residency in the different Australian states and territories, religious denomination, work status, age, income and the frequency of contact with other people. For the sake of brevity, these variables are only mentioned at the bottom of Table 7.4, whereas the significant effects are reported in more detail.
Table 7.4: Effects of individual characteristics on the acceptance of the freedon of assembly (Australia only, Generalized Linear Model, Maximum Likelihood estimation).
| Parameter | B | Std Error | Sig. |
|---|---|---|---|
| Socio-demographics | |||
| Female | -.18 | .05 | .00 |
| Highest completed degree of education | .03 | .01 | .01 |
| Aboriginal or Torres Strait Islander (ATSI) | .39 | .18 | .03 |
| Born in non-English speaking country | .19 | .07 | .01 |
| Australian-born # | Ref | . | . |
| Politics | |||
| Liberal Party | -.16 | .15 | .28 |
| National Party | -.26 | .19 | .16 |
| Labor Party | -.11 | .15 | .44 |
| Independent candidate | .46 | .22 | .04 |
| Greens | .32 | .15 | .04 |
| No party preference ## | Ref | . | . |
| Location | |||
| Farm | -.18 | .10 | .06 |
| Village | -.11 | .10 | .26 |
| Town | -.18 | .07 | .02 |
| Suburbs | -.19 | .07 | .00 |
| Big city | Ref | . | . |
Source: ISSP 2014, Australian cross-section only (fielded as part of Australian Survey of Social Attitudes 2014).
Notes: Dependent variable: mean index on acceptance of freedom of assembly.
Variables also included, but not significant: country-specific regions (states and territories), religious affiliation, work status, income, age, and contact with other people: Australia.
# ‘No information on parents’, ‘born in English-speaking country’, and ‘born in Australia but parents from abroad’ do not differ from reference group and are not shown.
## All other party preferences do not differ from reference group (with exception of negative effect of Animal Justice Party, but only a single respondent) and are not shown.
Migration background, party preference, gender, education, and location (urban versus rural) all have a significant effect on the acceptance of the freedom of assembly for extremist groups. Respondents who were born outside Australia in a non-English speaking country, as well as Aboriginal and Torres Strait Islander peoples, report being more accepting of assemblies than the reference group of Australian-born (excluding Aboriginal and Torres Strait Islander peoples). Party preference also matters – those respondents who voted for an independent candidate, as well as Green voters, are also more accepting than voters for the Liberals, the National Party, and Labor, with differences between these three main parties not significant when compared to the reference group of ‘no party preference’. In addition, women are less accepting of extremists, whereas better-educated respondents and those who live in urban areas are more willing to allow assemblies of such groups.
These findings point to two distinctive reasons for tolerance. On the one hand, underrepresented groups are more open to the freedom of assembly, possibly due to their own lack of political efficacy and the need to use this means of protest for their own cause. On the other hand, individuals in privileged social positions – such as highly educated respondents – are more open to the freedom of assembly as well. Here, ideological commitment to freedom, rather than a lack of efficacy, may be at work.
Conclusion
This chapter considers political tolerance in the form of accepting assemblies of religious extremists, people who want to overthrow the government, and groups who are prejudiced against racial or ethnic groups. It thus touches on an important social philosophical problem: the tension between the democratic toleration of extremists and showing too much tolerance towards groups who would like to abandon democracy itself. In the introduction we emphasised the supremacy of the freedom of assembly as expressed in the International Covenant on Civil and Political Rights. In reality, most countries have set limits to this freedom, such as in case of criminal associations or when protests are violent. Yet there are clear cross-national differences in the extent and nature of regulation in this area.
The United States is among the most liberal countries and puts heavy emphasis on the right of assembly. This kind of tolerance is illustrated in the decision in National Socialist Party of America v Village of Skokie, where the Supreme Court ruled that the swastika did not constitute ‘fighting words’ and that the National Socialist Party was allowed to march through a Jewish neighbourhood. Another well-known group, the Ku Klux Klan, also often has public assemblies – in fact, right after the presidential election in 2016, it announced a parade to celebrate president-elect Donald Trump’s victory (Kaleem 2016). In line with this legal emphasis on freedom of assembly, our analysis has shown that US respondents are the most accepting when it comes to public meetings of extremist groups.
In Austria, by contrast, due to its fascist past, any public expression of pro-Nazi views or the public display of Nazi symbols is against the law (‘re-engagement in National Socialist activities’) and can lead to arrest. Yet, right-wing protests and assemblies do occur and are legal. Recently, however, the former Secretary of the Interior proposed to limit the right of assembly, for example, if protests interfere with economic interests. These few examples highlight some of the differences between Austria and the US, and help to explain why Austria is among the countries with the least acceptance of the right to free assembly. Beyond these specific circumstances, Austria also has low ethnic heterogeneity and non-institutional political participation, both factors that are associated with more tolerance towards assemblies.
Multicultural Australia, which has recently experienced numerous violent anti-immigration and anti-racist street protests, is placed in the middle in terms of political tolerance. Acceptance of the freedom of assembly for extremist groups is less pronounced in Australia compared to the US, but this freedom is more accepted in Australia than in, say, Austria or the Netherlands. On the one hand, recent calls to repeal laws on racial vilification and hate speech, as well as the electoral success of right-wing movements in Australia, indicate that freedom of assembly and speech are controversial issues. On the other hand, the results of this chapter show a slight increase in tolerance in Australia since 2004 as well as in the strength of policies addressing multicultural issues and the number of people who sign petitions and attend lawful demonstrations. Hence, the political and civic negotiation processes for ‘tolerating intolerance’ differ from other countries and provide interesting insights into Australian society. Further analyses (beyond this chapter) indicate the high priority that Australians place on the protection of minority rights, which are considered more important than the right to civil disobedience.
Noting Australia’s overall position in the middle of our survey group, there are still important differences among Australian respondents about these assemblies. Respondents who identify as Aboriginal or Torres Strait Islander, male respondents, better-educated individuals, urban dwellers, and Greens voters are all more in favour of allowing public assemblies of extremists. These findings indicate that underrepresented groups and groups following an ideology of political tolerance are least opposed to the freedom of assembly for extremists in Australia. Further results, beyond the analyses presented in this chapter, show that respondents who report to counter-act an unjust or harmful law by trend are more tolerant toward the freedom of assembly for extremist groups.
In sum, our international comparison of the acceptance of the freedom of assembly for extremist groups shows pronounced refusal in most countries, where a narrow line of ‘No steps further!’ is drawn, whereas a few countries are more open. The divide between countries seems, at first, erratic, given that classic indicators of affluence or duration of democracy do not explain cross-country variation. However, the degree of ethnic heterogeneity (and thus internal differences within countries) as well as the degree of use of non-institutionalised forms of democratic action turn out to be influential, and these factors offer more generalisable explanations than the local idiosyncrasies mentioned before. In short, ethnically heterogeneous countries in which policies directly address multicultural issues, and in which people are more prone to sign petitions and attend demonstrations, are also more willing to accept the freedom of assembly for extremist groups.
References
Allport, Gordon W. (1954). The nature of prejudice. Cambridge: Addison-Wesley Publishing Company.
Banting, Keith and Will Kymlicka (2013). Is there really a retreat from multiculturalism policies? New evidence from the multiculturalism policy index. Comparative European Politics 11(5), 577–98.
Barendt, Eric (2005). Freedom of speech. Oxford: Oxford University Press.
Blumer, Herbert (1958). Race prejudice as a sense of group position. The Pacific Sociological Review 1(1), 3–7.
Bohmann, Andrea (2011). Articulated antipathies: Political influence on anti-immigrant attitudes. International Journal of Comparative Sociology 52(6), 457–77.
Boli, John, and George M. Thomas (1999). Constructing world culture: international nongovernmental organizations since 1875. Stanford: Stanford University Press.
Fearon, James D. (2003). Ethnic structure and cultural diversity by country. Journal of Economic Growth 8(2), 195–222. doi: 10.1023/A:1024419522867.
Gibson, James L. (2013). Political tolerance in the context of democratic theory. The Oxford handbook of political science online. doi: 10.1093/oxfordhb/9780199604456.013.0021.
Hafner-Burton, Emilie and Kiyoteru Tsutsui. (2005). Human rights in a globalizing world: the paradox of empty promises. American Journal of Sociology 110(5), 1373–411.
Huntington, Samuel P. (2012). The third wave: democratization in the late 20th century. Vol. 4. Norman: University of Oklahoma Press.
Inglehart, Ronald (1999). Postmodernization brings declining respect for authority but rising support for democracy. In Critical citizens: global support for democratic government. Pippa Norris, ed. 236–56. Oxford: Oxford University Press.
Inglehart, Ronald and Wayne E. Baker (2000). Modernization, cultural change, and the persistence of traditional values. American Sociological Review 65(1), 19–51.
Inglehart, Ronald and Christian Welzel (2005). Modernization, cultural change, and democracy: the human development sequence. Cambridge: Cambridge University Press.
ISSP Research Group. 2016. International social survey programme: Citizenship II – ISSP 2014. GESIS Data Archive, Cologne. ZA6670 Data file Version 2.0.0, doi:10.4232/1.12590.
Kaleem, Jaweed (2016). The Ku Klux Klan says it will hold a Trump victory parade in North Carolina. Los Angeles Times, 10 November. http://www.latimes.com/nation/politics/trailguide/la-na-updates-trail-guide-kkk-trump-north-carolina-1478822255-htmlstory.html.
Marshall, Monty G., Keith Jaggers and Ted R. Gurr. (2010). Polity IV project: dataset. Political regime characteristics and transitions, 1800–2009. Vienna: Center for Systemic Peace.
McNamara, Luke (2016). What is Section 18C and why do some politicians want it changed? ABC News, 1 September. http://abc.net.au/news/2016-09-01/what-is-section-18c-and-why-do-some-politicians-want-it-changed/7806240.
Merkel, Wolfgang and Daniel Bochsler (project leaders); Karima Bousbah, Marc Bühlmann, Heiko Giebler, Miriam Hänni, Lea Heyne, Lisa Müller, Saskia Ruth and Bernhard Wessels (2016). Democracy barometer: codebook. Version 5. Aarau, Switzerland: Center for Democracy.
Meyer, John W., John Boli, George M. Thomas and Francisco O. Ramirez (1997). World society and the nation-state. American Journal of Sociology 103(1), 144–81.
Ministry of Health and Welfare (2016). Statistical yearbook of the interior: immigration. http://sowf.moi.gov.tw/stat/year/elist.htm#7.
Peffley, Mark and Robert Rohrschneider (2003). Democratization and political tolerance in seventeen countries: a multi-level model of democratic learning. Political Research Quarterly 56(3), 243–57.
Persell, Caroline Hodges, adam Green, and Liena Gurevich (2001). Civil society, economic distress, and social tolerance. Sociological Forum 16(2).
Pettigrew, Thomas F. (1998). Intergroup contact theory. Annual Review of Psychology 49, 65–95.
Pettigrew, Thomas F. and Linda R. Tropp (2011). When groups meet: the dynamics of intergroup contact. New York: Psychology Press.
Popper, Karl (1945). The open society and its enemies. London: Routledge & Sons.
Quillian, Lincoln (1995). Prejudice as a response to perceived group threat: population composition and anti-immigrant and racial prejudice in Europe. American Sociological Review 60, 586–611.
Schofer, Evan and Marion Fourcade-Gourinchas (2001). The structural contexts of civic engagement: voluntary association membership in comparative perspective. American Sociological Review 66, 806–28.
Stolle, Dietlind, Stuart Soroka and Richard Johnston (2008). When does diversity erode trust? Neighborhood diversity, interpersonal trust and the mediating effect of social interactions. Political Studies 56(1), 57–75.
Union of International Associations (various years). Yearbook of international organizations. Munich: K. G. Saur.
United Nations, Department of Economic and Social Affairs (2015). Trends in international migrant stock: migrants by destination and origin. United Nations database (POP/DB/MIG/Stock/Rev.2015).
Volkens, Andrea, Pola Lehmann, Theres Matthieß, Nicolas Merz, Sven Regel and Annika Werner (2015). The manifesto data collection: Manifesto project (MRG / CMP / MARPOR). Version 2015a. Berlin: Wissenschaftszentrum Berlin für Sozialforschung (WZB).
World Bank (2016). World development indicators. http://data.worldbank.org/data-catalog/world-development-indicators.
1 See, for example, ‘Violence breaks out after anti-immigration, anti-racist rallies in Melbourne’ on ABC news, 26 June, 2016: https://ab.co/290tOuq.