5
Gender, voting, and women’s representation in the 2016 Australian election
Historically, there has been an underrepresentation of women in Australian politics. Despite Australia being one of the pioneers with New Zealand in granting women the right to vote in 1902 (1893 for New Zealand) (Inter-Parliamentary Union 2017), the first women were not elected to the federal parliament until 1943 and still today women constitute less than half of elected representatives. In February 2017, women were 28.7 per cent of members of the House of Representatives and 41.9 per cent of senators (Parliamentary Library 2017). Still, according to McAllister (2011), the increase from a handful of women to an average of 33 per cent representation in Australian parliaments has been one of the most significant changes in legislative recruitment in Australia. The greater presence of women in politics has mirrored important changes in Australian society in the past half-century regarding gender roles. Women have a greater presence in the labour force and higher levels of education. These changes in women’s lives and in their presence in formal political institutions have been a common phenomenon among established democracies, leading to expectations concerning their impact on voter behaviour.
Indeed, the women’s vote has been important to understanding electoral behaviour since women gained the right to vote. Early electoral studies found that women’s voting patterns differed from those of men. Ever since, the question of whether women constitute a voting bloc and how political parties can take advantage of this bloc has been a scholarly concern but also a puzzle for the media and politicians. As women constitute half of the voting population, small gender differences in vote choice can have great consequences. In other words, when elections can be won by a few votes, securing an advantage among a large demographic group could influence electoral success positively.
Gender patterns in vote choice have not been consistent around the world or in Australia. As mentioned above, changes in women’s roles in politics and society have influenced women’s vote and what is being described as the gender gap – that is, the percentage-point difference between women and men in support for a political party. Traditionally, women have voted for centre-right political parties in a greater proportion than men, but as their roles have changed, so has their behaviour. But the slow disappearance of the gender voting gap has not stayed still for long in Australia. As I show below, the gender gap in vote choice has transformed over the years so that, in the 2016 election, women were more likely to vote for a centre-left political party – the Australian Labor Party (ALP) or the Australian Greens – than men. This movement seems to be part of a global trend towards realignment where women in established democracies have moved from the right of men to the left of men (Inglehart and Norris 2003).
This chapter investigates the gender gap in vote-choice evidence in the Australian federal election of 2016 by situating this gap in its historical context. Multiple explanations have been offered to understand why women are now more likely to support left-wing political parties in established democracies. They tend to fall into two broad categories capturing structural and cultural explanations. This chapter will investigate how well these explanations allow us to understand why Australian women favoured the Labor Party to a greater extent than men in 2016. Australian women were also more likely than men to vote for the Australian Greens in 2016. If we were to combine votes for both the Labor and Greens parties, the impact of women tending toward the centre-left would produce an even larger gender gap. This chapter, however, only focuses on the gender gap in favour of the Labor Party as it is one of the major two political parties in Australia. Also, the factors that explain the gender gap for the Labor Party might not be the same as the explanations for the Greens vote. Morever, since the Australian Greens are a smaller political party, the smaller number of respondents in the Australian Election Study who have voted for this party makes it difficult to investigate the gender gap in vote choice for the Greens.
Using data from the Australian Election Study (AES) 2016, this chapter investigates the gender gap in vote choice but also across the characteristics and attitudes that have been commonly used to explain women’s and men’s different voting behaviour. The first section examines the evolution of the gender gap in vote choice in Australia since 1967. Second, this gender gap is explored by analysing the influence of a series of individual characteristics and socio-demographic factors. Third, the importance of political issues in understanding vote choice is analysed. Fourth, a section identifies the state of gender differences in political values and support for increasing the number of women MPs. The final section reports on a regression analysis comprising the possible factors explaining the gender voting gap in Australia to determine which are the most important.
The gender gap in vote choice
Gender differences in vote choice have been the subject of multiple investigations over the years. Early on, the literature on vote choice identified women as more likely to vote for centre-right political parties, although the differences with men’s rates of support were small (Duverger 1955; Butler and Stokes 1974; Campbell et al. 1960). Inglehart and Norris (2003) refer to this gender difference as the ‘traditional gender gap’ (77, emphasis in the original text). This traditional gender gap was found in multiple established democracies such as France, Britain, the United States, Italy, and Germany, starting in the 1950s and continuing until the 1970s (Inglehart 1977). Australia was not exempt from this trend, as shown by Figure 5.1. In 1967, the gender gap was 9 percentage points with men more likely than women to vote for the Labor Party. In the 1970s, Australian women remained slightly more conservative than men with the gender gap declining to 6 percentage points in 1979. However, as Aitkin (1982) stipulated, this gender gap in vote choice was rather small and less important than differences caused by other factors such as occupation or income.
Figure 5.1 Gender gap in vote choice, 1967–2016.
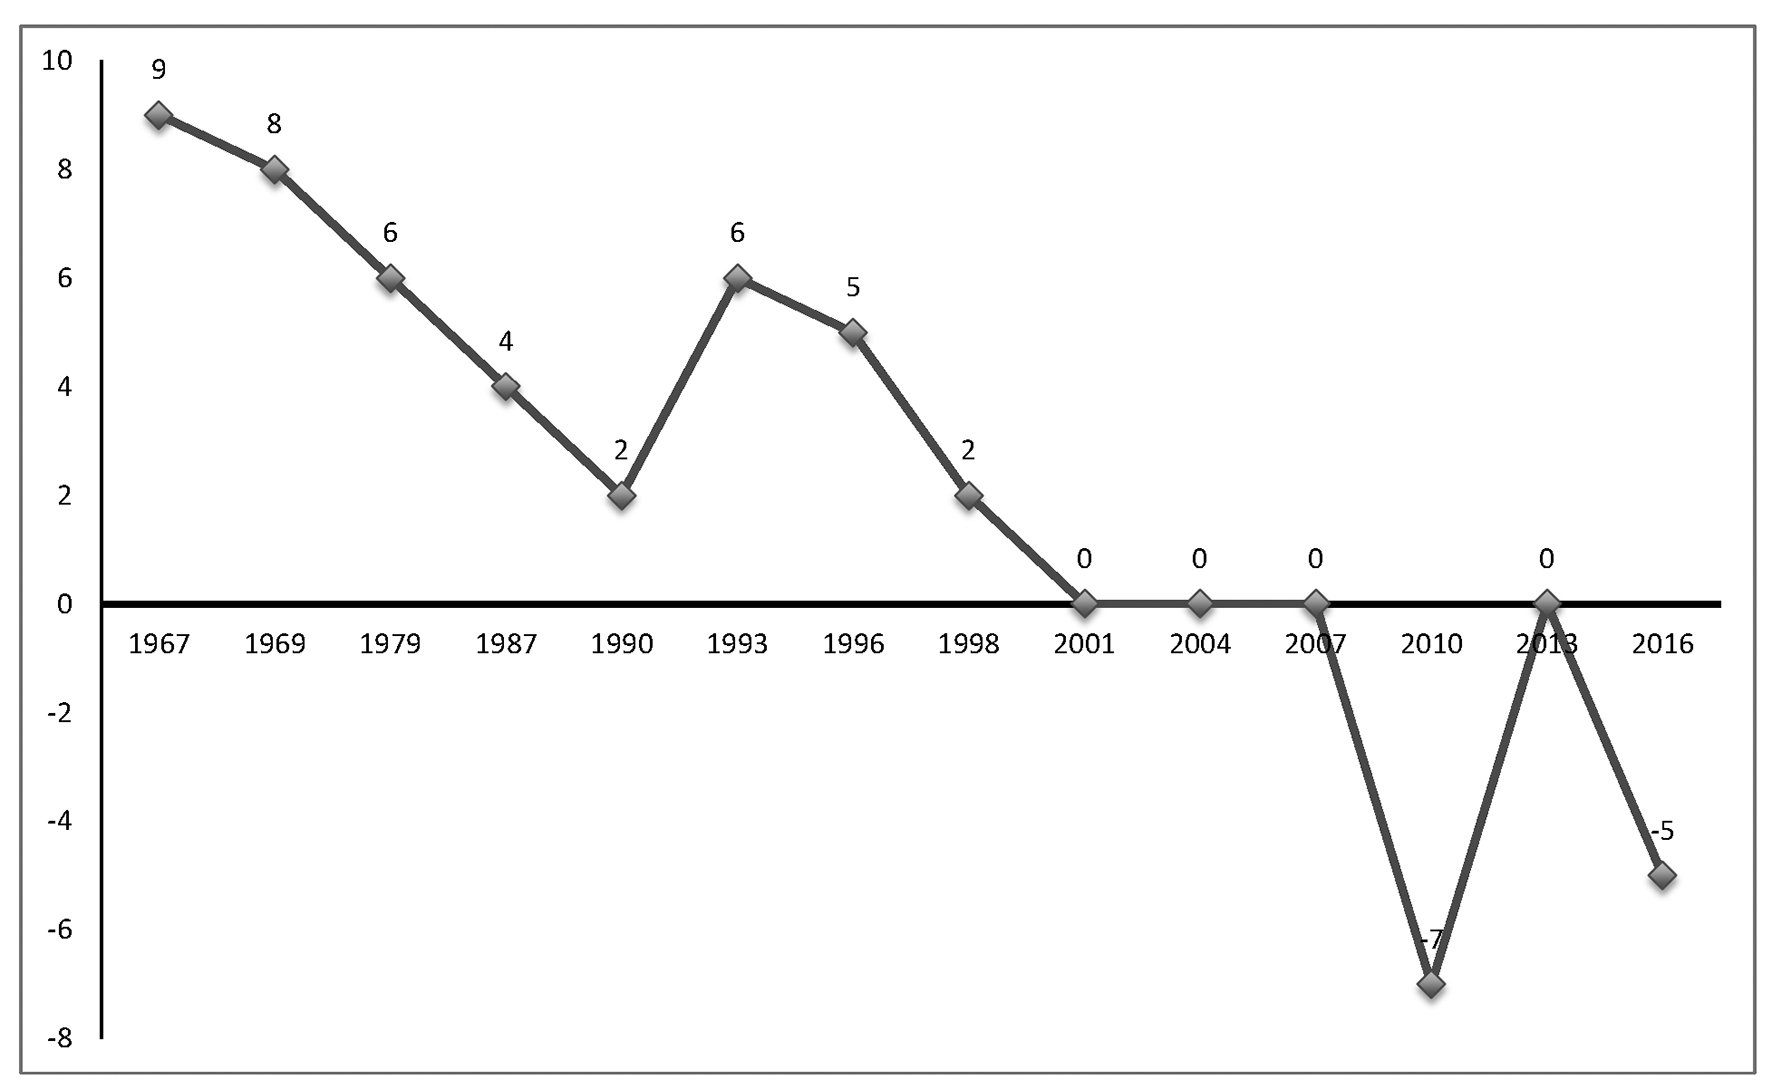
Sources: Australian National Political Attitudes Survey (ANPAS) 1967–79; Australian Election Study (AES) 1987–2016.
Note: Updated from McAllister (2011). The figure shows the percentage of men voting Labor minus the percentage of women voting Labor.
Explanations for this traditional gender gap in vote choice tend to focus on the role of religion and values in women’s lives (Inglehart and Norris 2003). Since women were more likely than men to be religious and to have more conservative values and political attitudes, they favoured political parties associated with these attitudes. On the other hand, Goot and Reid (1975) emphasise that early voting studies tend to ignore important factors that may explain women’s voting behaviour such as income, job security, and mobility. Consequently, women’s greater religiosity and conservatism may have been overrepresented as explanations for the traditional gender gap. McAllister (2011) adds that in the Australian context, this tendency of women to support conservative parties contributed to the dominance of the Liberal–Country Coalition in government at the federal level between 1949 and 1972.
As Figure 5.1 demonstrates, this traditional gender gap in vote choice declined in the 1980s to reach 2 percentage points in 1990. This pattern was also found in other established democracies (Inglehart and Norris 2003). Women were found still to be more conservative than men; however, this gap was smaller and would sometimes disappear when controls for religiosity and labour force participation were included (DeVaus and McAllister 1989). The literature on the gender gap in vote choice then started to discuss the ‘modern gender gap’ (Norris and Inglehart 2003, 78, emphasis in the original text), where women are more likely than men to support left-wing political parties. Australia in the 1990s, however, did not fit into this pattern of realignment.
In Canada, for instance, a modern gender gap in vote choice emerged in the 1990s, with women more likely to vote for the centre-left New Democratic Party (Erickson and O’Neill 2002). This pattern is only found outside the province of Québec. In Québec, the party system was not organised around left–right issues, preventing the emergence of a modern gender gap. A different party system, however, cannot explain why Australia was late in experiencing the rise of a modern gender gap since the party system is organised around the traditional left–right axis. While the gender gap had decreased to 2 percentage points in 1990 (see Figure 5.1), it increased to 6 percentage points in 1993. McAllister (2011) explains this result by the unpopularity of Paul Keating, the Labor prime minister, among women. He argues that Keating’s adversarial style was not well received among women, leading to a larger gender gap with women more likely to favour the Coalition. Consequently, leader selection is possibly one of the reasons explaining Australia’s lack of a modern gender gap in the 1990s. Another possible explanation might be found in the role of cultural values. As noted by Erickson and O’Neill (2002), cultural values are important in understanding the shift from a traditional gender gap to a modern gender gap. One possibility is that Australian women might have remained more conservative in their values than men for a longer period of time than women in other established democracies, explaining Australia’s lag when it comes to the emergence of a modern gender gap in vote choice.
After 1993, the gender gap in vote choice started to decline again until it disappeared in 2001 (see Figure 5.1). The difference between women’s and men’s vote choice was also negligible at the 2004 and 2007 elections. McAllister (2011) argues that men and women increasingly experience similar lives, ‘so that the factors that once led women to be more politically conservative than men have gradually disappeared’ (113) (see also Hayes and McAllister 1997; Studlar et al. 1998). Considering the most important factors explaining the decline in the size of the gender gap, McAllister (2011) notes that women are now more likely to participate in the labour force than they were in the 1960s and 1970s, and women are now more likely than men to obtain a university degree. Inglehart and Norris (2003) add that industrial Western societies underwent cultural change where attitudes toward women’s roles shifted – a greater acceptance toward women participating in the labour force and in politics emerged. All these factors combined to create a convergence in men’s and women’s experiences, leading to the decline and disappearance of the gender gap in vote choice.
However, Figure 5.1 shows that the gender gap in vote choice did not merely close. Indeed, in 2010, the gender difference was -7 percentage points, indicating that women were more likely than men to vote Labor. McAllister (2011) explains this result by arguing that Australia’s first female prime minister, Julia Gillard, had an important impact on women’s vote choice. Julia Gillard was more popular among women than among men while the then Liberal leader, Tony Abbott, was more popular among men than among women. This interpretation of the 2010 results seems to be confirmed by the absence of a gender gap in the 2013 election, where the gender difference in vote choice returned to zero. Commercial polls, on the other hand, show that the gender gap remained for the whole 2010 to 2013 period, with women more likely to support the Labor Party (Newspoll and the Australian 2013). It is consequently possible that the modern gender gap never fully disappeared after the 2010 election.
Voting patterns in the 2016 election suggest a return to a modern gender gap pattern, with women voting in greater proportion than men for the Labor Party. This has occurred without a woman heading the Labor Party, indicating that Australia’s gender gap in vote choice might be changing more permanently – as opposed to being the result of leadership choices. That women are more likely to support a centre-left political party than men has been a common phenomenon in established democracies (Studlar et al. 1998; Inglehart and Norris 2003). Inglehart and Norris (2003) highlight two broad sets of factors that can explain this modern gender gap – structural and cultural explanations.
Structural explanations emphasise women’s position in society. Inglehart and Norris (2003) argue that increases in labour force participation and education levels for women have pushed them to the left. Moreover, since women are concentrated in particular industries, lower-paying employment, and the public sector, women may be more likely to vote for political parties that emphasise support for social programs and the presence of a large public sector (see also Klein 1984). Additionally, Inglehart and Norris (2003) note that marital status and the presence of children are important structural factors explaining women’s more left-wing vote choices. As women are traditionally the ones responsible for the wellbeing of their children, for instance, the presence of children may emphasise to women the need for welfare programs such as health care, child care, and education. Differences in marital status are related to differences in lifestyles, which in turn can influence preferences toward political issues and vote choice (Plutzer 1998).
Cultural explanations of the modern gender gap in vote choice, on the other hand, highlight the role of values such as attitudes towards the role of government and gender equality. Inglehart and Norris (2003) argue that post-industrial democracies develop a set of values that prioritises quality of life, individual self-expression, environmental protection, and direct participation in political decisions. More specifically, in countries such as Australia, citizens develop greater support for gender equality. Furthermore, since women are especially likely to benefit from this cultural transformation, they will be more likely to support gender equality and government intervention to secure this equality, leading women to support parties to the left of centre. In sum, cultural explanations should be reflected in different policy priorities, different attitudes toward government intervention and equality, and different levels of support for intervention addressing women’s underrepresentation among women and men. The following sections of this chapter investigate how the gender gap in the 2016 Australian election is affected by structural and cultural factors.
The gender gap and demographic characteristics of voters
This section reviews how the gender gap in vote choice in the 2016 Australian election is affected by structural characteristics. First, Table 5.1 shows how the gender gap for the 2016 federal election (presented in Figure 5.1) varies across age groups. Inglehart and Norris (2003) argue that the modern gender gap is more likely to occur among younger citizens while the traditional gender gap should persist among older citizens. Younger women should be more likely to vote for left-wing political parties than younger men since they are the ones more likely to have benefited from the structural changes in women’s roles and conditions (Inglehart and Norris 2003). On the other hand, older women should be more likely to conserve their traditional voting behaviour and remain more likely to support right-wing parties than older men. As the table shows, the gender gap in vote choice is largest among respondents aged between 18 and 34 years and is the smallest among those aged 65 years and over. In all age groups, women are more likely to favour the Labor Party; however, gender differences are not significant for either the 50–64 years or 65 years and over age group. Consequently, it seems that the emergence of a modern gender gap in Australian politics is the result of a younger generation of female voters moving to the centre-left.
Table 5.1: Gender gap in the Labor vote across socio-demographic and individual characteristic groups, %.
| Vote Labor | |||
|---|---|---|---|
| Men | Women | Gap | |
| Age | |||
| 18–34 | 30.1 | 37.3 | -7.2*** |
| 35–49 | 30.6 | 36.3 | -5.7*** |
| 50–64 | 30.6 | 36.4 | -5.8 |
| 65 and over | 25.8 | 29.4 | -3.6 |
| N | 1,236 | 1,316 | |
| Education | |||
| No uni degree | 31.4 | 34.3 | -2.9** |
| Uni degree | 26.7 | 36.6 | -9.9*** |
| N | 1,237 | 1,301 | |
| Employment | |||
| Not full-time | 31.4 | 35.0 | -3.6*** |
| Full-time | 27.4 | 35.7 | -8.3*** |
| N | 1,244 | 1,325 | |
| Income | |||
| First quartile | 33.5 | 33.6 | -0.1 |
| Second quartile | 32.5 | 34.5 | -2.0* |
| Third quartile | 28.2 | 35.6 | -7.4* |
| Fourth quartile | 24.3 | 35.3 | -11.0*** |
| N | 1,204 | 1,244 | |
| Marital status | |||
| Single | 31.1 | 40.4 | -9.3** |
| Married/partner | 28.7 | 33.3 | -4.6*** |
| Widowed/divorced | 29.3 | 35.9 | -6.6 |
| N | 1,239 | 1,318 | |
Source: AES 2016.
Notes: The gap is calculated by subtracting the percentage of women who voted Labor from the percentage of men. Chi-square tests are conducted to assess the statistical significance of gender gaps.
*: p < 0.05; **: p < 0.01; ***: p < 0.001.
Second, Table 5.1 compares the gender gap in vote choice for citizens with and without a university degree. Women’s greater access to higher education has been one of the major changes to women’s lives in the last 50 years. McAllister (2011) argues that this trend of women obtaining a university education in greater proportions than men should lead to changes in women’s levels of political interest and the involvement of women in politics. Thus, education levels should influence the gender gap in vote choice. As Table 5.1 demonstrates, gender differences in voting for the Labor Party are larger among citizens holding a university degree than among those without. The gap is 9.9 percentage points among the former and is 2.9 percentage points in the latter. For both groups, the gender gap is significant at the p < 0.05 level. Women with a university degree are more likely to vote for the Labor Party while men with a university degree are less likely to vote for the same party.
Third, the gender gap in voting for the Labor Party is larger for citizens employed full-time. For these citizens, the gap is 8.3 percentage points (p < 0.001), where women are significantly more likely than men to vote Labor. The gender gap is still present, in the same direction, among citizens without full-time employment, but smaller at 3.6 percentage points (p < 0.001). This result supports the previous discussion on women’s participation in the labour force as an explanation for the modern gender gap. When women are employed full-time, they tend to occupy ‘pink collar’ jobs that are lower paid, or they are employed by the public sector (Burns et al. 2001; Workplace Gender Equity Agency 2016). Because of their employment, women may be more reliant on welfare programs, which lead them to support the Labor Party to a greater extent than men.
Fourth, Table 5.1 shows that as the income quartile of respondents increases, the size of the gender gap also increases. These gender gaps are significant (p < 0.05) for the three highest income quartiles, with women being more likely than men to vote for the Labor Party. For men, as their income increases, they are less likely to vote for the Labor Party. This is in line with McAllister’s (2011) findings that higher-income earners are more likely to vote for the Liberal–National Coalition and less likely to vote Labor. On the other hand, the percentage of women voting for the Labor Party does not change much across income quartile – it varies between 33.6 per cent for the first quartile and 35.3 for the fourth quartile. Women with a higher income may have a higher education level and be employed, both factors that should lead them to vote for the Labor Party, counterbalancing the factors that should lead high earners to vote for the Liberal–National.
Finally, Table 5.1 demonstrates that the gender gap also varies by respondent marital status. The largest gap occurs for single individuals where women are more likely to vote Labor (p < 0.01) and the smallest gap is among married or partnered individuals, although women are still more likely than men to vote Labor (p < 0.001). For widowed or divorced individuals, the gender gap in vote choice is in the middle; however, it is not significant, which means that for this group of citizens, men and women are equally likely to vote for the Labor Party. Single women’s greater likelihood of voting for the Labor Party may be a reflection of their different lifestyles than married women. Single women may be younger and more likely to be employed or to be studying for a higher degree, all factors that should lead them to support centre-left parties.
Political issues and the gender gap
The previous section demonstrates that the gender gap in vote choice in the 2016 federal election varies across a range of socio-demographic characteristics. As discussed, a possible explanation for women being more likely than men to vote for the Labor Party resides in women’s greater support for welfare. Due to the differences identified between women and men that were explored in the previous section, we have identified reasons why the former are more likely to support and prioritise government programs. This section investigates the importance of different political issues in explaining men’s and women’s vote choice.
The AES 2016 includes a question asking respondents: ‘which of these issues was most important to you and your family during the election campaign?’ Ten policy areas were given: taxation, immigration, education, the environment, government debt, health and Medicare, refugees and asylum seekers, global warming, superannuation, and management of the economy. Table 5.2 presents responses to this question for both men and women as well as for Labor and Liberal–National voters (that is, those voters who selected either Labor or the Liberal–National parties first in the House of Representatives). As one would expect, social policy issues were more important to Labor voters while Liberal–National voters selected economic issues. Citizens who prioritised education and health and Medicare were more likely to vote for the Labor Party while citizens who agreed that immigration, government debt and the management of the economy were the most important issues voted for the Liberal–National parties. These results are in line with previous findings (McAllister 2011).
Table 5.2: Most important issues during the 2016 election campaign by vote choice and gender, %.
| Most important issue | |||||||
|---|---|---|---|---|---|---|---|
| All | Liberal–National | Labor | |||||
| Men | Women | Gap | Men | Women | Gap | ||
| 1 Health and Medicare | 24.1 | 11.8 | 17.5 | -5.7 | 30.4 | 40.6 | -10.2 |
| 2 Management of the economy | 20.0 | 34.1 | 25.4 | 8.7 | 10.4 | 9.2 | 1.2 |
| 3 Education | 12.1 | 2.9 | 10.3 | -7.4 | 20.3 | 19.7 | 0.6 |
| 4 Taxation | 10.5 | 14.3 | 11.0 | 3.3 | 13.2 | 6.4 | 6.8 |
| 5 Government debt | 7.2 | 16.5 | 11.6 | 4.9 | 3.3 | 0.9 | 2.4 |
| 6 Superannuation | 6.3 | 6.9 | 7.3 | -0.4 | 6.3 | 5.8 | 0.5 |
| 7 Refugees and asylum seekers | 6.1 | 4.0 | 5.8 | -1.8 | 3.0 | 5.1 | -2.1 |
| 8 Environment | 5.5 | 1.3 | 1.7 | -0.4 | 2.5 | 7.1 | -4.6 |
| 9 Immigration | 4.2 | 5.3 | 5.8 | -0.5 | 2.7 | 1.3 | 1.4 |
| 10 Global warming | 4.1 | 1.3 | 1.7 | -0.4 | 4.7 | 1.9 | 2.8 |
| Chi-square | 40.2383*** | 29.6878*** | |||||
| N | 2,690 | 552 | 464 | 365 | 468 | ||
Source: AES 2016.
Notes: The gap is calculated by subtracting the percentage of women from the percentage of men. ***: p < 0.001. The chi-square assesses the statistical significance of the overall relationship between issue priorities and gender. The small sample size for each combination of vote choice, issue, and gender makes it difficult to assess the significance of each gap. Indeed, difference proportion tests indicate that each gender difference is not significant at p < 0.05. However, the chi-square indicates that the overall differences between women and men are significant at p < 0.001 for both Liberal–National and Labor voters.
Moreover, gender differences occurred for the most important issue of the electoral campaign. One of the largest gaps emerged for citizens agreeing that health and Medicare is the most important issue. For both Liberal–National and Labor voters, women are more likely than men to mention this issue as the most important; however, the gender gap is larger among Labor voters (10.2 percentage points for the latter compared to 5.7 percentage points for the former). Overall, 24.1 per cent of Australians identify this issue as the most important, but among Labor voters, 40.6 per cent of women responded that health and Medicare was the most important issue compared to 30.4 per cent of men. As discussed above, women may be more ‘structurally’ reliant on welfare programs and thus more likely to support parties defending such programs. Women are more likely to prioritise welfare issues such as health since they are more likely to be employed in this sector and women are also more likely to have responsibility for taking care of their children and elderly relatives. In the 2016 election, the Labor Party heavily campaigned on health and Medicare, and it seems the party was able to attract women voters who believed that this was the main issue of the election.
A large gender gap also occurs for citizens who chose the management of the economy as the most important issue, but only for Liberal–National voters. Men were more likely than women to mention this response (34.1 and 25.4 per cent respectively, for an 8.7 percentage points gap) while a similar percentage of female and male Labor voters selected this option (the gender gap is 1.2 percentage points). Additionally, for both Labor and Liberal–National voters, men were more likely than women to answer that taxation was the most important issue; however, a similar percentage of both party supporters mentioned this answer. The gender gap, however, is larger among Labor voters (6.8 percentage points compared to 3.3 percentage points). Men were also more likely than women to agree that government debt was the most important issue, with the gender gap being larger for Liberal–National voters (4.9 percentage points).
Education is also another policy area associated with a gender gap, but only for Liberal–National voters. For Liberal–National voters only, women are more likely than men to respond that this was the most important issue of the campaign, with a gender gap of 7.4 percentage points. Female Labor voters were more likely to mention the environment than their male counterparts by 4.6 percentage points – a gender gap that is not reproduced for Liberal–National voters. Finally, men were more likely than women to respond that global warming was the most important issue; however the gender gap is small for both Labor and Liberal–National voters (2.8 and 1.7 percentage points respectively).
Overall, women are more likely to favour social policy issues while men give a higher priority to economic issues. If we were to combine welfare issues (health and Medicare and education) and economic issues (management of the economy, taxation, and government debt), the gender gap in issue priorities would be even larger (13.1 percentage points for Liberal–National voters and 10.8 percentage points for Labor voters on welfare issues, and 16.9 percentage points for Liberal–National voters and 10.4 percentage points for Labor voters on economic issues). This is in line with Gidengil’s (1995) findings that when men and women are making political decisions they use different considerations. Men evaluate political decisions based on economic considerations while women’s evaluations of the same political decisions are based on social considerations. Thus, when deciding on which party to vote for, a greater reliance on social issues may lead women to support the Labor Party as this party has emphasised these issues in its campaign.
Gender, values, and attitudes toward women’s representation
The next set of factors to explore in understanding women’s greater support for the Labor Party is political values. As discussed above, women’s greater propensity to vote for centre-left and left-wing political parties can be explained by their different political values. Women should be more likely to support gender equality as they are the main beneficiaries of greater support of such equality (Inglehart and Norris 2003). Additionally, women tend to be more likely to attribute gender inequality to structural barriers such as discrimination than to blame women’s personal choices (Cassese et al. 2015; Gurin 1985). Consequently, women will be more likely to favour government intervention to resolve inequality. These attitudes complement the previous discussion on why women might favour welfare issues. In sum, it is expected that women’s attitudes and values toward government intervention and equality should differ from those of men. As well, women should be more likely to support governmental action aiming at redressing inequalities.
Table 5.3 presents gender differences for various political attitudes. The first part of the table shows gaps in opinions toward government intervention. For most of these attitudes women are significantly different from men. Since income tax is necessary for government policies and intervention, women are less likely than men to agree that high income tax makes people less willing to work hard; the gender gap is 8 percentage points (p < 0.01). Women also disagree with men on the role of trade unions. As women are more likely to work for the public sector, and more likely to depend on welfare programs, they may be more likely to support trade unions. Moreover, Australian union density is now slightly higher among women than men (see Australian Bureau of Statistics 2014), possibly contributing to women’s more favourable opinion of unions. Table 5.3 also indicates that fewer women than men agree that trade unions have too much power (a 16.1-percentage-point gap; p < 0.001) and women are less likely than men to agree there should be stricter laws to regulate the activities of trade unions (a 10.7-percentage-point gap; p < 0.001). On the other hand, women and men agree on the role of business in society, with similar percentages of both sexes agreeing that big business has too much power. Thus, it seems that gender differences are located in the role of government and trade unions.
Table 5.3: Gender differences in political attitudes toward government intervention and equality, %.
| Women | Men | Gap | |
|---|---|---|---|
| Role of government | |||
| High income tax makes people less willing to work hard | 41.2 | 49.2 | -8.0** |
| The trade unions in this country have too much power | 38.8 | 54.9 | -16.1*** |
| There should be stricter laws to regulate the activities of trade unions | 49.2 | 59.9 | -10.7*** |
| Big business in this country has too much power | 73.3 | 75.1 | -1.8 |
| Equality | |||
| Income and wealth should be redistributed towards ordinary working people | 56.2 | 54.0 | 2.2 |
| The government should take measures to reduce differences in income levels | 56.2 | 53.6 | 2.6 |
| Equal opportunities for migrants have gone too far | 33.1 | 35.9 | -2.8 |
| Aboriginal land rights have gone too far | 23.3 | 32.9 | -9.6** |
| Equal opportunities for women have gone too far | 5.5 | 14.5 | -9.0* |
| Women should be given preferential treatment when applying for jobs and promotions | 10.8 | 6.8 | 4.0 |
| The government should increase opportunities for women in business and industry | 60.2 | 39.0 | 21.2*** |
N=2,668. Source: AES 2016.
Notes: The gender gap is calculated by subtracting the percentage of men from the percentage of women. Difference of proportion tests are conducted to assess the statistical significance of gender gaps. *: p < 0.05; **: p < 0.01; ***: p < 0.001.
The second part of Table 5.3 reports on attitudes toward equality. The first two questions asked Australians about their attitudes toward income redistribution and government’s role in ensuring such redistribution. For both questions, women are slightly more likely than men to favour redistribution of income and government intervention; both gender gaps are small (2.2 and 2.6 percentage points respectively) and not significant. The next questions in Table 5.3 ask respondents whether equality for specific groups has gone too far. Men are more likely than women to agree that equal opportunities for migrants and Aboriginal land rights have gone too far. The gender gap is only significant for the latter question (p < 0.01).
The last three questions in Table 5.3 assess the differences between women and men in attitudes toward gender equality. As expected, women are more likely than men to favour gender equality. Women are less likely to agree that equal opportunities for women have gone too far (9-percentage-point gap; p < 0.01); women are also more likely to agree that they should be given preferential treatment when applying for jobs and promotions (4-percentage-point gap; not significant); and finally, women are more likely to respond that the government should increase opportunities for them in business and industry (21.2-percentage-point gap; p < 0.001).
These gender differences in values have been linked to gaps in support for specific governmental interventions to increase the presence of women in politics (Gidengil 1996). One important avenue for increasing women’s representation in the legislature has been the introduction of gender quotas. Both major parties have discussed this method in relation to the issue of women’s underrepresentation in Australian politics. This discussion has been informed by the gender division among elected representatives, which varies across political parties. As reported by Table 5.4, both the Labor and Liberal parties elected a similar percentage of women in the House of Representatives and the Senate until early 2000. After this point, the Labor Party started electing more women than the Liberal Party; indeed, the Labor Party elected 41 and 54 per cent of women in the House and Senate respectively while the Liberal Party elected 20 per cent of women in the House and 25 per cent in the Senate. Overall, Australia ranks 50th internationally for the representation of women in the national legislature (Inter-Parliamentary Union, 2017). Top established democracies such as Sweden and Finland have elected legislatures that are over 40 per cent women – consequently, Australia would achieve a higher position in the global ranking if the Liberal Party elected a similar number of women as Labor.
Table 5.4: Women’s representation in federal parliament by party, %.
| House | Senate | |||||
|---|---|---|---|---|---|---|
| ALP | Liberal | Gap | ALP | Liberal | Gap | |
| 1977 | 0 | 0 | 0 | 15 | 14 | 1 |
| 1980 | 6 | 0 | 6 | 23 | 17 | 6 |
| 1983 | 8 | 0 | 8 | 20 | 18 | 2 |
| 1984 | 9 | 2 | 7 | 18 | 18 | 0 |
| 1987 | 9 | 2 | 7 | 16 | 26 | -10 |
| 1990 | 9 | 6 | 3 | 16 | 24 | -8 |
| 1993 | 11 | 8 | 3 | 13 | 23 | -10 |
| 1996 | 8 | 22 | -14 | 31 | 26 | 5 |
| 1998 | 24 | 23 | 1 | 31 | 29 | 2 |
| 2001 | 31 | 24 | 7 | 39 | 26 | 13 |
| 2004 | 33 | 20 | 13 | 46 | 24 | 22 |
| 2007 | 33 | 22 | 11 | 44 | 28 | 16 |
| 2010 | 32 | 22 | 10 | 44 | 29 | 15 |
| 2013 | 38 | 22 | 16 | 56 | 19 | 37 |
| 2016 | 41 | 20 | 21 | 54 | 25 | 29 |
Source: Parliamentary Handbook of the Commonwealth of Australia, multiple years.
Note: The gap is calculated by subtracting the percentage of Liberal women from the percentage of ALP women.
In recent years, the discrepancy in women’s parliamentary representation has been the object of debate. As prime minister, Tony Abbott was criticised for initially including only one woman and later two women in his Cabinet. This low Cabinet representation, combined with the Liberal Party’s representation in Parliament being less than 30 per cent women, has led some female Liberals to call for gender targets, if not full quotas.1 Notably, in 2010, Liberal Senator Judith Troeth released a policy paper arguing in favour of a party quota for candidate preselection (Troeth 2010). The latest call for targets has emerged after the Labor Party adopted such a rule, in 2015, to ensure the party election of 50 per cent women in Parliament by 2025 (Crowe 2015). The Liberal Party, however, has always rejected gender quotas, arguing that they run against the merit-based system of candidate selection. On the other hand, the Labor Party has been more open to the idea of a gender quota. Since 1981, there are party quotas for internal positions. The Labor Party’s first candidate quotas with effective sanctions for non-compliance were adopted in 1994: they stipulated that 35 per cent of candidates be women (Quota Project 2017). In 2002, the quota was increased to 40 per cent and in 2015 to 50 per cent (by 2025). McAllister (2012) mentions that this gender quota was a major factor in increasing women’s representation in the Labor Party, since the policy takes into account selection for winnable seats when nominating women. In sum, the lack of a target or quota in the selection of candidates for the Liberal Party is one of the main explanations for the current ceiling on the number of women elected to federal parliament.
AES 2016 includes a question asking respondents ‘should there be more efforts to increase the number of women MPs? If so, what means would you prefer?’ Five possible response options were given: 1) No, there is no need to increase the number of women MPs; 2) No, nothing needs to be done, it will happen naturally; 3) Yes, by legally requiring all political parties to select more women candidates by means of a quota; 4) Yes, the political parties should make their own voluntary commitments to increase the number of women MPs; and 5) Yes, by encouraging more women to participate in politics. Table 5.5 presents the responses according to gender and which party citizens voted first for in the House of Representatives.
Table 5.5: Gender differences in support for increasing the number of women MPs, %.
| Liberal–National | Labor | |||||
|---|---|---|---|---|---|---|
| Men | Women | Gap | Men | Women | Gap | |
| No, there is no need to increase the number of women MPs | 10.5 | 7.0 | 3.5 | 9.6 | 3.2 | 6.4 |
| No, nothing needs to be done, it will happen naturally | 50.4 | 37.7 | 12.7** | 29.3 | 21.7 | 7.6 |
| Yes, by legally requiring all political parties to select more women candidates by means of a quota | 4.4 | 6.8 | -2.4 | 15.3 | 15.5 | -0.2 |
| Yes, the political parties should make their own voluntary commitments to increase the number of women MPs | 9.9 | 18.1 | -8.2 | 19.2 | 22.1 | -2.9 |
| Yes, by encouraging more women to participate in politics | 24.8 | 30.5 | -5.7 | 26.6 | 32.7 | -6.1+ |
| Chi-square | 26.3038*** | 24.6127*** | ||||
| N | 544 | 459 | 365 | 466 | ||
Source: AES 2016.
Notes: The gender gap is calculated by subtracting the percentage of women from the percentage of men. Difference of proportion tests are used to assess the significance of the gender gap. +: p < 0.10; **: p < 0.01.
According to Table 5.5, overall gender differences are significant – that is, men and women have different opinions about the necessity of increasing the number of women MPs. Men are more likely than women to answer ‘no’ on the question of whether increasing the number of women MPs is necessary, and this occurs for both Liberal–National and Labor voters. Among Liberal–National voters, the opinion that women’s representation will increase ‘naturally’ is the most frequently chosen answer, but men are significantly more likely (p < 0.01) than women to agree with this option (a 12.7-percentage-point gap). Labor men are also more likely than women to select this answer, but the gender gap is smaller and not significant (7.6 percentage points). Women are slightly more likely than men to support legislative gender quotas – that is, legislation requiring political parties to nominate a certain percentage of women candidates where failure to follow the legislation would result in penalties for political parties. However the difference on this proposition is nearly non-existent for Labor voters (0.2-percentage-point gap compared to 2.4-percentage-point difference for Liberal–National voters). Larger gender gaps for both groups of voters appear for support for voluntary measures – that is, measures that are not enforced by the government, but within the parties – i.e. voluntary commitments by political parties that encourage women to participate in politics. Women are more likely than men to support both of these options, with encouraging women being the most popular answer among female Labor voters. The only significant difference, however, is for encouraging women to participate in politics among Labor voters (p < 0.10).
How do Australian attitudes on ways to increase women’s representation compare globally? One recent study conducted in Latin America demonstrates that the average support for legislative quotas is about 5 points on a 1 to 7 scale (where 7 indicates that the respondent strongly agrees with gender quotas) (Barnes and Córdova 2016). An older study of Canadian opinions shows that 32 per cent of men and 45 per cent of women favour gender quotas in varying strength (Gidengil 1996). Consequently, Australians’ support for gender quotas seems somewhat lower than in Latin American countries despite the different question used to measure attitudes toward gender quotas. This different level of support can be explained by the wider adoption of gender quotas in Latin America. Like Australia, Canada does not have gender quotas and Australians exhibit a similar level of support for quotas as Canadians.
Interestingly, 32.7 per cent of female Labor voters and 30.5 per cent of female Liberal–National voters answered that encouraging women to participate in politics is necessary. For the two types of quotas – legislative and voluntary party quotas – female Labor voters are more likely to support these options than either men or female Liberal–National voters. This result may be explained by the ideology of supporters of the respective parties. A stronger adherence to ‘liberal’ individualism principles among Liberal–National voters might lead them to believe that individuals are responsible for the present inequalities between women and men (Krook et al. 2009); consequently, they will prefer non-state intervention that ensures equality of opportunities to solve these issues. That, in turn, leads to an opposition to legislative measures imposed by the government aimed at correcting the imbalance between the sexes. By contrast, centre-left ideologies reflected in the Labor Party might favour structural explanations for the inequality between women and men, resulting in greater support for methods such as gender quotas.
In sum, Australian women are more likely than men to favour government intervention, equality, and measures aiming at increasing the number of women MPs. The results presented in this section tend to confirm cross-national research on the different values and opinions held by women and men (Inglehart and Norris 2003). A greater commitment to the policies of gender equality as well as increased representation of women in politics are encouraging more women to support centre-left political parties.
Bringing it all together
This final section evaluates the contribution of all four different sets of explanations explored above to better understand the gender gap in vote choice in the 2016 federal election. To achieve this, a logistic regression is performed with voting for the Labor Party over the ALP as the outcome variable. A logistic regression is necessary since the outcome takes the form of a dichotomous indicator where respondents who voted for the Labor Party are coded ‘1’ and otherwise is indicated with ‘0’. In the first model presented below, gender is measured with a dummy indicator where women are coded ‘1’ and men ‘0’. Socio-demographic and individual characteristics included in the model are: respondents’ age, level of education, employment status, income level, and marital status.
Issue priorities are recoded into two indicators according to the answers where the largest gender gaps occurred in Table 5.2. Respondents prioritising management of the economy, taxation, and government spending are grouped into a single indicator where giving priority to one of these issue is coded ‘1’ and otherwise ‘0’. The second category consists of respondents who indicated that welfare issues (education and health and Medicare) were the most important priority; again, welfare priorities are coded ‘1’ while other answers are coded ‘0’.
Six indicators are employed to assess the impact of political attitudes toward government intervention and equality on voting for the Labor Party. The first indicator assesses support for the statement that tax makes people less willing to work hard. Second, attitudes toward unions are measured by combining opinions on whether trade unions have too much power and on whether there should be stricter laws to regulate the activities of trade unions. Third, opinions on whether big business has too much power are used. Four, the indicator for attitudes toward redistribution is created by combining responses on support for income and wealth redistribution toward ordinary people, and for government taking measures to reduce differences in income levels. Five, opinions on whether equal opportunities for migrants and Aboriginal land rights have gone too far are added to build the indicator for attitudes toward minorities. Six, attitudes toward equality for women combine responses to statements on equal opportunities for women, preferential treatment for women when applying for jobs and promotions, and government involvement to increase opportunities for women in business and industry.
The final set of factors included in the model is support for increasing the number of women MPs. Three dichotomous indicators are used: supporting legally requiring political parties to select more women candidates by means of a quota, supporting political parties making their own voluntary commitments to increase the number of women MPs, and encouraging women to participate in politics.
Table 5.6: Gender and voting for the Labor Party in 2016.
| All | Women | Men | |
|---|---|---|---|
| Women | -0.199 (0.179) | ||
| Socio-demographic | |||
| Age | -0.014* (0.007) | -0.017+ (0.009) | -0.012 (0.011) |
| Education | 0.008 (0.042) | 0.066 (0.057) | -0.074 (0.063) |
| Employment | 0.065 (0.202) | 0.325 (0.278) | -0.323 (0.334) |
| Income | -0.120 (0.109) | -0.262+ (0.144) | 0.112 (0.168) |
| Married | 0.125 (0.284) | 0.336 (0.360) | -0.017 (0.476) |
| Divorced | 0.230 (0.315) | 0.533 (0.421) | -0.063 (0.484) |
| Issue priority | |||
| Economic | -0.606** (0.210) | -0.538+ (0.312) | -0.704* (0.281) |
| Welfare | 0.665*** (0.205) | 0.622* (0.281) | 0.719* (0.306) |
| Attitudes | |||
| Tax | -0.004 (0.080) | 0.048 (0.122) | -0.019 (0.112) |
| Unions | 0.672*** (0.052) | 0.678*** (0.075) | 0.719*** (0.083) |
| Business | 0.708*** (0.118) | 0.498** (0.158) | 0.918*** (0.190) |
| Redistribution | 0.241*** (0.058) | 0.301*** (0.081) | 0.215** (0.081) |
| Minorities | -0.140* (0.059) | -0.180* (0.070) | -0.108 (0.098) |
| Women | 0.059 (0.054) | 0.060 (0.078) | 0.055 (0.082) |
| Support women MPs | |||
| Legislative quotas | 0.800* (0.334) | 0.703+ (0.406) | 1.010+ (0.523) |
| Party quotas | 0.273 (0.254) | 0.147 (0.351) | 0.439 (0.370) |
| Encouraging women | 0.216 (0.220) | 0.295 (0.310) | -0.001 (0.325) |
| Constant | -6.796*** (1.059) | -6.518*** (1.405) | -7.802*** (1.733) |
| N | 1,564 | 760 | 804 |
Source: AES 2016.
Notes: Cell entries are logistic coefficients (from regression models) with standard errors in parentheses. +: p < 0.1, *: p < 0.05, **: p < 0.01, ***: p < 0.001.
Results are presented in Table 5.6. Model 1 of this table displays findings for the whole sample and includes a coefficient for women. This latter coefficient shows that women are no more or less likely to vote for the Labor Party once controls for socio-demographic status, issue priorities, political attitudes, and support for increasing the number of women MPs are included. Moreover, only one of the socio-demographic characteristics is significantly associated with voting for the Labor Party at the p < 0.05 level. As respondents get older, they are significantly less likely to choose Labor over the Liberal Party. Issue priorities and attitudes are better predictors of voting Labor. Selecting economic issues as the main priority is significantly and negatively associated with voting Labor. Moreover, there is a positive and significant relationship between respondents prioritising welfare issues and voting for the Labor Party. Positive attitudes toward unions, redistribution and minorities are also significantly linked with voting for the Labor Party. Agreeing that big business has too much power is also linked with a greater likelihood of voting Labor over Liberal. Finally, citizens supporting legislative quotas are significantly more likely to vote for the Labor Party. Overall, these results highlight a clear left–right divide in Australian politics: respondents favouring centre-left priorities and attitudes are more likely to vote for the Labor Party.
Models 2 and 3 in Table 5.6 show the results for the same logistic regression, but for women and men respectively. This allows for an investigation of whether the same factors explain women’s and men’s votes for the Labor Party. For both men and women, socio-demographic characteristics are not significantly linked with voting for this party, with the exception of age, which is significant at a lower level (p < 0.10) for women. Similarly, both women and men indicating a priority for welfare issues are significantly more likely to vote for Labor – it appears that welfare issues play an equally important role for both sexes.
Economic issues priority and political attitudes appear to make a difference to gender patterns in the Labor vote. Male respondents who agreed that economic issues were the most important issues of the electoral campaign are significantly less likely to vote Labor while the same relationship is not significant at the p < 0.05 level for women. Another difference in models 2 and 3 is on the role of attitudes toward minorities. Women agreeing that equal opportunities for migrants have gone too far are significantly less likely to vote for the Labor Party. This relationship, however, is not significant for men. The impact of other political attitudes – such as opinions on unions, business, and redistribution – in explaining men’s and women’s likelihood of voting Labor is similar for both sexes. In sum, with the exception of attitudes toward minorities and economic priorities, men and women do not differ in the attitudes that lead them to vote for the Labor Party.
The final group of explanatory variables assesses support for increasing the number of women MPs. Results in Table 5.5 demonstrate that for both women and men, such opinions are not significantly related to voting for the Labor Party. The only exception is support for legislative quotas, where supporting such options is linked with voting for the Labor Party over Liberal; however, the relationships only reach the p < 0.10 level of significance.
Conclusion
For a long time, the role of gender in Australian politics has been discussed in the media and by politicians of both major parties. Despite their greater presence in the labour force and rising levels of education, women are still underrepresented in politics. Political parties play a role in maintaining the dominance of men in the highest offices of politics. They also play a role in possible solutions to this problem, such as gender quotas. Moreover, the discussion of gender has occurred during and after the election of the first female prime minister of Australia, Julia Gillard. As discussed above, Gillard’s election to the highest office has coincided with the emergence of a new gender gap in vote choice – one where women are more likely than men to vote for the Labor Party. Gender has long been a salient issue in Australian politics and the emergence and endurance of a gender gap in favour of Labor is one of its latest consequences.
This chapter has tested structural and cultural explanations to understand why Australian women are now more likely than men to favour the Labor Party. Once a series of socio-demographic and individual characteristics are taken into account, the gender gap in voting remains. In other words, women with the same characteristics as men (such as age or education level) are more likely than men to vote Labor. This finding may indicate that structural explanations are not enough to explain the modern gender gap. The contributing factor to the modern gender gap in Australia may be more likely to be found in the different values held by women and men. Women’s greater emphasis on welfare may lead them to be more likely than men to vote for the Labor Party. By positioning themselves as the defenders of health policies and Medicare, the Labor Party may have been able to attract a larger share of the women’s vote since the Labor Party favours government intervention to a greater extent. In brief, these gender differences in values and policy preferences may indicate a more permanent shift, with more women voting Labor and more men voting Coalition. If women’s preferences are deeply held, then the gender gap as observed in 2016 may be here to stay.
References
Aikin, Don (1982). Stability and change in Australian politics. Canberra: ANU Press.
Australian Bureau of Statistics (2014). Characteristics of employment, Australia, August 2014. Canberra: ABS.
Australian Election Study (2016). The AES series: 2016. australianelectionstudy.org.
Barnes, Tiffany D. and Abby Córdova (2016). Making space for women: explaining citizen support for legislative gender quotas in Latin America. The Journal of Politics 78(3), 670–86.
Burns, Nancy, Kay Lehmann Schlozman and Sidney Verba, (2001). The private roots of public action: gender, equality, and political participation. Cambridge, Mass.: Harvard University Press.
Butler, David and Donald E. Stokes (1974). Political change in Britain. New York: St Martin’s Press.
Campbell, Angus, Philip E. Converse, Warren E. Miller and Donald E. Stokes (1960). The American voter. New York: Wiley.
Cassese, Erin C., Tiffany D. Barnes and Regina P. Branton (2015). Racializing gender: Public opinion at the intersection. Politics and Gender 11(1), 1–15.
Crowe, David (2015). Liberal MP Sharman Stone backs quotas for women. Australian, 28 July. http://bit.ly/2uRAscM.
DeVaus, David and Ian McAllister (1989). The changing politics of women: gender and political alignments in 11 nations. European Journal of Political Research 17(3), 241–62.
Duverger, Maurice (1955). The political role of women. Paris: UNESCO.
Erickson, Lynda and Brenda O’Neill (2002). The gender gap and the changing woman voter in Canada. International Political Science Review 23(4), 373–92.
Gidengil, Elisabeth (1995). Economic man – social woman? The case of the gender gap in support for the Canada–United States free trade agreement. Comparative Political Studies 28(3), 384–408.
Gidengil, Elisabeth (1996). Gender and attitudes toward quotas for women candidates in Canada. Women and Politics 16(4), 21–44.
Goot, Murray and Elizabeth Reid (1975). Women and voting studies: mindless matrons or sexist scientism? Beverly Hills, CA: Sage.
Gurin, Patricia (1985). Women’s gender consciousness. Public Opinion Quarterly 49(2), 143–63.
Hayes, Bernadette and Ian McAllister (1997). Gender, party leaders, and electoral outcomes in Australia, Britain and the United States. Comparative Political Studies 30(1), 3–26.
Inglehart, Ronald (1977). The silent revolution: changing values and political styles among Western publics. Princeton, NJ: Princeton University Press.
Inglehart, Ronald and Pippa Norris (2003). Rising tide: gender equality and cultural change around the world. Cambridge: Cambridge University Press.
Interparliamentary Union (2017). Statistical archive: women in national parliaments (1 March). www.ipu.org/wmn-e/classif-arc.htm.
Klein, Ethel (1984). Gender politics. Cambridge, Mass.: Harvard University Press.
Krook, Mona Lena, Joni Lovenduski and Judith Squires (2009). Gender quotas and models of political citizenship. British Journal of Political Science 39(4), 781–803.
McAllister, Ian (2012). Early promise unfulfilled: the electoral representation of women in Australia. In Women and legislative representation: electoral systems, political parties, and sex quotas. Manon Tremblay, ed., 101–12. New York: Palgrave.
McAllister, Ian (2011). The Australian voter. Sydney: UNSW Press.
Norris, Pippa (2004). Electoral engineering: voting rules and political behavior. Cambridge: Cambridge University Press.
Norris, Pippa and Marc N. Franklin (1997). Social representation. European Journal of Political Research 32(2), 185–210.
Parliamentary Library (2017). Composition of Australian parliaments by party and gender: a quick guide. Canberra: Parliament of Australia, Department of Parliamentary Services.
Plutzer, Eric (1988). Work life, family life and women’s support for feminism. American Sociological Review 53(4), 640–49.
Quota Project (2017). Global database of quotas for women. quotaproject.org.
Studlar, Donley T., Ian McAllister and Bernadette Hayes (1998). Explaining the gender gap in voting: a cross-national analysis. Social Science Quarterly 79(4), 779–98.
Troeth, Judith (2010). Modernising the parliamentary Liberal Party by adopting the organisational wing’s quota system for preselections. Policy Paper. 23 June. http://apo.org.au/system/files/57011/apo-nid57011-98866.pdf.
Workplace Gender Equality Agency (2016). Australia’s gender equality scorecard. Canberra: Australian Government. https://www.wgea.gov.au/sites/default/files/80653_2015-16-gender-equality-scorecard.pdf.
1 After ousting Tony Abbott as the leader of the Liberal Party, the new prime minister Malcolm Turnbull nominated an increased number of women – five – to his Cabinet.