7
Contested, corporatised and confused? Australian attitudes to child care
Introduction
Controversies about child care have been much in the news in Australia in recent times. Some commentators have damned the very existence of child care for very young children, using cortisol studies, among other evidence, to argue that formal care is positively harmful (Manne 2006). Yet despite these rather dire warnings, more and more Australian families are using child care – and finding the system complex, difficult to navigate, and increasingly unaffordable (Anderson 2006; Farouque, 2006; Halliday & Dunn 2006).1 Meanwhile, the business press reports that Australian-owned ABC Learning has grown to become the world’s largest listed company providing child care (Potts 2006). With around 900 centres, ABC Learning now controls an estimated 20 per cent of all long day care centres in Australia (O’Loughlin 2007). The rapid expansion of this and other corporate providers has reopened debate about what kind of organisations are best suited to providing child care services.
This chapter explores what Australians think about child care, to provide a context for interpreting these media reports and for thinking about policy options. I explore three questions: where do Australians stand on working mothers and child care for young children, and how have these views changed over time? What kinds of organisations do Australians think are best to deliver child care? And what kinds of rationales for public subsidies for child care do Australians support? Understanding what Australians think about child care is useful, because insofar as attitudes are not currently
138well-understood or irrevocably fixed, there are clear opportunities for political and social actors to lead the childcare policy debate in new directions.
My principal data source is the Australian Survey of Social Attitudes (AuSSA) (Wilson et al., 2006).2 AuSSA 2005 included several items measuring attitudes to gender roles, the use and provision of child care, and a new question about rationales for public subsidies for child care. The International Social Survey Program (ISSP) provides supplementary data that enable us to understand attitudes to gender roles and child care over time.
Contested gender roles: Australian attitudes to working mothers and child care
Anne Manne’s intervention into the childcare debate is also an intervention into the debate about gender roles in Australia. In societies like Australia, formal child care is often framed as a substitute for familial – or, more specifically, maternal – care, rather than as a social service for the benefit of children. In this way, social attitudes to child care are wrapped up with attitudes to relationships and gender roles as much as attitudes to social service provision. Surveys capture the connection between attitudes to child care and gender roles in an item that asks respondents whether they agree or disagree that ‘A preschool child is likely to suffer if his or her mother works’. Figure 7.1 shows how Australians have responded to this question over the last decade or so.
139
Figure 7.1: Agree that ‘A preschool child is likely to suffer if mother works’, Australia, various years, per cent
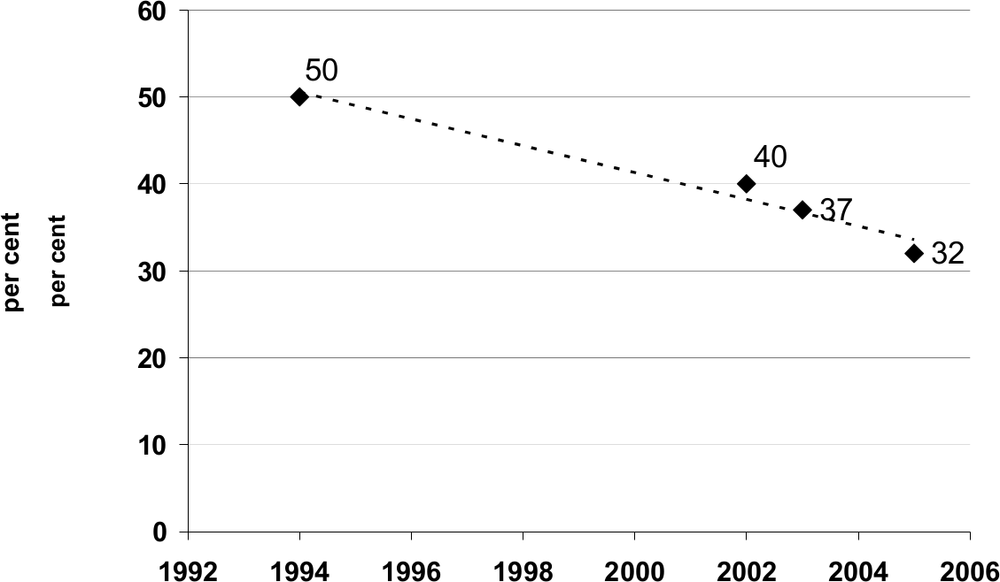
Sources: International Social Survey Program 1994, 2002; Australian Survey of Social Attitudes 2003, 2005.
The figure shows that general support for stay-at-home mums as the norm (in the strong sense) is clearly falling, and is now a minority view. In 1994, half of all respondents agreed with the statement (50 per cent); by 2005, less than a third do (32 per cent). Alongside the clear trend towards declining agreement with the statement are strong patterns by sex and labour force participation. Figure 7.2 compares responses in 1994 and 2005 and divides respondents by sex and by labour force status. The figure shows that, at both time points, working women were least likely to agree with the statement, while men who were not in the labour force were most likely to agree.
Between 1987 and 2004, the proportion of employed mothers with children under 15 increased from 49 per cent to 57 per cent (Australian Bureau of Statistics 2006, p. 124). Across the shorter period between 1994 and 2004, the number of children in Australian government supported child care services increased 63 per cent (from 396 700 to 646 800) (Australian Institute of Health and Welfare 2005, p. 92). Thus, neither the overall decline in per cent 140support for the norm of the stay-at-home mum, nor the pattern of attitudes by sex and labour force status are surprising. A recent British study helps explain why. Sue Himmelweit and Maria Sigala (2004) used responses to the same survey question in the British Household Panel Survey to examine what happened over time to the attitudes and behaviour of mothers who agreed with the statement but also worked. They found that ‘those in the contradictory position of being in employment though believing that preschool children suffered from their mothers’ working were more likely to change their attitude than their behaviour’ (2003, p. 468). Of mothers who agreed with the statement, and had changed either their employment status or their attitude, 46 per cent who had taken a job in the intervening two years had also changed their attitude and no longer agreed with the statement. This is many more than the 29 per cent who had resolved the contradiction between their attitudes and behaviour by giving up employment.
Figure 7.2: Agree that ‘A preschool child is likely to suffer if mother works’, by sex and labour force status, Australia, 1994 and 2005, per cent
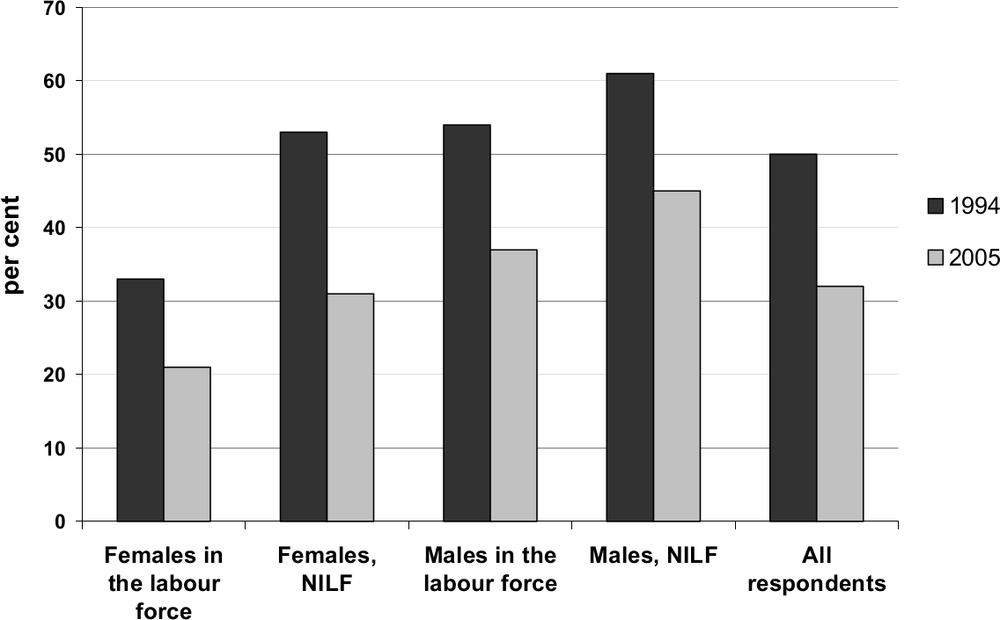
Sources: International Social Survey Program 1994, 2002; Australian Survey of Social Attitudes 2003, 2005.
141AuSSA 2005 also asks a direct question about child care, inviting respondents to say how much they agree or disagree with the statement ‘If the care is good, it is fine for children under three years of age to be placed in full-time care’. Although making the qualification ‘if care is good’, this item puts the question rather strongly by specifying full-time care. The Census of Child Care Services (CCCS) does not report hours of attendance at child care by age group in Australia. However, reporting against broader categories helps us gauge the extent of full-time care for very young children. In 2004, the year of the most recently published CCCS, 41 per cent of children in private or community-based long day care or family day care were under three years of age, and 56 per cent of all children in these forms of child care attended for fewer than 20 hours a week. If we define ‘full-time care’ as more than 30 hours per week, then only 20 per cent of children of any age were in care full-time in 2004.3
Table 7.1 shows how Australians responded to this more direct question, with the most frequent response within each group highlighted by a box. Overall, more Australians disagree than agree with the statement; clearly full-time care for very young children is not very widely accepted as ‘fine’. Yet that is not to say that there is broad hostility to full-time care for very young children. For most subgroups, the number of people who agree is much the same as the number of people who disagree, while a sizable minority of all subgroups is neutral. Women are significantly more likely than men to agree, and more likely to agree than disagree. This pattern is even more pronounced among those who have received the Child Care Benefit (CCB) in the last five years. In this group, half of all respondents agree with the statement. Perhaps the dynamic that Himmelweit and Sigala identify is at work here, too: those who have actually used child care full-time, or been in contact with others who have, are less likely to think it is undesirable. Just as noteworthy is the relative lack of difference in attitudes between respondents from households with children, and the overall respondent population. It seems that the presence of children does not shape
142attitudes in any direct way: sex and direct contact with the childcare benefit system are much more important.
Table 7.1 Attitudes to full-time care for children under three, Australia, 2005, by sex, education, presence of children and receipt of CCB, per cent
| Agree | Neutral | Disagree | Can’t choose | (n=) | ||
| All respondents | 39 | 17 | 43 | 2 | (3807) | |
| Women | 43 | 15 | 40 | 1 | (2005) | |
| Men | 33 | 19 | 45 | 2 | (1802) | |
| Bachelor deg. or higher | 41 | 15 | 42 | 2 | (876) | |
| No university education | 38 | 18 | 43 | 2 | (2978) | |
| Children present in household | 40 | 15 | 44 | 1 | (3787) | |
| Received Child Care Benefit in the last 5 yrs | 50 | 13 | 37 | 1 | (274) |
Source: Australian Survey of Social Attitudes 2005.
143
Who best to deliver child care?
In recent years, attitudes to working mothers have ‘softened’ a good deal, and the use of child care has grown significantly, so that the norm of familial care is no longer dominant in Australia. However, there is more to the question of ‘who best to deliver child care?’ than maternal versus formal care, as the media debate about the emergence and growth of corporate childcare providers demonstrates. In Australia’s ‘mixed economy’ of care, formal child care is delivered by several different kinds of organisations, including governments, non-profit community organisations, businesses and non-kin families (in the form of family day care). The structure and evolution of this mixed economy of care is largely policy driven, as governments develop and change the form and conditions of public support for child care. Over the last decade and a half, apart from considerable growth of public funding to child care, there have been two particularly significant changes to policy that have altered the mix in the childcare ‘economy’. First, in 1991 a Labor government extended public subsidies to for-profit childcare providers for the first time, via the extension of fee relief to parents using these services (Brennan 1998, p. 203). Second, in its first budget for the fiscal year 1996–7, the newly elected Coalition government cut operational subsidies to community-based child care centres (Brennan 1998, p. 222), effectively redirecting all federal subsidies to child care through funding to parents rather than funding to centres.
The combined effect of these measures has been the disproportionate growth of ‘for-profit’ childcare provision, and the movement into the sector of corporate players. In 1991, when fee subsidies were extended to for-profit providers, for-profit centres accounted for less than half of all centre-based long day care places (48 per cent) supported by the Australian Government. By 2004, for-profit centres accounted for nearly three quarters of such places (72 per cent). Overall, 83 per cent of all the subsidised places in centre-based long day care added between 1991 and 2004 were in for-profit centres.4 For-profit providers are also moving into family day care and out of school hours care. In 2004 (the most recent
144year for which figures are available) just over one in 20 family day care coordination units and around one in 13 out of school hours services were also in private sector ownership (Australian Institute of Health and Welfare, 2005, p. 88). The 2006–7 federal budget removed the cap on places in both family day care and out of school hours services, opening up more opportunities for private operators to move further into these parts of the child care system.
It is not hard to understand why private businesses enter the childcare ‘market’. Providing a heavily subsidised service to a growing client base under a relatively light regulatory regime is an attractive business model. Data on what we might call the ‘bottom line impact’ of government support for child care is not easy to come by. However, available evidence suggests that public spending on child care is driving the profitability of private businesses in the industry. In 1999–2000, for-profit child care providers received more than $280 million in public funding. This constituted no less than 44 per cent of their combined total income – slightly more than the proportion of total income received as public funding by not-for-profit providers (Australian Bureau of Statistics 2001, p. 39). More recently, the Sydney Morning Herald reported figures to support the calculation that ABC Learning gained precisely 44 per cent of its total revenue in 2005 from government subsidies (Sydney Morning Herald editorial 2006) However, there are some documented problems with reliance on for-profit provision to meet the growing need for child care in Australia. In Chapter 3 of this volume, Deborah Brennan suggests there is downward pressure on standards, cost-cutting to improve profits, and inadequate planning that leads to maldistribution of services. Elsewhere, Jennifer Sumsion (2006) eloquently outlines the problems, actual and potential, of corporatisation in Australian child care.
Moreover, it is not clear that Australians welcome the emergence to dominance of for-profit provision in child care. AuSSA 2005 asks respondents to say, in general, who they think is best to deliver various social services, including child care.5 Table 7.2 shows their responses, with the most frequent response
145within a group marked by a box. The first line of the table shows that respondents are more likely to prefer governments to deliver child care than any other kind of organisation (34 per cent). Businesses are the least preferred organisation – only 16 per cent of respondents think them best to deliver child care. Families and community organisations fall in between at 24 per cent and 19 per cent support, respectively.
Within this broad pattern of responses are some mostly small, but interesting variations between social groups. Table 7.2 also shows that women are slightly more likely than men to prefer governments and families and relatives, while men are slightly more likely than women to prefer community organisations and businesses. Australians with university education are more likely than those without to prefer business provision and community organisations, and less likely to prefer governments and families. Predictably, respondents who identify with the Liberal Party are more likely than ALP identifiers to prefer business and families, and less likely to prefer governments and community organisations. Once again, we see that the presence of children in their households does not seem to distinguish this group of Australians strongly from the overall population. However, respondents who have received Child Care Benefit in the last five years, and so have used some formal child care, do show more distinctive preferences. These Australians are more likely than respondents in general to prefer businesses, and less likely to prefer families and relatives. Nevertheless, as with all groups, government remains the preferred provider within this group by a margin of six percentage points.
The dominant pattern of public preference, then, is at odds with the direction in which the childcare sector is evolving. Taking all respondents who expressed a view,6 more than half of all respondents express a preference for non-profit provision, that is, they prefer either governments or community organisations to deliver child care, while a further large minority prefer family provision to either for- or non-profit child care. Even the group most likely to express a preference for businesses, recipients of CCB, are around twice as likely to express a preference for nonprofit provision.
146
Table 7.2 Attitudes to who best to deliver child care, Australia, 2005, by sex, education, party identification, presence of children and receipt of CCB, per cent
| Governments | Community organisations | Businesses | Families and relatives | Can’t choose | (n=) | |
| All respondents | 34 | 19 | 16 | 24 | 7 | (1848) |
| Women | 35 | 18 | 14 | 26 | 7 | (938) |
| Men | 33 | 20 | 18 | 23 | 6 | (893) |
| Bachelor deg. or higher | 29 | 21 | 23 | 20 | 6 | (411) |
| No university education | 35 | 19 | 14 | 26 | 7 | (1437) |
| Liberal Party identifiers | 32 | 18 | 19 | 26 | 5 | (644) |
| ALP identifiers | 39 | 20 | 12 | 24 | 7 | (567) |
| Children present in household | 33 | 16 | 18 | 26 | 7 | (522) |
| Received Child Care Benefit in the last 5 yrs | 32 | 18 | 26 | 17 | 7 | (138) |
Source: Australian Survey of Social Attitudes, 2005
147
Is it the economy, stupid? Rationales for public subsidies for child care
We have seen that Australians were more likely to prefer governments to deliver child care than any other kind of organisation. We have also seen that governments are not major providers of child care – although they are, along with parents, major funders of child care. A new item in AuSSA 2005 sought to understand what kinds of rationales for public subsidies to child care do Australians support. The survey asked respondents which of the following is the most important reason why the government should subsidise child care for preschool-aged children. Respondents were asked to choose one response only. The options were:
- to help the economy by enabling parents to stay in workforce
- to promote equal opportunities for women and men
- to provide young children with a variety of experiences
- can’t choose.
The first response taps an ‘economic’ rationale for government subsidies to child care; the second a ‘gender equity’ rationale, and the third a ‘children’s welfare’ rationale.
Before we move on to look at how Australians responded to this question, it is worth noting that both the present Coalition government and the Opposition emphasise the economic rationale in their policy statements on child care. Perhaps the most comprehensive policy statement of the Coalition’s period in government is the document called Tax reform: not a new tax, a new tax system. In this document, the government sets out its plans for rationalising the childcare payments system under the goal of creating ‘a system to ensure that all Australians—especially low and moderate income families – have much stronger incentives to work and save’ (Costello 1998, p. 44). Practical arrangements reflect this emphasis; subject to relevant income tests, working parents are eligible for more than twice as many hours of subsidised child care than are parents who are not in the workforce (50 hours per week per child compared to 24 hours) (Family Assistance Office 2006, p. 15). In much the same vein, in 2006, then Leader of the 148Opposition Kim Beazley introduced the ALP’s approach to child care in his speech on that topic as ‘tackling … [a] … long term challenge: removing the barriers to workforce participation which are holding our economy back’ (2006, p. 2).
Table 7.3 shows responses to this question for all (in the first line) and then several subgroups of respondents. Focusing first on all respondents, the rationale most commonly chosen is economic (36 per cent), with the remainder dividing pretty evenly between gender equity (22 per cent), children’s welfare (22 per cent) and can’t choose (20 per cent). Among the subgroups we see some interesting patterns. Women are more likely than men to choose the gender equity rationale (27 versus 17 per cent). Among respondents with university education, equal proportions choose economic and gender equity rationales (32 per cent), while those without university education strongly prefer the economic to the gender equity rationale (37 versus 20 per cent). Differences between Liberal and ALP identifiers are small, while Green identifiers stand out as the only subgroup strongly preferring a gender equity rationale to all others, at 48 per cent. Once again, the presence of children appears to make virtually no difference to attitudes to government subsidies for child care. However, respondents from households that have received Child Care Benefit within the last five years do have a somewhat different preference structure; they are more likely than the average respondent to prefer the economic and children’s welfare rationales, and more likely than all other groups to make a choice at all (that is, these respondents have the lowest rate of ‘can’t choose’ response).
Clearly the proportion of people who respond ‘can’t choose’ on the rationales question is much higher than for other survey items I discuss in this chapter. There are several possible reasons for this high rate. First, it may be that respondents who can’t choose do not want to prioritise – they can see the value of more than one rationale, and genuinely can’t choose between them. Second, it may be that at least some of the respondents who can’t choose reject the idea of public subsidies for child care – we designed this question with a forced choice, and did not offer the option to respond ‘the government should not subsidise child care’. However, cross-tabulating this item with ‘Who is best suited to deliver child care’ revealed that fully 15 per cent of those who responded that 149governments are best suited could not choose a response on the ‘rationales’ item, suggesting that opposition to government subsidies altogether at best explains only part of the ‘can’t choose’ response. Third, these respondents may have simply been confused by the question, which is probably cognitively complex, and so harder to understand and choose a response than on other items that rely more on ‘gut’ reactions (Carmines & Stimson 1980, cited in Berinsky, 2004, p. 10).
Table 7.3 Rationales for public subsidies to child care, Australia, 2005, by sex, education, party identification, presence of children and receipt of CCB, per cent*
| Economic | Gender equity | Children’s welfare | Can’t choose | (n=) | |
| All respondents | 36 | 22 | 22 | 20 | (1898) |
| Women | 34 | 27 | 21 | 19 | (975) |
| Men | 38 | 17 | 22 | 23 | (904) |
| Bachelor deg. or higher | 32 | 32 | 19 | 17 | (420) |
| No university education | 37 | 20 | 23 | 21 | (1478) |
| Liberal Party identifiers | 37 | 20 | 23 | 20 | (653) |
| ALP identifiers | 40 | 23 | 21 | 15 | (577) |
| Green identifiers | 16 | 48 | 15 | 21 | (105) |
| Children present in household | 37 | 22 | 22 | 20 | (527) |
| Received Child Care Benefit in the last 5 yrs | 40 | 22 | 26 | 12 | (139) |
Source: Australian Survey of Social Attitudes 2005.
* Rounding leads to some minor divergences from sums to 100 across rows.
150Despite the high ‘can’t choose’ rate, it is clear that more respondents support the economic than support either of the gender equity and child welfare rationales for public subsidies to child care. It could be argued, then, that the major parties’ emphasis on the economic rationale accords with the most widely held view among Australians. However, there is another way of interpreting the findings presented in Table 7.3. This is to point out that a minority of respondents overall, and of all the identified subgroups, actually agrees that the most important reason why governments should subsidise child care is to help the economy by enabling parents to stay in the workforce. Indeed, respondents who made a choice at all were at least as likely to choose a non-economic rationale; one aimed at meeting the needs of either women or children. Taken as a whole, three fifths of respondents did not see the economic rationale as most important, suggesting that there are broad constituencies for policies grounded in the principles of gender equity and children’s welfare that have long motivated Australian childcare advocates and activists.
Conclusions
The findings presented in this chapter suggest that there is room for a political contest over the economic structure of the child care sector, and for the kind and level of public investment in it. The major political parties may agree that the private sector is well suited to provide childcare services, but this is not a view widely shared by Australians, a majority of whom prefer non-profit provision. Further, we have seen that a majority of Australians prioritises non-economic rationales for government subsidies to child care, whether child welfare or gender equity. This suggests that the intrinsic, non-economic benefits of child care are important to many Australians, who might form a constituency for increased spending on childcare services to create a universal system that provides both good experiences for children and good working conditions for those employed to care for them. Certainly, further research on the kinds of public support for child care that Australians would find most reasonable and effective would be well worth doing.
151
References
Anderson, F 2006, ‘Three times over headline is not child’s play’, Australian Financial Review, 27 July.
Australian Bureau of Statistics 2001, Community services Australia, 1999–2000, cat. no. 8696.0, ABS, Canberra.
Australian Bureau of Statistics 2006, Australian social trends, 2006, cat. no. 4102.0, ABS, Canberra.
Australian Institute of Health and Welfare 2005, Australia’s welfare 2005: Services and assistance, AIHW, Canberra.
Beazley, K 2006, Care for kids – Labor’s early childhood blueprint, Australian Labor Party, Blueprint no. 8, viewed 11 October 2006, www.alp.org.au/download/now/060728_sp_labors_early_childhood_blueprint___number_eight.pdf.
Berinsky, A 2004, Silent voices: Public opinion and political participation in America, Princeton University Press, Princeton.
Brennan, D 1998, The politics of Australian child care: philanthropy to feminism and beyond, revised edition, Cambridge University Press, Melbourne.
Costello, P 1998, Tax reform: not a new tax, a new tax system, Department of Treasury, Commonwealth of Australia, Canberra.
Department of Family and Community Services 2005, Census of Child Care Services 2004, Department of Family and Community Services, Canberra, viewed 19 October 2006, www.facsia.gov.au/internet/facsinternet.nsf/VIA/cc_census_04/$File/ccc04main1.pdf.
Family Assistance Office 2006, Information booklet about your claim for family assistance, Australian Government Family Assistance Office, Canberra, viewed 11 October 2006, 152www.familyassist.gov.au/internet/fao/fao1.nsf/content/claimforms-ccb.htm/$File/Ci011_0607.PDF.
Farouque, F 2006, ‘Where to now?’ from ‘Focus: The crisis in child care – an Age series’, The Age, 5 April.
Halliday, C & Dunn, A 2006, ‘Extra: This woman is smart, ambitious and a busy mother. She works 16 hours a week, and pockets less than $12 an hour. Why does she bother?’, The Age, 29 January.
Himmelweit, S & Sigala, M 2004, ‘Choices and the relationship between identities and behaviour for mothers with preschool children: some implications for policy from a UK study’, Journal of Social Policy, vol. 33, no. 3, pp: 455–78.
Manne, A 2006, ‘Infants require their parents, not caregivers’, The Australian, 25 May.
Meagher, G 2004, ‘Do Australians want a private welfare state? Are they getting one anyway?’ The Drawing Board: An Australian Review of Public Affairs, Digest, May, www.econ.usyd.edu.au/drawingboard/digest/0405/meagher.html.
Morris, S 2006, ‘Kelly ignites child care debate’, Australian Financial Review, 16 January.
O’Loughlin, M 2007, ‘Solving the child-care puzzle’, Australian Financial Review, 22 January.
Polimeni, M & Mitchell P 2006, ‘Fed: Government faces more pressure from within to overhaul childcare’, Australian Associated Press General News, 16 January.
Potts, D 2006, ‘When growth is easy as ABC’, Sun Herald, 26 March.
Sumsion, J 2006, ‘The corporatization of Australian childcare: Towards an ethical audit and research agenda’, Journal of Early Childhood Research, vol. 4, no. 2, pp: 99–120.153
Sydney Morning Herald 2006, ‘Editorial: The child care conundrum’, 14 August.
Wilson, S, Gibson, R, Meagher, G, Denemark D & Western, M 2006, Australian Survey of Social Attitudes 2005 (computer file), Australian Social Science Data Archive, The Australian National University, Canberra.
1 Even members of the government agree – Liberal MP Jackie Kelly is notorious for calling the system a ‘shambles’ in January 2006 (Morris 2006); National Party Senator Barnaby Joyce has called it ‘convoluted’ and ‘draconian’ and Liberal MP Judi Moylan has called for major reforms to remedy ‘systemic problems’ (Polimeni & Mitchell 2006).
2 The Australian Survey of Social Attitudes (AuSSA) is Australia’s national social survey. The Survey is fielded biennially and includes International Social Survey Program modules for Australia. The Survey is managed by the ACSPRI Centre for Social Research at the Research School of Social Sciences at the Australian National University, and is overseen by a team of Principal Investigators and advisors from the ANU and several other Australian universities. All fieldwork was conducted by the Australian Social Science Data Archive at ANU. The Survey relies on a random sample of registered voters, stratified by Australian states and territories, and uses a mail-out/mail-back methodology. In 2005, the number of respondents to the two AuSSA questionnaires totalled 3902, and represents a net response rate of 43 per cent. For more information, please refer to the Survey website: http://aussa.anu.edu.au.
3 These figures are calculated from tables 4.2.2, 5.2.2, 6.2.2 and 4.2.3, 5.2.3 and 6.2.3 in the Census of Child Care Services for 2004 (Department of Family and Community Services 2005).
4 These are my calculations, based on data presented in Table A3.3 in Australian Institute of Health and Welfare (2005).
5 Elsewhere I have examined the disjunction between attitudes to service delivery and actual patterns of ownership in the full range of social services surveyed; see Meagher (2004).
6 That is, excluding those who selected ‘Can’t choose’.