2
What is the risk of dying from prostate cancer?
We will all one day die of some cause that will be entered on our death certificate by our doctor or determined by a coroner if we have died suddenly without having been under recent medical care. In 2007, 70,569 men died in Australia out of a total male population of 10,358,791, meaning that 0.68% of men – around one in 147 – died in that year from any cause. Table 1 shows numbers and percentages of total deaths for the top 20 causes of death in males.
Table 1: Leading underlying specific causes of male death, all ages, 2007
| Rank | Cause of death | Number of deaths | % all male deaths |
|---|---|---|---|
| 1 | Coronary heart diseases | 12,119 | 17.2 |
| 2 | Lung cancer | 4715 | 6.7 |
| 3 | Cerebrovascular diseases | 4516 | 6.4 |
| 4 | Chronic obstructive pulmonary disease | 2965 | 4.2 |
| 5 | Prostate cancer | 2938 | 4.2 |
| 6 | Dementia and Alzheimer’s disease | 2415 | 3.4 |
| 7 | Colorectal cancer | 2221 | 3.1 |
| 8 | Diabetes | 1923 | 2.7 |
| 9 | Unknown primary site cancers | 1832 |
2.629 |
| 10 | Suicide | 1453 | 2.1 |
| 11 | Heart failure and complications and ill-defined heart diseases | 1361 | 1.9 |
| 12 | Pancreatic cancer | 1233 | 1.7 |
| 13 | Kidney failure | 1163 | 1.6 |
| 14 | Influenza and pneumonia | 1160 | 1.6 |
| 15 | Liver diseases | 977 | 1.4 |
| 16 | Land transport accidents | 948 | 1.3 |
| 17 | Leukaemia | 892 | 1.3 |
| 18 | Melanoma | 864 | 1.2 |
| 19 | Oesophageal cancer | 790 | 1.1 |
| 20 | Lymphomas | 780 | 1.1 |
| All deaths | 70,569 | 100.0 |
Source: Australian Institute of Health and Welfare National Mortality Database.
But what about prostate cancer as a cause of cancer death? Table 2 below showing cancer incidence and death indicates that prostate cancer is the second highest cause of cancer death in men in Australia after lung cancer. With 2938 deaths out of 70,569 male deaths in 2007, about 4.2% of all men’s deaths across all ages in that year were from prostate cancer. The probability of any given male of any age dying of prostate cancer in a single year was 0.03% or one in 3513. But as we will show below, this proportion is far larger for men in older age groups, because deaths from prostate cancer are very rare in men aged less than 40 and very uncommon in men aged less than 50. Men aged over 50 are sometimes described as being “at risk” for prostate cancer, although some urologists have recently tried to widen that label to include men in their 40s (see p43). 30
Table 2: New cases (incidence) of selected common cancers in males (2006) and mortality (2007) from those cancers, Australia
| New cases (incidence) | ||||
|---|---|---|---|---|
| Cancer site/type | Number | Per cent of total cancer | Crude rate per 100,000 | Risk to age 85 |
| Prostate | 17,444 | 29.5 | 170.0 | 1 in 5 |
| Colon | 4566 | 7.7 | 45.9 | 1 in 16 |
| Melanoma | 6051 | 10.2 | 59.6 | 1 in 14 |
| Lung, bronchus & trachea | 6030 | 10.2 | 60.6 | 1 in 12 |
| Rectum | 2866 | 4.9 | 28.3 | 1 in 27 |
| Lymphoma | 2518 | 4.3 | 24.7 | 1 in 33 |
| Head and neck | 2059 | 3.5 | 19.9 | 1 in 40 |
| Bladder | 1764 | 3.0 | 18.1 | 1 in 38 |
| Kidney | 1625 | 2.8 | 15.9 | 1 in 51 |
| Leukaemia | 1513 | 2.6 | 15.2 | 1 in 52 |
| Stomach | 1277 | 2.2 | 12.9 | 1 in 55 |
| Pancreas | 1158 | 2.1 | 10.2 | 1 in 70 |
| All cancers | 59,058 | 100.0 | 584.6 | 1 in 2 |
| Deaths | ||||
|---|---|---|---|---|
| Number | Per cent of total deaths | Mean age at death | ||
| Lung, bronchus & trachea | 4715 | 6.7 | 72.0 | |
| Prostate | 2938 | 4.2 | 79.8 | |
| Colon | 1295 | 1.8 | 73.0 | |
| Pancreas | 1233 | 1.7 | 70.7 | |
| Rectum | 896 | 1.3 | 70.6 | |
| Leukaemia | 892 | 1.3 | 71.7 31 | |
| Melanoma | 864 | 1.2 | 69.2 | |
| Oesophagus | 790 | 1.1 | 69.3 | |
| Lymphoma | 780 | 1.1 | 71.9 | |
| Stomach | 704 | 1.0 | 71.6 | |
| Head and neck | 667 | 0.9 | 68.3 | |
| All cancer except prostate | 19,624 | 27.8 | 71.5 | |
| All cancers | 22,562 | 32.0 | 72.6 | |
Sources: www.aihw.gov.au/cancer/index.cfm and correspondence from AIHW dated 26 July 2010.
As we saw above, the risk of a man dying of prostate cancer in one year was a very low 0.03% or one in 3513, and about 4% of all men will die from prostate cancer. Mostly these deaths occur at advanced ages. A man’s chance of dying of prostate cancer increases with age. Table 3 shows the numbers, rates per 100,000 men and probabilities of death of prostate cancer in one year in Australia.
As can be seen in the first column of Table 3, of the 2938 men who died from prostate cancer in 2007, more than half (1716 or 58%) were aged 80 or over and 82% were aged 70 or more. Just 2.8% (83 men) were aged less than 60, and 10 (0.1%) were in their 40s. The average age of death (note that this is a different concept than “life expectancy”) in men in Australia in 2007 was 76 years (see Table 2). So men who die from any cause after that time are already living longer than average. The data in the US are remarkably similar. There, the median age of death from prostate cancer from 2000 through to 2004 was 80 years, and 71% of deaths occurred in men older than 3275 years [13]. These figures will surprise many men accustomed to reading about men of much younger age dying of prostate cancer. Some certainly do die in middle age, but compared with death rates from other cancers, relatively fewer men die from prostate cancer in middle age.
Table 3: Number and rate of prostate cancer deaths and probability of death in one year, Australia 2007
| Age group and number of prostate cancer deaths | Rate per 100,000 and probability of death in one year |
|---|---|
| 40–44#: 3 | 0.4 (1 in 250,000) |
| 45–49: 7 | 0.9 (1 in 111,111) |
| 50–54: 18 | 2.6 (1 in 38,462) |
| 55–59: 55 | 8.7 (1 in 11,494) |
| 60–64: 142 | 26.6 (1 in 3759) |
| 65–69: 215 | 53.8 (1 in 1859) |
| 70–74: 315 | 101.1 (1 in 989) |
| 75–79: 567 | 223.1 (1 in 448) |
| 80–84: 713 | 413.8 (1 in 242) |
| 85+: 903 | 800.9 (1 in 125) |
| All ages: 2938 | 31.0 (1 in 3226) |
Source: www.aihw.gov.au/cancer/data/acim_books/index.cfm (prostate cancer) # no deaths were recorded in men less than 4033
What are the historic trends in prostate cancer deaths in Australia?
The total number of men dying in Australia from prostate cancer is increasing slowly each year. In the 39 years between 1968 and 2007, prostate cancer deaths grew from 963 to 2938, an average annual increase of 51 deaths per year, or one a week [44]. The two main reasons for this growth are that the age structure of the population is changing and the size of the population is growing. We have an aging population in Australia (the proportion of the total population in older age groups is steadily increasing). So both the number and the proportion of older people in the community are increasing as the post-World War II baby-boomer generation grows into old age. Moreover, because we have been so successful in reducing deaths from many causes of death that in past decades would have killed people earlier in life, many more men are surviving longer and so the numbers and proportions of deaths caused by diseases like cancer which tend to kill people later in life are rising. Life expectancy has increased. In 1950, male life expectancy in Australia was only 66.5. Today’s 79 years is a remarkable 18.8% increase on that, all in what is less than an eye blink of time in human history.
Major causes of death in men such as lung cancer, heart disease and motor vehicle injury have decreased dramatically in this period too. Because people have to die of some cause, reductions in some causes of death inevitably mean that more men will die from other causes instead. For example, if we want to see the rates per 100,000 of lung cancer deaths we see today in men, we have to travel back to 1962 [45].
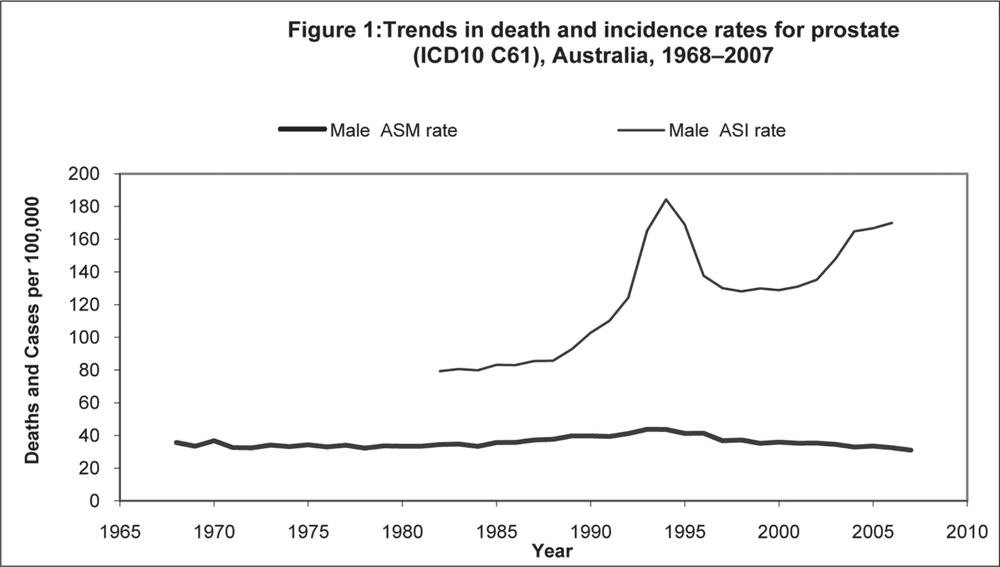
However, by looking at the age-standardised death rate per 100,000 men over time we get a very different picture, helpful in thinking about the question of whether this disease is really claiming “more” lives today. Age-standardised rates adjust for any changes in the 34age distribution in the population over time and so allow a valid comparison of rates over time. Table 4 is worth studying closely. Several broad trends are obvious. First, in the 39 years 1968–2007, the age-standardised death rate from prostate cancer has varied very little, with an average of 35.8 per 100,000 men and a range of 32.2 to 43.7. The most recent rate in 2007 (31 per 100,000) was very similar to the death rate at the beginning of this 38-year series in 1968 (35.6/100,000). In between there was a rise in the death rate (in the early- to mid-1990s) which has now reversed back to rates seen in the early 1970s, a decade before the PSA test became available. (“Incidence” means the number of new cases of prostate cancer diagnosed in that year).
However, looking at the data on cancer incidence, the same basically flat trend we see for deaths is not apparent. Instead we see a dramatic leap in the incidence of the disease from the early 1990s. This change has been largely sustained ever since, resulting in a startling difference in the risk of men being diagnosed with prostate cancer before the 1990s (approximately one in 22 men in their lifetime) to nearly three times that today (one in eight).
These patterns are obvious in Figure 1 below.
Two obvious questions arise here: what has caused this massive increase in the incidence of the disease? And if the death rates from the disease today are almost the same as they were 38 years ago when the known incidence of the disease was much lower, then what can be said about the relationship between the rising incidence of the disease and the failure of the death rate to change in the same dramatic fashion? 35
Table 4: Age-standardised death and incidence rates of prostate cancer, 1968–2006
| Year | Death rate per 100,000 | Risk to age 75 of death from prostate cancer | Incidence rate per 100,000 | Risk to age 75 of prostate cancer being diagnosed |
|---|---|---|---|---|
| 1968 | 35.6 | 1 in 78 | National incidence data were not kept prior to 1982 in Australia | |
| 1969 | 33.4 | 1 in 77 | ||
| 1970 | 36.8 | 1 in 74 | ||
| 1971 | 32.6 | 1 in 84 | ||
| 1972 | 32.4 | 1 in 78 | ||
| 1973 | 34.1 | 1 in 70 | ||
| 1974 | 33.2 | 1 in 77 | ||
| 1975 | 34.3 | 1 in 83 | ||
| 1976 | 33.0 | 1 in 72 | ||
| 1977 | 34.0 | 1 in 78 | ||
| 1978 | 32.2 | 1 in 82 | ||
| 1979 | 33.6 | 1 in 72 | ||
| 1980 | 33.4 | 1 in 76 | ||
| 1981 | 33.4 | 1 in 79 | ||
| 1982 | 34.5 | 1 in 77 | 80.8 | 1 in 23 |
| 1983 | 34.7 | 1 in 82 | 80.1 | 1 in 24 |
| 1984 | 33.3 | 1 in 73 | 83.2 | 1 in 22 |
| 1985 | 35.7 | 1 in 80 | 82.9 | 1 in 22 |
| 1986 | 35.7 | 1 in 72 | 85.5 | 1 in 22 |
| 1987 | 37.2 | 1 in 73 | 85.7 | 1 in 22 |
| 1988 | 37.6 | 1 in 66 | 92.7 | 1 in 21 36 |
| 1989 | 39.6 | 1 in 68 | 102.7 | 1 in 20 |
| 1990 | 39.7 | 1 in 65 | 110.1 | 1 in 17 |
| 1991 | 39.3 | 1 in 68 | 124.1 | 1 in 16 |
| 1992 | 41.2 | 1 in 60 | 165.0 | 1 in 14 |
| 1993 | 43.7 | 1 in 62 | 184.2 | 1 in 9 |
| 1994 | 43.6 | 1 in 63 | 168.6 | 1 in 8 |
| 1995 | 41.2 | 1 in 63 | 137.6 | 1 in 8 |
| 1996 | 41.3 | 1 in 68 | 129.9 | 1 in 10 |
| 1997 | 36.8 | 1 in 74 | 128.0 | 1 in 11 |
| 1998 | 37.2 | 1 in 74 | 129.7 | 1 in 11 |
| 1999 | 35.2 | 1 in 82 | 128.4 | 1 in 11 |
| 2000 | 35.9 | 1 in 76 | 130.6 | 1 in 11 |
| 2001 | 35.2 | 1 in 82 | 134.5 | 1 in 11 |
| 2002 | 35.3 | 1 in 84 | 147.2 | 1 in 10 |
| 2003 | 34.5 | 1 in 80 | 164.3 | 1 in 9 |
| 2004 | 32.9 | 1 in 88 | 164.4 | 1 in 8 |
| 2005 | 33.5 | 1 in 86 | 166.6 | 1 in 8 |
| 2006 | 32.3 | 1 in 89 | 170.0 | 1 in 7 |
| 2007 | 31.0 | 1 in 104 | Not available | |
Source: www.aihw.gov.au/cancer/index.cfm (cancer incidence and mortality data)37
Source: Age-standardised to the Australian Standard Population 2001. Australian Institute of Health and Welfare (AIHW) 2010. ACIM (Australian Cancer Incidence and Mortality) Books. AIHW: Canberra
38The answer to the first question is simple: we are finding more cancers because there is more testing. The rising incidence of the disease does not mean that within a few years, there was somehow a sudden “spread” or rise of the disease – that many more Australian men were somehow acquiring prostate cancer. There is no claim being made by anyone that this has occurred, in the way for example we can easily demonstrate historical rises in the incidence of lung cancer as a time-lagged response to rising smoking rates 30 to 40 years before. Instead, the rise can be readily explained by the spread of PSA testing and the related phenomenon of the rise of voices urging that men be screened for the disease.
The second question – why there has been no significant change to the prostate cancer death rate in nearly 40 years – suggests that if the main argument in favour of finding all the previously undiagnosed prostate cancer is that this will reduce deaths from the disease, then this plainly has not happened. Further evidence relevant to this fundamental point is discussed on page 97 where we consider the results of two important randomised controlled trials of the PSA test, examining whether screening across a large number of men saves lives.