CHAPTER 3
PROCESS AND PRODUCTION
While the emergence of a shore whaling industry in Western Australia was part of a world–wide economic phenomenon, its pattern of development was very much a function of the emerging colonial economy. This chapter explores the nature of shore whaling in Western Australia, with an emphasis on how changes within the following four sub–systems influenced the general progress of the industry and by extension the archaeological patterns examined in later sections.
1. Employment conditions and structures within the shore whaling industry, with a profile of the workers and owners, their involvement in the industry, and the various conditions and controls under which they laboured.
2. The scale of shore whaling operations, including changes in the size and composition of the whaling parties and the number of stations used along both the south and west coasts.
3. The supply of whaling equipment to the colonial whalers, including the rate at which new technology diffused into the local industry, and evidence for local manufacture of whalecraft.
4. Local modes of whaling, including the efficiency of the shore whaling operation, and the relationship between the whale species caught and the success of the industry.
EMPLOYMENT CONDITIONS
Employment Structure and Payment systems
By the 19th century the similarities in equipment and process for pelagic, bay and shore whaling, combined with the constant flow of workers around the globe and between the various levels of the industry, had resulted in a relatively homogeneous employment structure and terminology. The basic structure and hierarchy of the six–man boat crews (boat hands, harpooner/boat–steerer, headsman) has already been described in Chapter One. However, the larger shore fisheries may also have had a look–out, a cooper, a cook and several other workers who would assist in the processing of the whale. Operations were overseen by a station manager, who in some instances was also the chief headsman. The station owners were not necessarily present at the stations and normally are not counted as a member of the party.
In the absence of mechanization, whaling during the 19th century relied upon the skills, knowledge and loyalties of its workers. Poor performance by the crews could seriously impair the ability of a boat to chase, fasten and kill whales, making seasoned hands a valuable commodity in both shore–based and pelagic whaling. One of the central themes of this chapter is the great difficulty suffered by the colonial whaling parties in obtaining and retaining experienced workers.
Although the dependence on the abilities of the crews to obtain a reasonable result put the owners and managers of the whaling parties at the mercy of their men, this was to a large extent mitigated by the operation of the lay system of payment described in Chapter One. A lay was a fixed percentage share of the total catch value, which varied with an individual's experience and position in the party. In broad terms it was incentive–based, with hard work and skill potentially increasing the profit to be claimed by the men. On the other hand, a poor season could see the whalers left penniless, with the owner not obliged to pay them any wage at all, or even able to charge them for expenses. If one or more members within a whaling party withheld their services, the potential reduction in returns would come from both their and all other members' share of the value, a powerful incentive for self–regulation within the crews.
There are few documented examples of the pay scales to which the Western Australian whalers worked. The most detailed is in a report of 1838, which states that:
the lay given to a mariner in this colony amounts to a 1–75th; the lay to the steersman to 1–45th; the lay given to the headsman, 1–17th; manager, 1–15th: amounting in all to 65 percent, besides provisions (PG 20/10/1838).
In 1838 the Western Australian Whaling Company (Safety Bay) advertised for able–bodied men to work for a lay of 1/50th, with all provisions found (PG 5/5/1838). The 1850 Castle Rock agreement (Figure 3.1) suggests a crewman would receive a 1/40th lay, less any expenses owing. Seymour's 1846 journal from the same station also shows that further incentives could also be given, such as a prize of six pounds of tobacco being offered to the first man to spot a whale which was subsequently killed (Seymour n.d. 1/8/1846). Although there is clearly variation, this scale of payments seems consistent with those known for shore fisheries in other parts of Australasia (e.g. Prickett 2002:5; Nash 2003:76).
As noted in Chapter Two, payments for Aboriginal workers appear to have varied depending upon the station involved. In some instances they were paid a full lay at the end of the season, equivalent to other workers (Inq 29/11/1848). However, in other instances they were paid immediately following each whale caught, or with food and goods (Inq 29/5/1850). 33
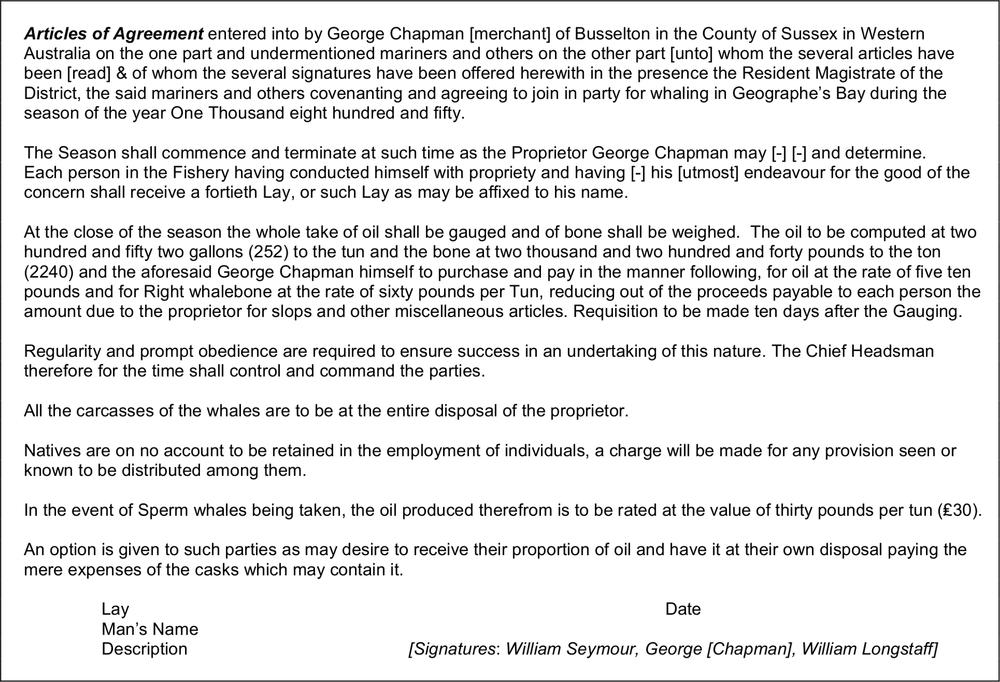
Figure 3.1 Transcript of 1850 Contract Agreement for Castle Rock whaling station (Battye Library 1208A).
The 1850 Castle Rock agreement (Figure 3.1) provides the only surviving contract for a Western Australian shore station. Although it cannot be assumed that this was a standard arrangement, it is suggestive of the range of expectations. Most if not all food, housing and other basic supplies during the season would also have been provided by the owner, although as suggested by the Castle Rock agreement some costs were also deducted from the lay at the end of the season.
Worker Experience and Involvement Patterns
As part of this study a biographical database of 575 men working in the Western Australian shore whaling industry was compiled, documenting their employment and position at particular stations in each season, their race or ethnicity and any other relevant details (see Gibbs 1996, Appendix E). While drawing from the widest possible range of government, newspaper and manuscript sources, it must be noted that it is still not a complete listing of workers, particularly for the period prior to the commencement of official registrations of whaling crews in 1849 (discussed below). This fact undoubtedly affects some of the statistical information presented below, but is unavoidable. Similarly, developing work histories of individuals was limited by the available evidence.
A 20% sample of database listings was cross–referenced against the Bicentennial Dictionary of Western Australians (Erikson 1988). Although the dictionary is also not meant to be an exhaustive listing of the pre–1888 colonial population, an appreciable portion is represented in some form. It is worth noting that of the stratified sample of 115 names checked (consisting of up to three randomly chosen entries on each page of the database), only 55 (48%) appeared in the Dictionary. Of these, 15 entries were of minimal detail and provided no biographical data at all. If we assume that this is representative of the whole database, it makes an interesting statement on the relative historical visibility (or invisibility) of the whaling population.
Two hypotheses were formed to account for this phenomenon. The first is that the whaling hands were primarily labourers who, by virtue of limited literacy and/or not owning land, were unlikely to be the subject of documentation. This proposition is almost impossible to address, given that it requires the very documentary material which is in such short supply. The second hypothesis is that the majority of whalers were resident in the colony for only short durations, limiting the potential for them to be recorded in either official or private documents.
As described in the Chapter Two, the historical record suggests that in its early years the whaling industry drew heavily upon the small and usually unskilled body of free labourers within the colony (Moore 1884; PG 22/4/1837). In the re–emergence of the industry during the 1840s the employment situation appears to have changed, with an increasing component of the workforce being comprised of whalers from the mainly American 34whaling vessels operating along the coast. Observing the Western Australian shore–whalers during the late 1850s, American whaler William Whitecar (1860:91) recorded that ‘the officers, boat steerers and, if they can be procured, two–thirds of the crews are American’. While this may be an exaggeration, the biographical database provides evidence that at least from the 1840s onwards the key positions in the colonial whaling parties were commonly filled by experienced workers not of local origin.
Of the 49 men listed as boat–steerers in the database, only 17 (or 34%) had previously been registered in a Western Australian whaling party. Even more striking is that of the 48 men listed as headsmen, only 5 (or 10%) had previously been recorded as workers in the Western Australian fishery. It is possible that in part this results from the absence of pre–1849 records, so that earlier involvement is simply not recorded. However, the pattern seems to hold for the later periods, with new headsmen and boat steerers simply appearing in the parties. Although it was not usually possible to determine the nationality of these men, there is a reasonable presumption that a fair proportion of them could have been American, or at least from American whaleships.
The age structure of the Western Australian whalers appears to provide further support for the degree of involvement by experienced foreign workers. For the 40 men (from a random sample) for whom further biographical information was available, Figure 3.2 records their age in the year of the first season in which they reported as working for a Western Australian whaling party. Given the physical nature and danger of whaling, it might be expected that the majority of first–time whalers would be young men. While this may be represented on the graph by the slight concentration in the pre–25 year age group, the relatively wide spread of ages is suggestive of the arrival of older, experienced workers in the colony.
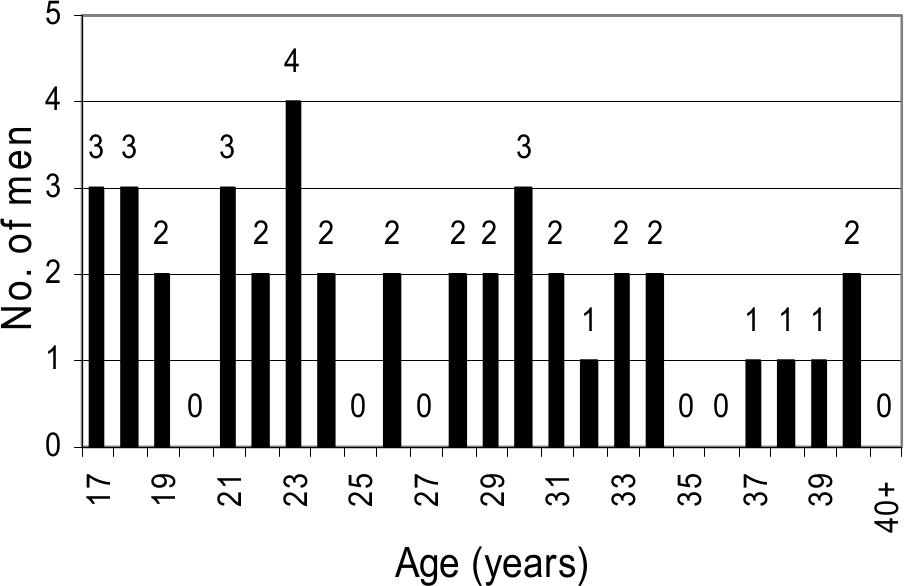
Figure 3.2 Age of whalers during first recorded season.
The recorded duration of workers' involvements in the Western Australian whaling industry was established by calculating the difference between the first and last engagements recorded in the database. Figure 3.3 clearly shows that the overwhelming majority of workers were reported for only short periods. On the west coast apparently 78% of workers participated for only one year, while 94% had departed after three years. The situation was slightly better on the south coast, with 70% apparently working only one year, and 85% gone after three years. While some proportion of this group probably comprised settlers who simply participated in the industry for a brief period before quitting, the general pattern supports the hypothesis of a short presence in the colony. The implication of this high turn–over of men is that the colonial whaling parties had difficulties in establishing a stable and experienced labour force.
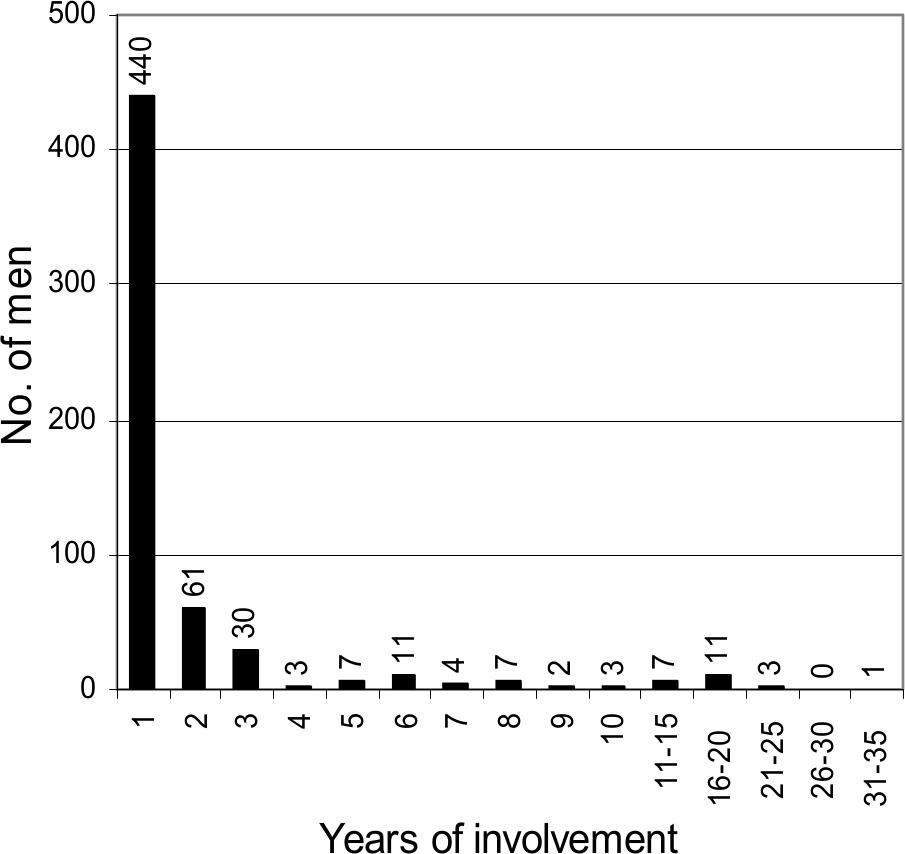
Figure 3.3 Duration of worker involvement.
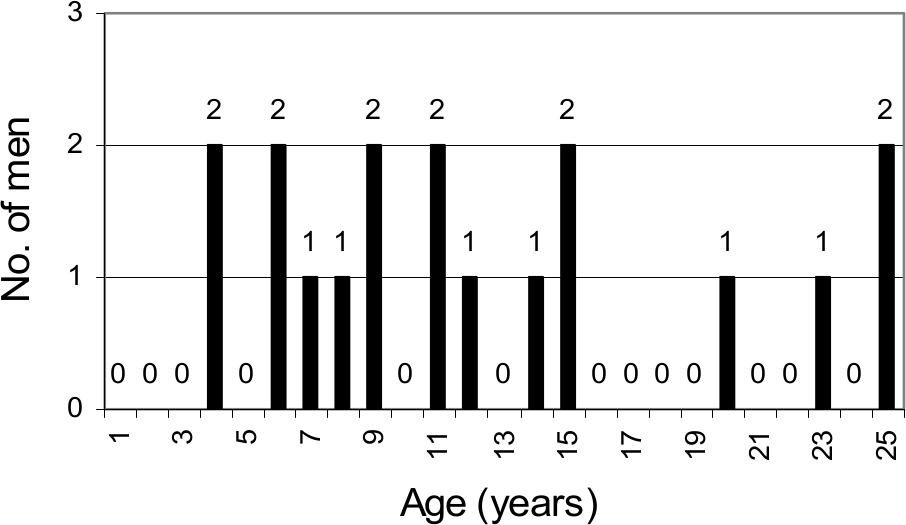
Figure 3.4 Age of headsmen in first recorded season.
To investigate this pattern further, the age of first involvement and duration of involvement in the industry by headsmen as a discrete group were also examined. Although there was only a sample of 18 ages available, Figure 3.4 shows that in comparison to the industry as a whole the headsmen formed a slightly older group. This is not surprising, as to attain the necessary level of skill would have required at least several years of experience in a whaling crew.
Figure 3.5 shows that the population of headsmen was also susceptible to a high turnover, with 48% staying 35only one season and 60% departing after three seasons. This is partially offset by the 20% who maintained involvement for over ten years, often managing or even owning the parties they worked in.
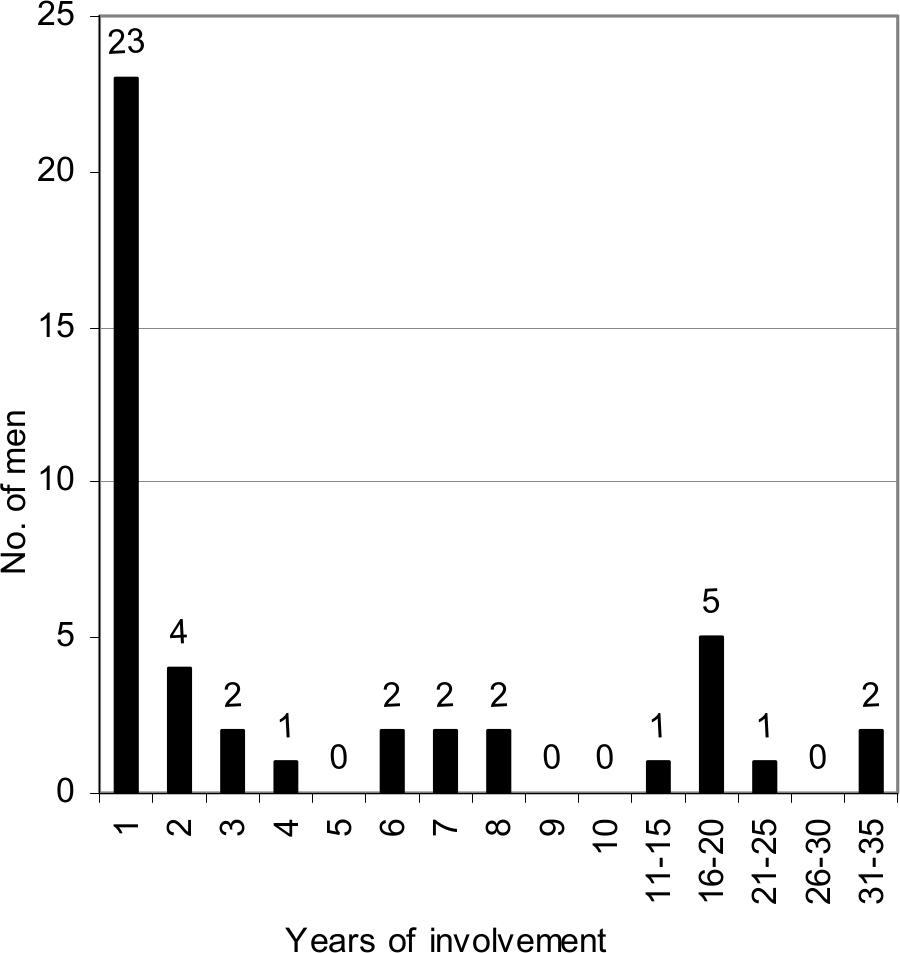
Figure 3.5 Duration of headsmen involvement.
The documentary record would strongly suggest that the supply of foreign labour and the apparent fluidity within the Western Australian whaling workforce were a function of the high level of desertion and recruitment associated with the American whaling fleet. Desertion of discontented whalers from visiting ships was frequent and geographically widespread. While it usually involved individuals, on a number of occasions large groups of half a dozen men or more were reported absent from their vessels (PG 26/5/1838; Inq 4/12/1841; Inq 9/2/1848; PG 3/1/1851; PG 26/1/1853). It is not surprising that, despite the illegality of employing deserters, the colonial whaling parties would eagerly engage experienced men. There are even a number of documented complaints by American captains that the settlers were actively attempting to entice sailors into leaving their ships and joining the shore parties (Inq 21/3/1841; Inq 17/3/1849). Conversely, the readiness of these men to leave colonial employ is also well documented (PG 23/8/1850).
The apparent inability of the colonial shore parties to stem this attrition lay in part with the seasonal nature of the industry. Unlike pelagic whaling, the shore fisheries only operated for five months per year, so that for the other seven months the men were left to find alternative employment. For many of them the most attractive proposition was to ship out on the first whaling vessel which passed by.
The problem of how to employ the whalers off–season had been recognized as early as the first season in 1836, with the Western Australian Association suggesting that suitable work could be arranged on nearby farms (Anon. 1836). These sorts of measures were only ever organized on an individual station basis, such as the Fremantle Whaling Company's attempt to keep its men (and equipment) engaged after the close of the 1837 season by forming sealing parties along the west coast (PG 13/1/1838). A number of problems were encountered and this experiment was not repeated in the following year. There is also evidence to suggest that during the summer months at least some of the south coast whaling crews were employed in sealing along the islands of the Archipelago of the Recherché (Sale n.d.; McKail 1927).
A successful but short–lived effort at arranging off–season employment for whalers was made on the south coast in 1847, when Hugh MacDonald suggested that for the remainder of the year these men could be engaged in cutting sandalwood (Garden 1977:78). For several years sandalwood exports to China boomed, until the growth of a considerable stockpile depressed the price and brought the industry to a halt. It can only be supposed that the whalers then reverted to other forms of seasonal labour such as kangaroo hunting or farm work.
A more serious problem was the mid–season desertion of hands from the shore fisheries. Quinlan's studies of labour relations in the whaling industries of Tasmania, South Australia and Western Australia suggest that this could take several forms (Quinlan 1992; Quinlan et al. 2003). Men might simply abscond from a fishery without leave, they might be deliberately lured away or ‘crimped’ by another party (Quinlan 1992:22), or they might join the crew of a whaleship and depart the settlement altogether. However, there are only limited historical records of Western Australian whalers being reported temporarily absent without leave (PG 13/5/1837; Seymour n.d.), while there are no known accounts of hands moving between colonial parties mid–season. This may well have been because of the relative isolation of the stations and the difficulties of moving over such distances.
Desertion as a result of recruitment by American whaleships is by far the most frequently mentioned difficulty. American whalemen who had abandoned their ships and joined the local parties were particularly susceptible to such offers. After visiting the Barker Bay station near Albany in 1857, the Whitecar (1860:219) recorded in his diary that
amongst the men at the fishery were several Americans who had been in this part of the world for years; they did not like the country, and, if we had wanted men, would gladly have engaged and gone home with us.
The removal of key employees in mid–season could seriously endanger the success or even existence of the shore–parties, such as reported for Bunbury station in 1850 (PG 23/8/1850) and Barker Bay in 1860 (Inq 27/8/1860).
36Ethnicity
The race or ethnicity of the shore whalers is difficult to determine in most cases, with their names usually anglicized in the records. However, the Western Australian whaling industry clearly shared the diverse racial background that characterized whaling enterprises around the world. William Amersely (or Hamersley) worked as headsman on various stations on the west coast between 1848 and 1862, and is recorded as being ‘an African native who had had experience in American whaling ships’ (Heppingstone 1966:36). William Parr, also known as ‘Butty’ or ‘Batty’ was a Maori who worked on both the west and south coasts from the mid–1850s until at least 1872 when he was in his 60s (Erikson 1988:2419). Butchart (WA 22/7/1933) described him as the champion headsman, ‘a fine, big chap... his face and chest were scarred by tribal marking. His father was supposed to be a tribal chief’. Chapter Two has already discussed Aboriginal whalers working within the industry. Other names hint at non–European origins (see Gibbs 1996, Appendix E), although confirmation of a non–European background is very difficult.
Development of Labour Legislation
While desertion of crew members posed a serious threat to the success of the shore whaling parties, disruption to their operation could also come through other forms of misconduct by workers. The paucity of documentary sources means that only a few specific incidents of misconduct, used here to refer to any deliberate action by a worker which impaired the operation of the whaling party, appear in the historical record. Complaints about food appear to have been a common cause, with two of the boat hands in the 1845 Bathers Beach party refusing to attend to their duties, even after a whale had been sighted, claiming that they had been ‘ill–treated on the supply of provisions’ (PG 30/8/1845). Other references are vague, such as a member of the 1845 Carnac Island party declining to work as the result of ‘a private broil’ (PG 30/8/1845).
However, Seymour's (n.d.) diary, as the only regular record of life at a whaling station, suggests that complaints and unrest amongst boat crews was a normal part of life at the Castle Rock fishery. The following excerpts (with the original spelling and grammar left uncorrected) illustrate just some of the difficulties recorded during the 1846 season.
| July 1st | All hands refused duty becose we had no sugar in our tea. |
| July 26th | Palmers boatcrew refused to man boat to fetch some flour but at last went but not willingly Carter saying they did not ship for it. |
| Aug 1st | Men growling saying the headsmen eat all the fat and leave them all the lean. |
| Aug 2nd | Petit started for the Vasse with his boat, Liby refuses to go unless he is paid for it. |
| Aug 16th | Corley growling becose he culd not have as much grog as he wanted. |
| Aug 25th | Clement returned from the Vasse drunk and his boats crew soon put hevery thing in an uproar and comensed fighting. |
| Oct 9th | Clement and most of the men drunk. |
In later years Seymour appears to have been less diligent in recording these sorts of events, although various other difficulties were recorded in the next several seasons.
By the mid–1840s the continued loss of men and the effects of various labour disruptions had become serious problems within the Western Australian shore whaling industry. Contemporary records suggest that the push towards developing specific legislation to regulate the conduct of whalers began in earnest in 1845, resulting from the incidents at the Carnac Island and Bathers Beach stations described above (PG 30/8/1845). The magistrate who tried the cases of the three men took into consideration not only the loss of a single whale, but also the potential effects such misconduct could have on the success of the industry. As a result, the three hands were each sentenced to three months imprisonment with hard labour as an example to the other workers (Inq 3/9/1845). Presumably the prosecutions were under the 1842 Master and Servants Act (Statutes of Western Australia, 6 Victoria No. 5) which governed the relationship between workers and employers, although as this did not really extend to maritime interests there is some uncertainty as to whether this law should (or could) have been applied in this situation (Crowley 1953).
Despite the severity of these penalties, problems with whaling hands continued during the 1846 season, prompting calls for the laws of engagement to be revised (Inq 9/9/1846; Inq 16/9/1846; Inq 23/9/1846). Agitation increased through the rest of the year, following the theme that desertions and misconduct threatened the success of the whole industry (Inq 18/11/1846, Inq 16/12/1846). The campaign was obviously successful, so that in September of 1847 An Ordinance to provide a summary remedy for Breach of Contracts connected with the fisheries of the Colony (Statutes of Western Australia, 10 Victoria, No.16) was passed to extend officially the 1842 Master and Servants Act to whalers.
Quinlan (1992) has traced the relationship between the 1847 Western Australian legislation, the 1844 South Australia Ordinance on which it was modelled, and the 1835 Tasmanian Ordinance on which this in turn was based. While the bulk of the Western Australian legislation simply copied the South Australian Ordinance, the level of negative sentiment in the colony created by the agitation described above is probably reflected in the increased severity of the penalties. Quinlan (1992:36) has summarized the legislation as follows.
37Further articles of agreement had to be witnessed before a justice, then lodged with the Government Resident for the district (s2), and a notice placed in the Government Gazette within two months of their signing (s3). Those employing whalers who had already engaged to another master were liable to a fine of 50 pounds (s4)... Likewise, under s5 articled whalers who engaged elsewhere were liable to forfeit their lays, to pay a fine equal to twice any advance received and to be sentenced to three months prison with hard labour.
Not all parties signed these articles, although perhaps not surprisingly the Castle Rock crew became the first group registered under the new legislation in 1849 (CSR 190/273: 12/10/1849). As noted, their handwritten 1850 contract agreement is the only surviving example for Western Australia (Figure 3.1).
These agreements became more common over time, with the lists of owners, headsmen, boat–steers and hands providing a significant insight into both the scale of the industry and the men who worked in it. No prosecutions under this ordinance were located, although the rapid decline in the numbers and activity of the American whaleships may well have resulted in a reduction in incidents of desertion in any case.
Development of Labour Legislation
While the new ordinance increased the control of station owners and managers over their workers, it provided no new benefits or assurances of better conditions for the men. In fact, it may well have left the whalers open to abuse from the station owners. In 1856 Captain Sanford, owner of the Port Gregory station, discharged Thomas Coombs from his fishery as ‘incapable of performing the duties for which he was engaged and signed articles’ (CSR 367/87: 5/8/56). Sanford henceforth refused either to feed Coombs or assist him with passage southward, despite there being little or no European settlement for the 350 kilometres of desolate country between Port Gregory and Fremantle, and no other settlers in the near area from which the man could earn his way home. It was only through the nearby convict depot admitting Coombs to the hospital that he was kept from dying alone in the bush, although Sanford remained unrepentant in his refusal to assist. John Thomas at Cheyne Beach was said to have made a similar threat to a station hand; that he either did the work he was engaged for, or was to leave and walk nearly 100 kilometres overland through the bush to get back to Albany (McKail 1927). Isolation apparently made an effective disciplinary threat.
Ownership and Management
As indicated in Chapter Two, the structure of ownership of whaling parties passed through several phases during the 44 years of the Western Australian industry. Unlike the rest of the workforce, the majority of owners are relatively easy to identify and correlate with other biographical sources. As people of at least some wealth and standing this group was more likely to keep records, correspond with the government or fellow settlers, own land, or engage in other pursuits which would lead to them being historically visible. It was possible to identify 93%, or all but four of the 57, in the Bicentennial Dictionary of Western Australians (Erikson 1988).
The first several whaling parties on the west coast of Western Australia were established with formal company structures and used capital drawn from a broad joint–stock investment. For reasons outlined previously, only the Fremantle Whaling Company was to survive its first season, carrying on for 14 years until dissolving in 1850 (Inq 4/12/1850). It should be noted that the large numbers of investors and committee members associated with the Fremantle Whaling Company and the Northern Whaling Company have been excluded from the general analysis. However, Statham (1980a) has shown that of the five major shareholders in the Fremantle Company during the 1840s, three were merchant wholesalers, one was the harbor master and the last was the chief headsman, John Bateman, who would later become a major merchant in the colony.
The revival of whaling during the 1840s saw a diversity of station owners, usually with one or two readily identifiable principal investors. Figure 3.6 shows the first year in which owners became involved in the industry. When cross referenced to the biographical database it can be shown that 91% of the new owners in the period from 1841 to 1850 lasted only a single season. From this group and over the next decade emerged several major operators who engaged in the industry for lengthy periods, although other people did occasionally appear for varying spans.
The south coast industry shows a similar, but not identical, pattern of ownership. The first two shore parties were organized by local merchants through partnerships with eastern Australian and foreign whalers; although by 1839 both of these had ceased operation. After a hiatus in whaling activity during the early 1840s the revived industry also saw a brief period with a high turn–over of ownerships. As for the west coast, 80% of these people for the years between 1841 and 1850 survived for only a single season, with only John Thomas and Thomas Sherratt maintaining a consistent presence for the next two decades. The south coast experienced a brief revival during the 1870s, once again with a number of operators becoming involved for short periods until the close of the industry in 1879.
The duration of involvement for owners on both coasts is shown in Figure 3.7. On the west coast 55% of owners lasted only one season, with 90% lasting three years or less. On the south coast 54% lasted only one season, while 79% continued for three seasons or less. The most likely explanation for the short periods of involvement is that the industry simply failed to return a profit, and may have even not repaid the investment in equipment and other expenses. There is also some 38evidence to suggest that successful operation of the shore parties might have been associated with prior whaling experience on the part of the owner.
Eight (24%) of the west coast owners and five (21%) of the south coast owners had previous whaling experience. In some respects this was not an essential criterion, as each station also had a manager who directed operations. However, all of the more successful and long–term owners such as Bateman, Sherratt and Thomas had prior whaling experience and continued to take active roles in their whaling parties, often working as the manager and chief headsman.
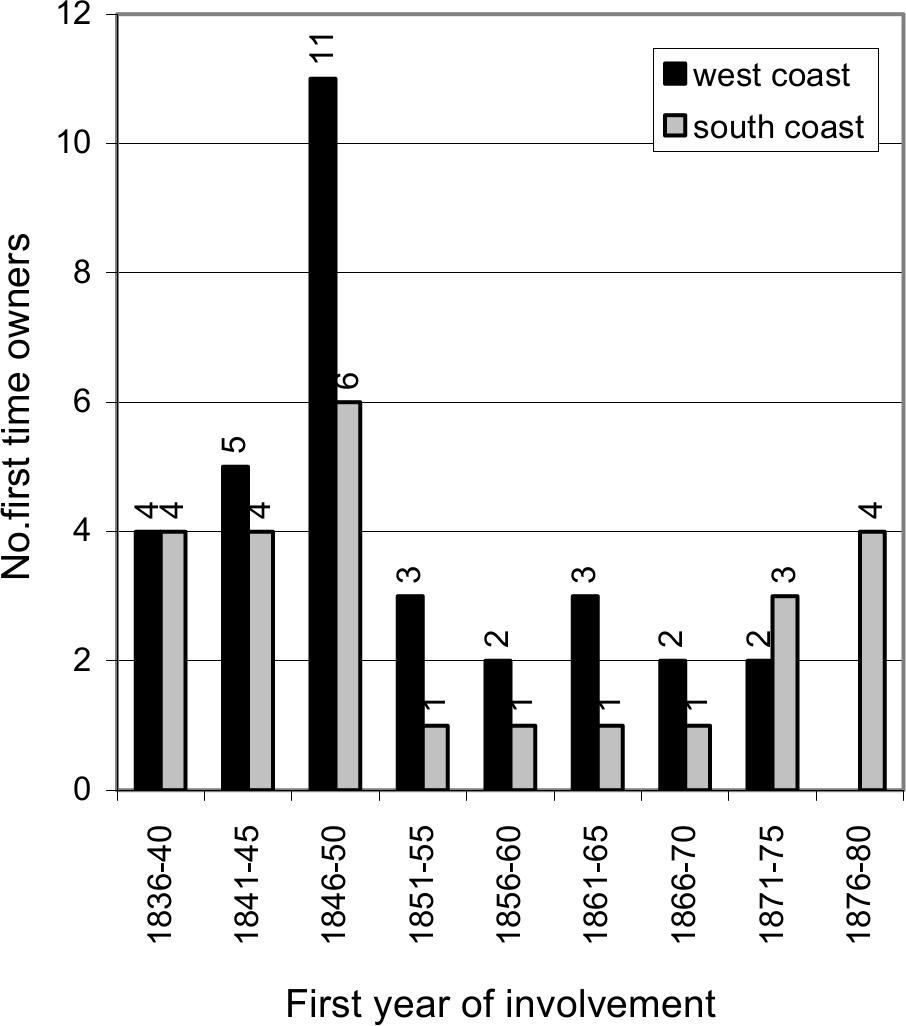
Figure 3.6 Frequency of first year ownership of whaling party - south and west.
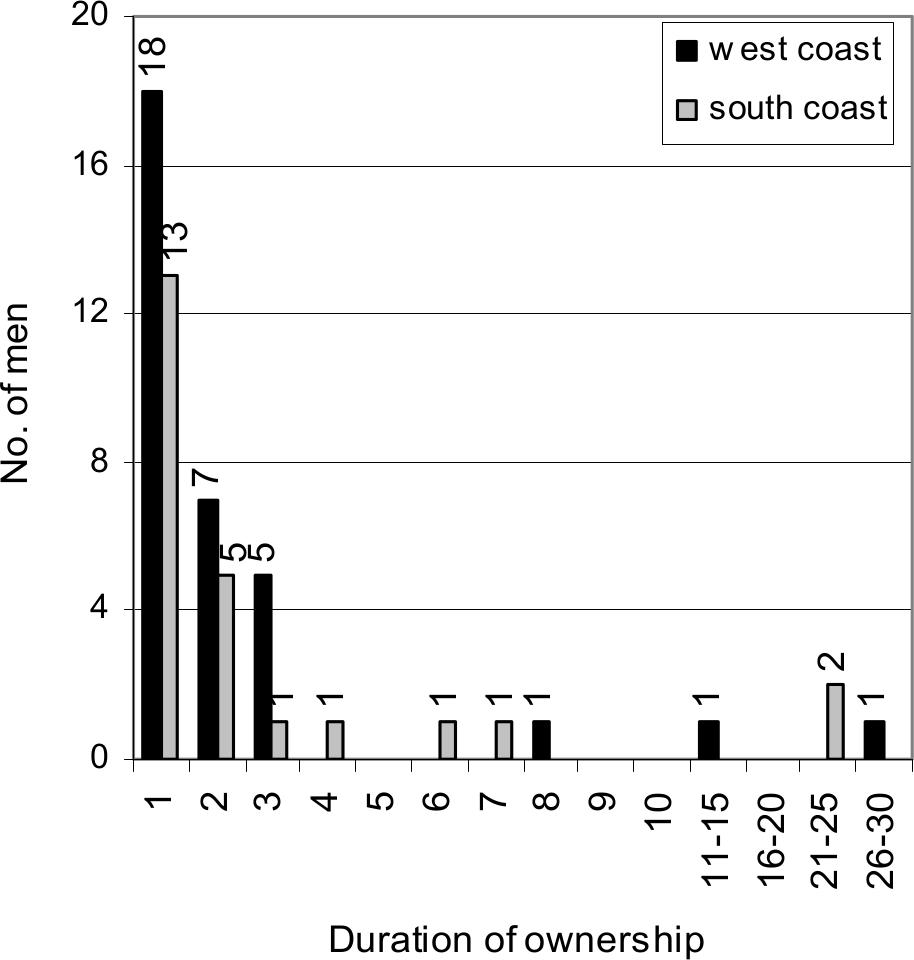
Figure 3.7 Duration of ownership of whaling parties
Although the biographical information in Erikson's (1988) dictionary has limitations in identifying the non–whaling interests of the party owners, it would appear that by far the largest and longest involved owner groups on both coasts were persons with other maritime concerns, particularly merchants and boat owners or people involved with the coastal trade. This includes at least nine of the 33 owners on the west coast and 11 of the 24 owners on the south coast. The remainder are listed as being farmers or land owners, hotel keepers, merchants without explicit maritime connections, or do not have identified occupations. As suggested by Statham (1980) for the early phase of the industry, it would appear that for the majority of the owners their involvement complemented or reinforced their other commercial interests.
The biographical analysis strongly supports the separation of activity between south and west coasts. Of the 575 entries, only three workers could be clearly identified as having moved between regions through the course of their career. Two of these (W. Parr and T. Hazelton) were headsmen, suggesting that they may have been engaged for their skills, although the other (M. Rockett) was simply a boat hand who sometimes doubled as a boat–steerer.
Ownership was also restricted between coasts, with only two cases of involvement in both regions. In 1846 Thomas Morton, a west coast resident and owner of the schooner Thetis, had his boat stationed at Torbay for the season. While he did achieve some success, he did not return to the station in the following year. An early and less certain involvement was in 1836 when David Dring, a settler in the Swan River colony, may have partially financed Cheyne's Doubtful Island Bay party. It is probable that the combination of distance between the two main settlements and a tendency to reinforce interests close at hand may have hindered a more widespread involvement.
WHALING PARTIES & STATIONS
Number and Size of Whaling Parties
Before proceeding it is necessary to explain the difference between the terms whaling party and whaling station as they are used in this volume. A whaling party refers to the group of people employed to work together as a team in both the industrial and domestic aspects of the operation of a whaling station. The whaling station was the place where the whaling party worked and lived, and included both industrial and domestic areas as well as more remote components such as look–outs. The distinction between party and station is necessary, as each whaling party could use a number of whaling stations in a single season, making the latter an unreliable measure of the extent of industrial activity. 39
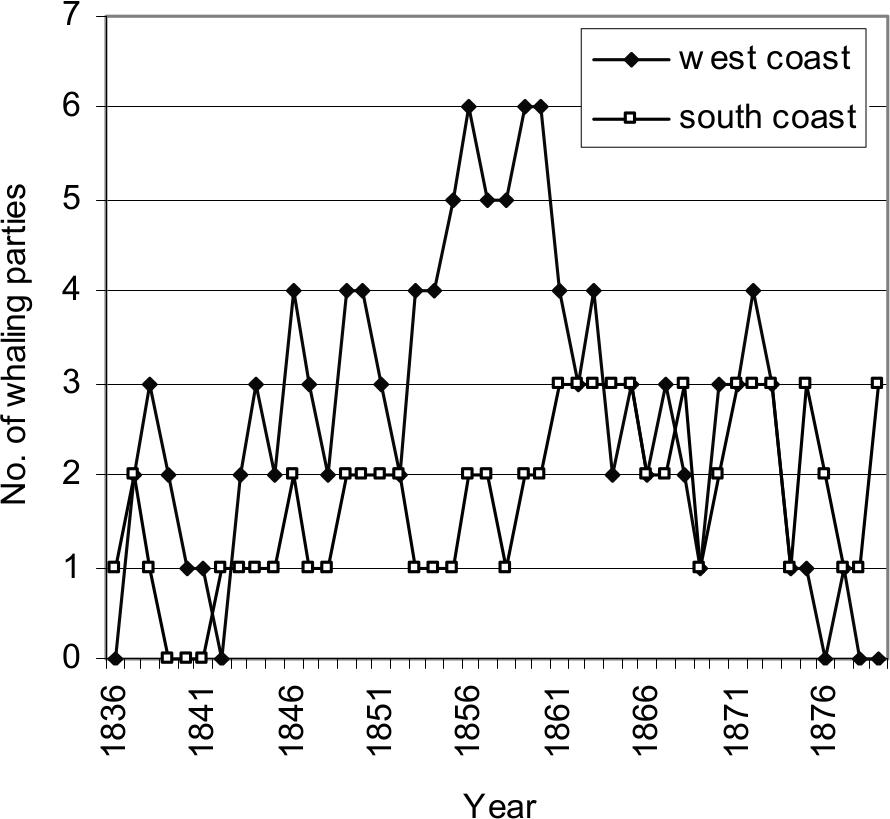
Figure 3.7 No. of shore whaling parties - south and west.
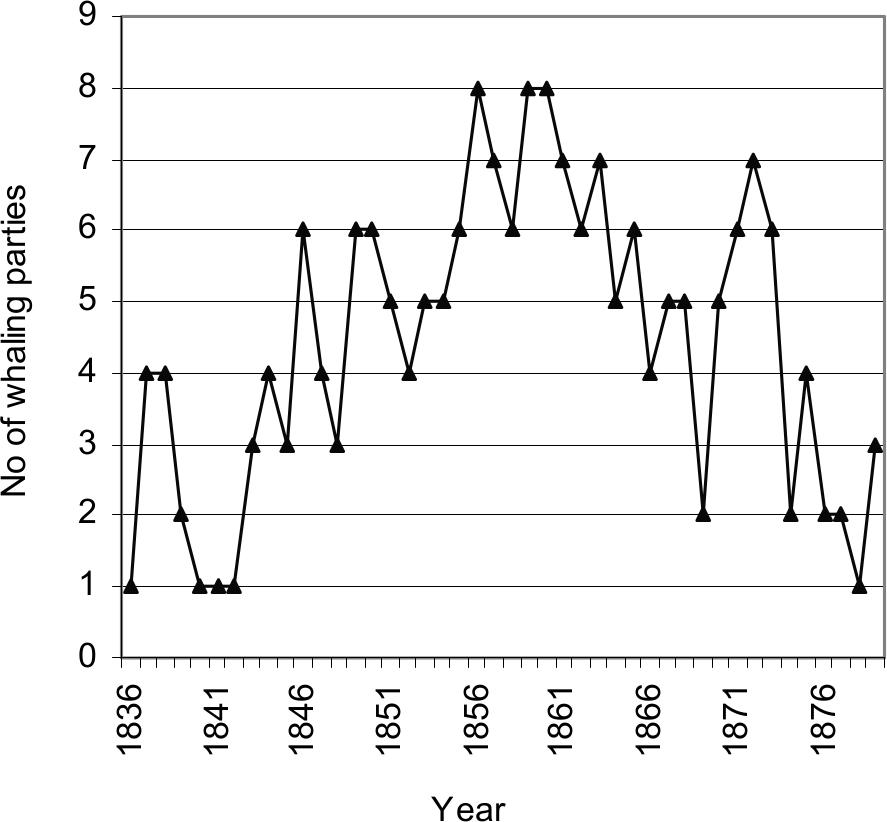
Figure 3.8 Number of shore whaling parties.
Figure 3.7 shows the number of whaling parties formed on both coasts, while 3.8 provides a total figure. The west coast peaked in activity during the mid–1850s, with five to six parties in operation at various locations each year. This was the period when Harwood and Bateman both ran two parties, one each at Fremantle and at Port Gregory. Bateman would then move his Port Gregory party down to the Bunbury station for the late season. The south coast industry reached its maximum development in the late 1850s, although only three parties ever operated in the region in any one season.
Establishing the number of whaling parties in each year is only an approximate way to determine the strength of the whaling industry. A more accurate assessment of the industrial capability can be gained through two closely related measures, the number of whaleboats which are known to have been in use, and the number of men known to have worked in the parties.
To deal with the first variable, the size of a whaling party was generally referred to in contemporary documents as being a 'two boat' or 'three boat' fishery and so on. This directly described the group's capacity to pursue whales and assist in their slaughter, and presumably suggested other capabilities or details of organization. The known number of boats at each Western Australian station, drawn from Blue Book records, newspaper reports and various other sources, is recorded in Appendix B1 and B2. This clearly shows that the west coast stations worked with an average of three boats, rising to a maximum of four. In contrast, the south coast parties consistently used two boats. In both regions there are isolated incidents of whaling parties working with one boat, including one at Toby Inlet in 1847 (Inq 25/8/1847), and one at Barker Bay in 1849 (CSR 189/249: 16/8/1849).
To give some idea of the changing strength of the total fishery, Figures 3.9 presents the minimum number of whaleboats in use on both coasts, with Figure 3.10 representing the total. It should be noted that the numbers of whaleboats recorded in the Blue Books are not always consistent with other sources. Some parties and their boats are not reported at all, while in the case of a party moving between locations such as Port Gregory and Bunbury, it is possible that the same three boats may have been recorded at both locations.
Where the actual number of boats at a station was not known, either the number of boats used at that station in immediately preceding years was carried over (if known), or the average figure of three boats for a west coast party and two boats for a south coast party was substituted. Where a party moved between locations, say from Port Gregory to Bunbury, its three boats used were recorded only once. For these reasons the graph should only be taken as an approximation and not as a strictly accurate record.
One factor which could not be represented in Figure 3.10 is the use of small vessels such as cutters and schooners to assist in the whaling process. These vessels appear to have played several different roles, the first being to transport the crews to the more distant stations, an operation which became more important with the evolution of early/late season mobility. Vessels which stayed with the station during the season could be used to move men and boats beyond the normal range of the station. Frederick Seymour's Castle Rock diary during 1848 has several entries which describe this (Seymour n.d. 15/10/1848, 14/10/1848), while in 1849 the manager of the Bathers Beach station hired the schooner Pelsart to cruise to the north of the station, equipped with two boats and a full complement of hands and gear (Inq 7/6/1849).
There is no evidence to suggest that the full processing of whales, including trying–out of oil, was carried out on these small craft. There are references to their use as ‘cutting–in vessels’ (Inq 25/5/1857, Seymour n.d. 11/10/1848), suggesting that the blubber may have been flensed at sea before returning it to shore, or that they assisted in returning the whale to the station and were moored alongside to be used as a flensing platform. 40
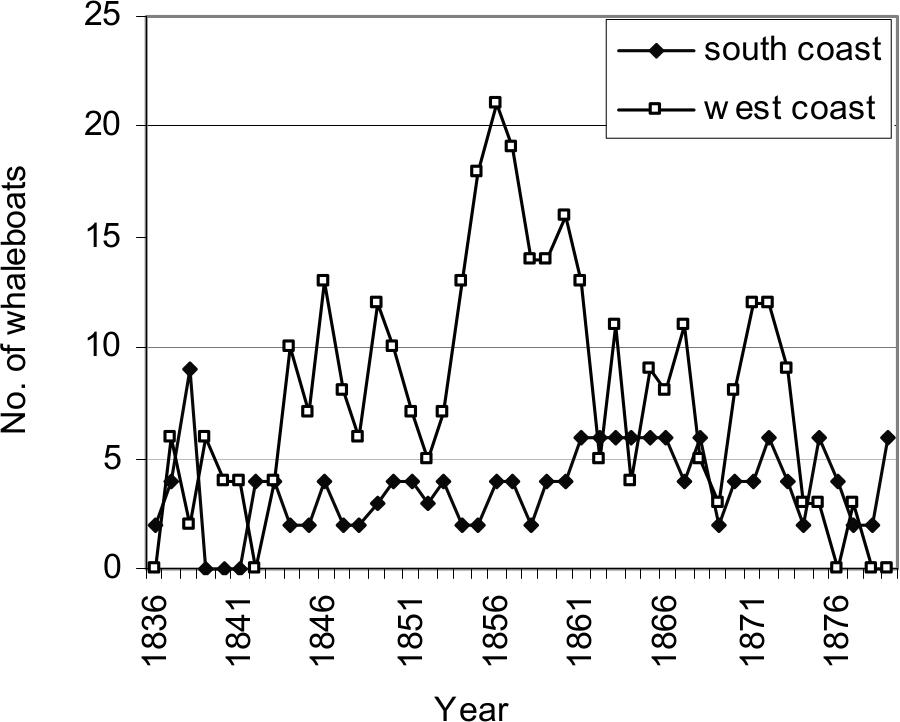
Figure 3.9 Whaleboats - south and west.
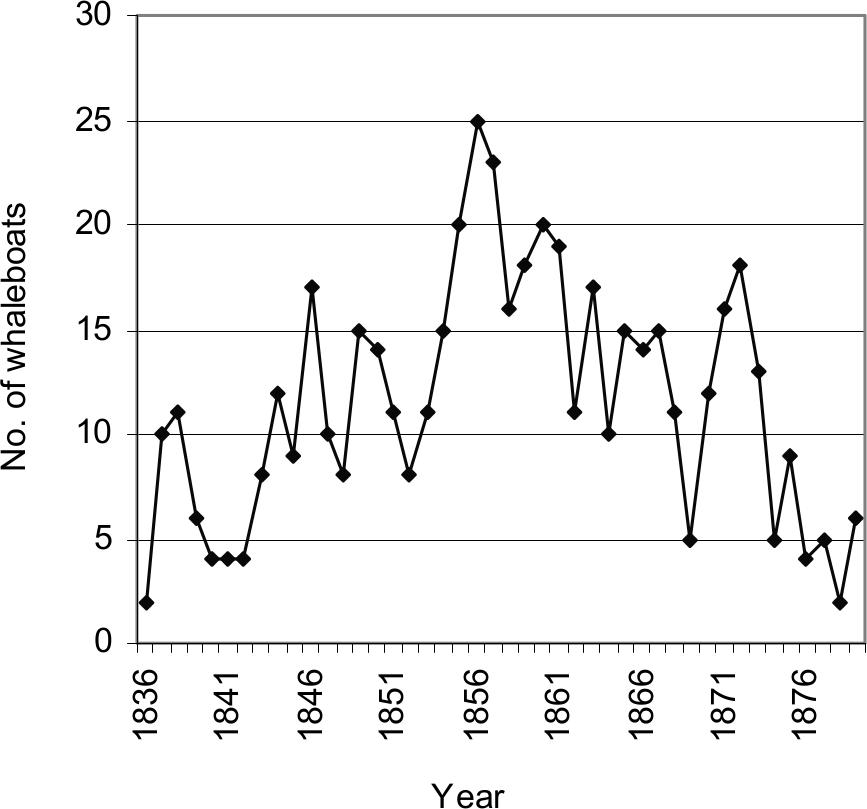
Figure 3.10 Total no. of whaleboats.
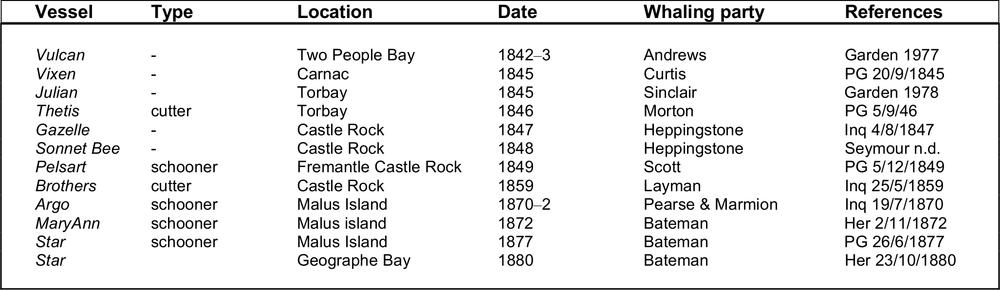
Table 3.1 Small vessels associated with shore whaling operations.
Table 3.1 lists the vessels known to have been associated with the operation of colonial shore stations. This is by no means a complete list, although in the absence of specific statements clearly associating vessels with actual whaling operations, other than in the capacity of supply ship, further details cannot be included. It can be assumed that other associations existed, particularly for parties such as those operated by John Bateman, which cruised between several stations every season. Although there are several references to small colonial vessels being built with whaling in mind (e.g. PG 10/12/1842; Garden 1978: 77; McKail 1927), it does not appear that any were built exclusively for that purpose. To remain an economic proposition, all of these craft would have been hired as coastal transport, trading or cargo vessels outside the whaling season.
It is not possible to make a direct statement about the extent to which these small vessels increased the effectiveness of a whaling party. However, their use could extend the range of a shore station well beyond its normal catchment area and increase the efficiency of the chase by taking the whaleboats out to the prey. The speed with which the animal could be returned to shore and processed also contributed to the process. While the use of cutting-in vessels appears to have been quite common, it is likely that the expense of hiring the craft and paying its crew for a whole season was beyond the reach of many shore parties.
Number of Workers
The number of men employed in a whaling party was closely related to the number of whaleboats in use at each station. Each boat required at least six men; the headsman, boat steerer and from four to six pulling hands, depending upon the size of the whaleboat (Little 1969). There might also be several other hands at the station performing duties such as cook, cooper, look–out, etc. 41
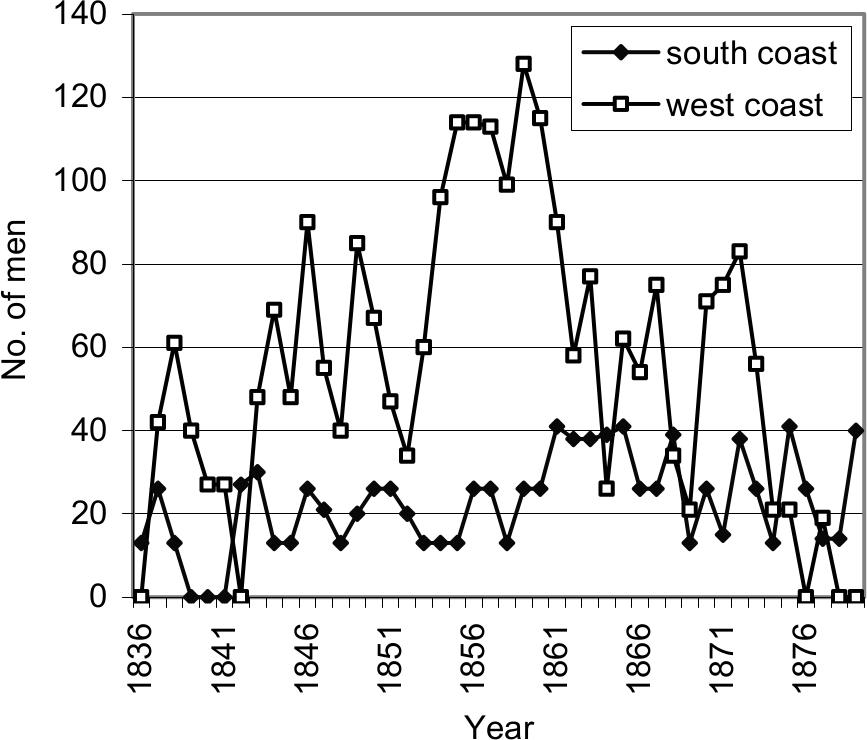
Figure 3.12 Estimated no. of whalers - south and west.
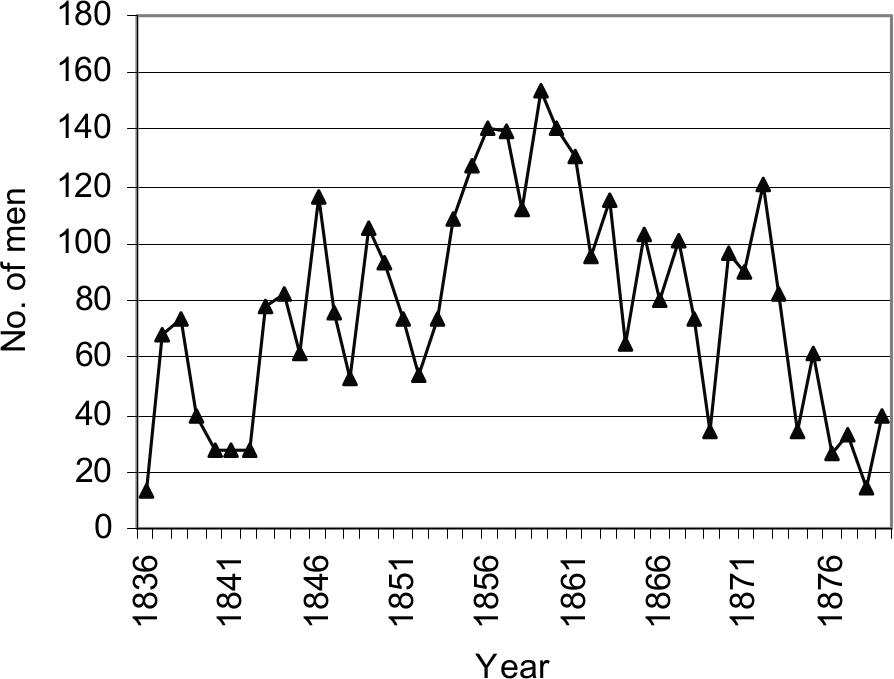
Figure 3.13 Estimated total numbers of whalers per year.
The whaling party registrations under the Statute 10th Victoria No. 16, passed in 1847, show the approximate sizes of various groups on both coasts. It is evident that the parties normally operated with a minimal number of employees. For instance, two boat fisheries, such as Castle Rock in 1851 (GG 16/9/1851) or Cheyne Beach in 1871 (GG 11/7/1871), sometimes listed only 13 men. This gave two six–man boat crews and an extra hand usually specifically registered as the cook. Even for a larger, four boat party such as at Bunbury in 1861 (GG 5/11/1861), only 27 men are listed. If we assume 24 men were required for the four boats, with one man registered as the cooper, there were only two 'extra' men, possibly cooks, look–outs or other supplementary positions.
To estimate the total number of men employed in any year, the most reliable data are figures giving the actual numbers of workers, usually through Government Gazette registrations. However, in most cases the size of the whaling party can only be derived by extrapolating from the number of boats operating. A fixed ratio of the number of men to number of boats derived from averaging the Government Gazette registrations has been used as follows: 13 men per two–boat party, 21 men per three–boat party, and 27 men per four–boat party.
The ratio of men to boats appears to have been fairly consistent through time and between coasts, with the number of men at the four–boat fisheries being the most variable. The most problematic aspect is that in many cases the number of men is extrapolated from an estimated number of whaleboats, resulting in some estimates of dubious reliability. Figures 3.12 and 3.13 are therefore illustrations to provide an approximation of the total workforce, rather than absolute or accurate counts.
Whaling Stations
Although a detailed discussion of the distribution and nature of the shore stations is presented in Chapter Four, it is appropriate to discuss briefly the number of stations in operation in various periods as an indicator of the scale of the Western Australian whaling industry.
One of the more interesting developments with implications for the archaeological record was the move towards using more than one station during each season. The relationship between the movement between regions and the seasonal migration patterns of whale species has already been proposed and will be examined in detail in the final part of this chapter.
Figure 3.14 shows the minimum number of whaling stations on both coasts with 3.15 showing the total, which can be compared to the number of whaling parties shown in Figures 3.7–3.8. I refer to this as the minimum number because there is no doubt that in the period after 1865 there was a greater number of stations in use than is plotted here. While the historical evidence suggests that most of the south coast parties split their season between two locations, there is often no firm statement as to which parties did so. Taking a conservative approach to the data, the use of multiple stations in this later period has not been assumed.
The first area for attention is the relationship between the size of the whaling parties and the size of the shore stations. The number and size of whaling parties operating on both coasts would have had a direct impact upon the physical nature of the stations. A party of four boats and 27 men would naturally require more or larger buildings to accommodate and supply the increased workforce and industrial capacity than a two–boat and 13–man fishery. This in turn should be archaeologically detectable in both the nature of the structural remains and the extent of associated deposits (see also Chapter Four).
It should also be considered that not only would the strength of the whaling parties have affected the size of the station complex, but also the capacity of existing stations may have borne upon the decision to form parties of a certain size. In addition to the capital required to make alterations to a station and lay in more equipment and supplies, an increased party would also have required a greater degree of management. Increased size might also have reduced flexibility, particularly with regard to movement between early and late season stations. 42
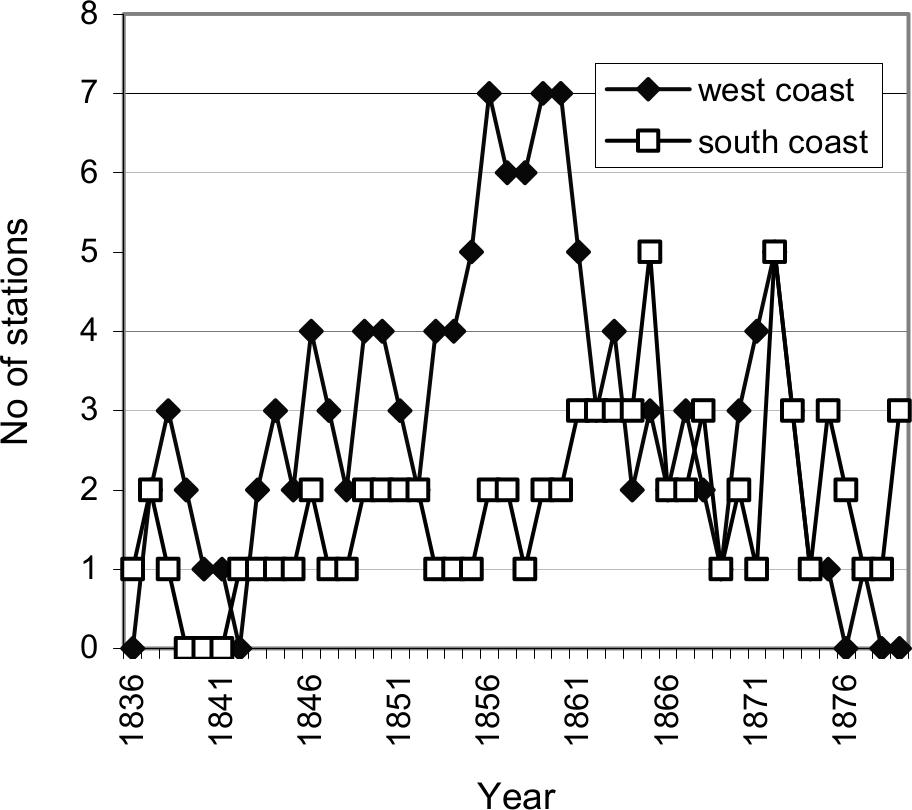
Figure 3.14 Minimum numbers of shore stations - south and west.
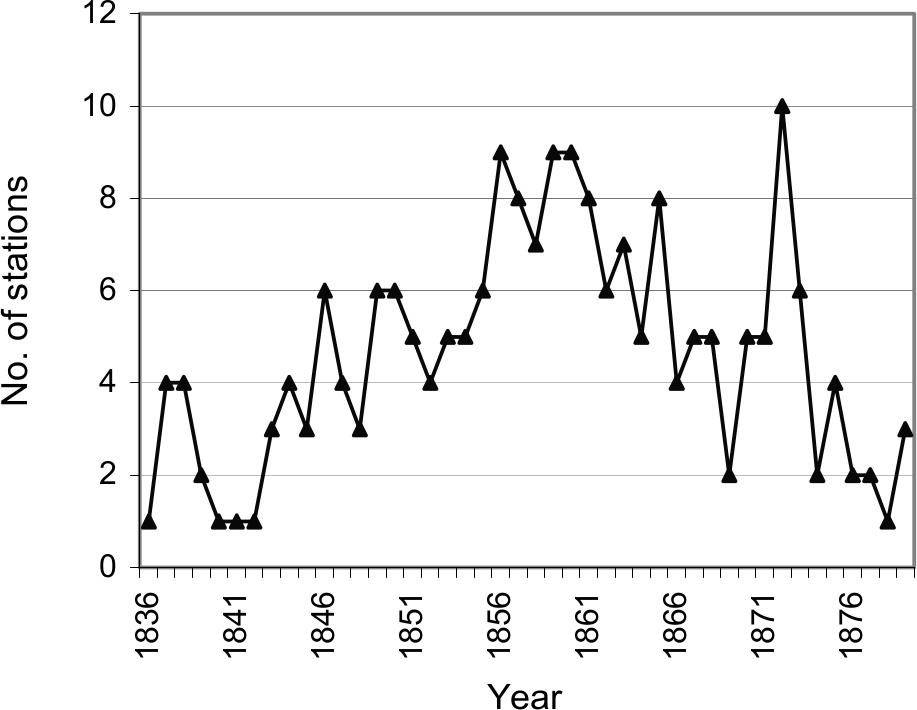
Figure 3.15 Minimum numbers of shore whaling stations.
WHALING TECHNOLOGY
The second half of this chapter focuses on aspects of the processes and production of the Western Australian shore whaling industry. The limited body of 19th–century Western Australian accounts of whale hunts and blubber processing (PG 10/6/1837; PG 29/6/1837; Landor 1847) shows no difference from international modes of commercial whaling at a general level (see Chapter One), so a separate study does not appear warranted. However, several associated areas have been investigated which relate to the success of the process. The first section discusses evidence for the diffusion of new technology into the Western Australian whaling industry, looking specifically at importation patterns and local production of whalecraft. In particular, it was thought that changes in the availability and nature of essential specialized equipment might be correlated to wider changes in the progress of the colonial industry.
Equipment supply
The common pool of specialized technology used by pelagic and shore–based whalers in 19th century has already been described in some detail by Pearson (1983) and need not be repeated here. As the concern of this current study is not with the technology of the whalecraft as such, it is only necessary to say that the historical record and existing museum collections suggest that the Western Australia whalers used the same range of items as those on the east coast.
Table 3.2 reproduces several auction catalogues from Western Australian whaling parties. The listing for the Northern Whaling Company (SRG 2/2/1837) is an almost complete assemblage of the whalecraft and supplies required by a shore fishery, although there are obvious omissions such as whaleline and extra boats. It is interesting to contrast this with the details of the items to be auctioned after the closure of the company in the following year (PG 17/2/1838). The other two lists also afford some comparison, the first being an auction advertisement from Daniel Scott of Fremantle, probably after he had decided to end his involvement with the Bathers Beach station (PG 1/3/1850). The other is a compilation of two lists of equipment received from Britain and sent northward to Henry Sanford, owner of the Port Gregory station, in 1855 (BL M385).
It is possible that the initial body of whalecraft used by the Western Australian whalers was drawn from the eastern Australian colonies, rather than through the lengthy process required to import items directly from Britain. For instance, the Northern Whaling Company called for supply tenders in February (SRG 2/2/1837, see Table 3.2) and by late May was ready for operation, an interval of only three months. Barring the unlikely scenario of an existing stockpile of whalecraft in the Western Australian colonies, this would have been sufficient time only for coastal traders to arrange importation from New South Wales or Hobart. More directly, Thomas Sherratt's Doubtful Island Bay party in 1836 was quite probably equipped through a partnership with an established Tasmanian whaler (PG 7/5/1836).
The arrival of foreign pelagic whaleships off the Western Australian coast coincided with the emergence of the shore whaling industry and immediately presented an alternative supply of whalecraft. With their vessels carrying a supply of equipment sufficient for a three or four year voyage, the masters of the whaleships were often willing to sell surplus to the colonial whalers. Even prior to the start of the 1837 season the Fremantle Whaling Company was able to purchase whalecraft from the Cambrian, one of the first American vessels to arrive off Fremantle (SRG 16/3/1837). On the south coast both of the 1837 season whaling parties at Doubtful Island Bay entered into agreements with an American vessel which amongst other forms of assistance probably provided them with some whalecraft (CSR 55/29:9/8/1837, SRG 29/6/1837). 43
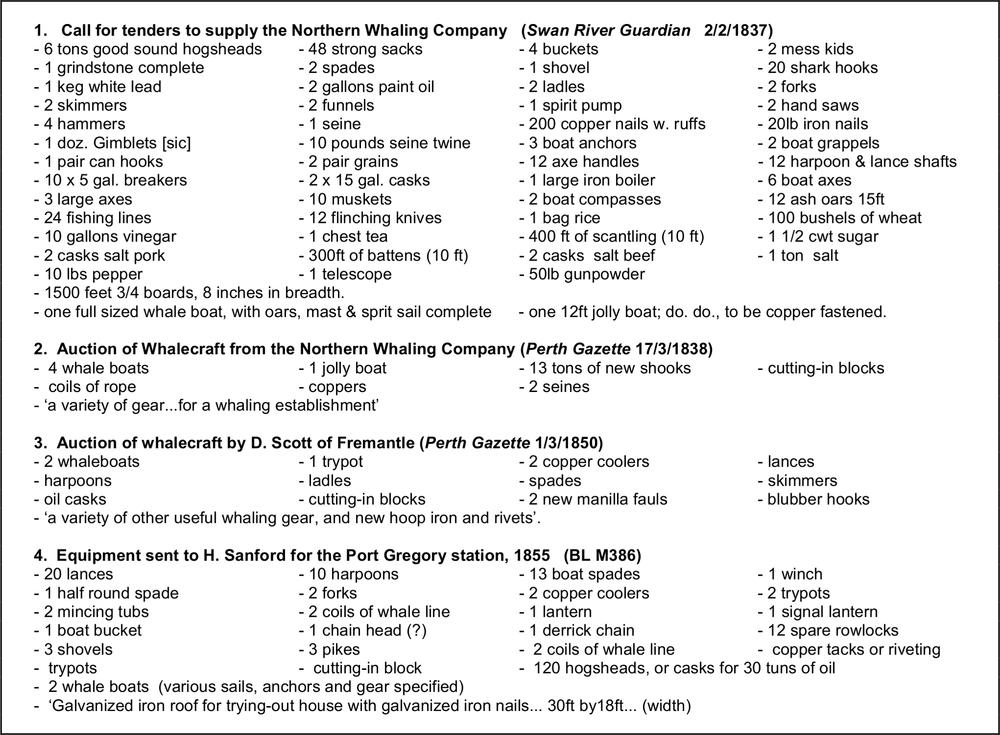
Table 3.2 Supply lists of whalecraft used at Western Australian shore whaling stations.
More importantly, as described by Pearson (1983:50) for New South Wales during the 1830s, ‘a pool of imperishable equipment, such as trypots and coolers, had been established, and the need for new or replacement items would have been quite low’. Companies would rise and fall, but their equipment could now be resold to replace the plant of existing fisheries or to outfit newly formed parties (Inq 2/12/1846; PG 1/3/1850).
Despite reuse of some items, there would still have been a continued need for supply of harpoons, whaleline, lances and other pieces of gear which were regularly lost in the chase or through wear and tear. Importation records for Western Australia during its first several decades are either sketchy or non–existent, making it impossible to identify the arrival of whalecraft. It is equally impossible to gauge the level of informal trade with American whaleships for such items (see Gibbs 2000). Whitecar's diary of the cruise of the American whaler Pacific provides important insights into this activity, including the following passage.
Whalers, unless some serious accident befalls, do not usually enter ports where their necessities can be supplied at other than exorbitant prices, except the last one, where they calculate to dispose of surplus provisions, boats and rigging, being in a hurry to get home they make some port of note so as to be detained as short a time as possible in getting rid of them (Whitecar 1860:25).
By carrying cargoes of consumer items on the outwards voyage and then disposing of their whalecraft once a full ship of oil had been obtained, the captains obviously hoped to maximize the profit from each cruise and free up valuable space for the return passage. Even a single 'dumping' event of this kind could inject into the local market a body of equipment sufficient to equip two shore stations. While the Americans were competition to be discouraged, the colonial whalers must surely have valued this ready source of equipment supply. With the colonial parties operating on such a limited scale, it is probable that it was simply not necessary to organize a more formal source of supply.
It was only during the last resurgence of colonial whaling activity during the 1870s, when the number of American vessels had been reduced to a handful, that the improved records of imports in the Blue Books show the arrival of whalecraft from Britain and the other colonies (Table 3.3). Of these, only one record of exactly what items were being imported could be found in contemporary newspaper reports. In January 1872 the Sea Ripple arrived from Mauritius with two whale boats, two 44trypots, five coils of whale line and sundry whaling gear for J. and W. Bateman (Inq 4/9/1872), most probably to supply their new station in the Dampier Archipelago. However, this large quantity of whaling equipment would have been worth considerably more than the £15 recorded in the Blue Books for that year.
| Year | Imported from | Value (£) |
|---|---|---|
| 1872 | Mauritius | 15.00 |
| 1873 | United Kingdom | 136.00 |
| United States | 53.16 | |
| 1874 | South Australia | 8.17 |
| 1875 | Victoria | 26.00 |
Table 3.3 Imports of whalecraft (Blue Books 1872–1875).
Diffusion of Technology
The second factor considered in this section is the rate at which the Western Australian whalers received and were able to put into use technological innovations which might have improved the efficiency and success of their operations. Rather than undertake an overview of the total body of whalecraft, the focus is on the introduction of a single distinctive classes of instrument, the 'harpoon gun', which represented the most significant change in technology and practice for the 19th century whalers.
Because the harpoon lay at the heart of the whaling industry, determining to a large degree the success of any attempt to fasten to a whale, it became the most consistent focus of experimentation and innovation in whalecraft during the 19th century. Most efforts were directed at the design of the head in an attempt to improve the iron's ability to remain fastened in the blubber of the whale. This included variations in the number and design of the flues and the invention of special pivoting heads (called 'toggle–irons' or 'temple–irons') which would swing open once embedded in the animal (Pearson 1983). However, all of these designs still relied upon the harpoon being propelled by hand, thus limiting range and effectiveness to the throwing power of the headsman.
The alternative presented by the harpoon gun was that it fired an iron at the target using explosive force, with the whaleline attached along a slotted shaft. There had been experiments of this type since the 1730s, but it was not until the mid–19th century that these devices became an effective alternative to traditional harpoons. Many variations appeared, including combinations of harpoon guns and bomb lances, which were intended to kill the whale with the explosive charge (Pearson 1983; Shaw 1991). Whereas variations in harpoon head design were not remarked upon, the appearance of the gun harpoon was sufficiently conspicuous and interesting to merit comment in contemporary accounts.
The first report of a harpoon gun being used by a colonial party was in November 1849, when Captain Scott of Fremantle sent a newly–received weapon to be tested by his whaling party in Geographe Bay. Although no indication is given of the type of gun, it was described as having driven a harpoon 20 fathoms (120 ft/ 36.7m) in a direct line during an experimental trial, and with such force that it bent upon hitting the object at which it was aimed (Inq 7/11/1849). No reports were received of how the instrument fared in actual use, although in 1850 a report was made that the Bunbury station was having poor success, losing at least three whales through the attempted use of a harpoon gun (Inq 6/11/1850). The editor of the Inquirer advised them to lay the instrument to one side and use their old weapons.
In 1851 the American whaler North Star put in to Busselton, where the Master, Captain Brown, sold a number of harpoon guns of his own invention to the other whaleships resorting there. The gun was described as being entirely of brass (except the lock), weighing 35 lbs (16 kg), fired from the shoulder and capable of propelling its projectile 18 fathoms (22 m). No further details are given, other than that it was of a different construction to those previously employed, and was promoted as being ‘infinitely more manageable at sea’ (Inq 5/2/1851). Brown sold £500 worth of the guns at £25 each to the other captains, including one to Robert Heppingstone, the manager of Castle Rock.
Some months later a report noted that Heppingstone's party had experienced a poor season, with the harpoon gun tried once, ‘and then unsuccessfully’ (Inq 8/10/1851). Next month another article commented that although the gun had initially failed through mismanagement, it had more recently been all that could be asked of it, with three whales being taken by this means (Inq 26/11/1851). It is possible that the Castle Rock station was still using the same gun several years later, with the station manager's diary (Seymour n.d.) recording on 30th September 1853 that they had ‘chased 2 Humpbacks and fired at them 3 times but missed’.
As it was in the interest of the American whalers to stay abreast of new and more effective means of engaging in their industry, it is probable that ships at the start of their cruise would carry the most recent innovations in whalecraft, even if only for testing purposes. If we assume the willingness of the American vessels to sell such gear to local parties, the colonial whalers could potentially receive new forms of equipment in as short a time as it took for the ship to arrive from the United States, possibly less than four months. Whether the colonials then chose to adopt the new technology or consistently use it is another matter.
Local Manufacture
The final consideration with regard to the supply of whalecraft to the Western Australian shore whalers is evidence for local manufacture. Some items, such as whaleline, harpoon guns, bomb lances and trypots were beyond the capabilities of Western Australian craftsmen. Whalers may also have preferred to purchase key equipment such as irons and lances from English or American sources as a means of ensuring quality. Even so, this still left a large body of whalecraft of a less essential nature, including flensing knives, forks, 45skimmers (etc) which could have been produced by local blacksmiths and carpenters.
The most significant item of whalecraft for which there is a body of evidence for local manufacture, even in the early period, is the whaleboat. The design and use of whaleboats have been extensively discussed by Ansel (1978) and again by Pearson (1983) for the Australian context. These small vessels needed to be fast and manoeuvrable with the general dimensions being ‘27–31 feet long (8.2m–9.4m) and about 1/5th that in width’ (Pearson 1983:42). They could be clinker (lap–strake) or carvel in construction, and while primarily intended for whaling, were also frequently fitted with mast steps to allow a simple sail arrangement to be used. Whaleboats required from five to seven oarsmen, with a further man at the long sweep oar which was used to steer the boat.
Whaleboats were acquired from American vessels or wrecks and may also have been imported from Britain (Inq 4/9/1872). However, in the 1837 season the colonial shipwrights Mews and Cox, whose workshop shared Bathers Beach with the Fremantle Whaling Company, constructed the four whaleboats used by the Northern Company. Although these originally cost £30 each, after the collapse of the company they were auctioned for £25 and £26 (PG 3/3/1838). It is probable that Mews also repaired the several boats which were damaged during the season (PG 24/6/1837; SRG 20/7/1837). There are references early to ship-building at Albany (Chester 1927; Sale 1936; Garden 1977) which suggest a similar capacity for local manufacture of whaleboats. The construction and repair of whaleboats must also have been encouraged by their use for general purposes (Inq 23/3/1842; Inq 25/5/1842; Wollaston 1991:139).
There is no evidence for local variation in design, although local timbers were certainly used. A letter from Henry Sanford at Port Gregory complains that his new whaleboat from Mews & Company had been made with banksia (possibly Banksia serrata) rather than mahogany (jarrah - Eucalyptus marginata) both of which are local timbers (BL M386). The specifications for a new whaleboat for the Fremantle Harbour Masters Department listed in Table 3.4 (GG 6/2/1855), provides insight into the style of boat seen in Western Australia.
The capability for making minor and even major repairs to whaleboats was essential for a whaling party, as being damaged or 'stove–in' by injured or angered whales appears to have been a common occurrence (e.g. Seymour n.d. 20/9/1852, 7/8/1853). A detailed record of one such incident describes a whale striking the boat several times with snout and flukes, resulting in its destruction (Inq 4/8/1847). Although parties situated close to settlements (Bathers Beach, Bunbury or Barker Bay) may have employed the skills of professional shipwrights for repairs, those at the more distant stations would have been forced to restore their damaged boats themselves. The station cooper, also often doubling as one of the boat hands, most probably stretched his skills to effect minor boat repairs when necessary, rather than lose the use of the boat for the remainder of the season. Seymour mentions various repairs, including replacing 'stove–in' boards and putting in a false keel (Seymour n.d. 21/8/1852, 28/9/1852). In slack periods the boats also underwent maintenance such as repainting, explaining the presence of the kegs of white lead paint in the Northern Company's list (Table 3.2).
| Length, over all, 28 feet. |
| 3Extreme breadth, 6 feet. |
| Depth, 2 feet 2 inches. |
| Keel, stern, sternpost and gunwales to be mahogany. |
| Planking, best yellow pine or Singapore cedar, plained on both sides, clear of all knots and rents. |
| Timbers and Floors to be notched to receive planking. |
| Thwarts to be dovetailed into rising. |
| Mast Thwart to be double–kneed. |
| Gunwales to be fitted with Iron Crutches, tack and sheet hooks and cleets. |
| Keel to be 3 inches deep clear, of garibard strikes. |
| The boat to have a good flat floor amidships with the usual spring of a whaler boat. |
| Bilge pieces filled to save the hands in hauling up and launching the boat. |
| The whole to be fastened with Wrought Copper, clenched with roves and to be covered with two coats of paint. |
Table 3.4 Tender specification for a 5 oared whaleboat for the Pilot Service (Government Gazette 9/6/1857).
The necessity and capability to repair and maintain whaleboats at whaling stations suggests the potential for such activity to be archaeologically visible. This is discussed further in Chapter Five.
PRODUCTION AND EFFICIENCY
The following section examines the efficiency of the whalers and their success in terms of the catch record and income through exports of oil and bone. Because of the limited body of historical evidence which specifically concerns the operations of shore stations in Western Australia, this section combines a detailed analysis of the catch information contained in the Seymour diary of the Castle Rock whaling station (1846 to 1853, excluding 1851) with a general appraisal of the shore industry.
The Whaling Season
The two main species pursued by the 19th century Western Australian shore whalers were the southern right whale (Eubalaena glacialis australis) and the humpback whale (Megaptera novaeangliae), although other species were also sighted and pursued (Chittleborough 1965, Bannister 1985). The modern humpback population may arrive on the southern and western Australian coasts as early as April, although the majority of the north–bound group appears in June, moving to the sub–tropical waters of the northwest coast to calve and breed (Chittleborough 1965). Around mid–August they begin the southward journey, passing closer to shore and sometimes lingering in a bay or area with their calves for up to a week (Collier 1993). Although there are a few stragglers until late 46November, the migration through Western Australian waters has largely ended by late October. The humpback population does not pass along the south coast on their southward run (Chittleborough 1965).
The extreme endangered status of the modern southern right whale populations has made them difficult to study in any detail, so at best only general statements on their modern behaviour can be made. The main group arrives on the southern and lower western Australian coast from mid–May to calve and mate, returning to sub–polar regions by mid–November (Bannister 1985; Cummings 1985). It is frequently said that right whales gained their name because they were the 'right' whale to catch, slow and easy to pursue in a whaleboat (see Table 3.15) and buoyant once killed, allowing them to be towed easily back to the ship or shore station (Baker 1990). Their oil was commonly referred to as 'black’ oil (Cummings 1985) although some writers may have used the term for any oil which was not sperm whale oil. Black oil was regarded as inferior to that from sperm whales. Both right and humpback whales are plankton feeders and their mouths contain the baleen (whalebone) plates that also contributed significantly to the value of their capture.
The operational period of the 19th century shore whaling industry, normally referred to as the 'season', was based upon the coastal migration patterns of the humpbacks and right whale populations passing through each region. By the time of the 1836 and 1837 seasons, the European settlers on both coasts had observed these patterns for over half a decade, with further refinements after several years of more systematic assessment. Writing from the Fremantle region on the west coast, Ogle (1839) reported that whales frequented the west coast from June to September. Landor (1847) stated that from about June the whales (presumably humpbacks) proceeded northwards, generally returning southwards around six weeks later. Another correspondent noted humpbacks could arrive off the Fremantle coast as early as April (PG 22/4/1837), although a decade later there are statements that the Fremantle stations did not normally capture anything before August (e.g. Inq 2/8/1848). The shore whaling season for the Fremantle area appears to have closed in mid to late October (PG 6/11/1847; PG 23/10/1859).
The dates when whales appeared on the less populated south coast are even less certain, although the Cheyne Beach station reported making catches from late June onwards (Inq 7/7/1847; Inq 27/6/1850; Inq 15/7/1857; Inq 21/6/1865). The close of the southern season appears to have been in late October or early to mid–November (Inq 3/11/1847; Inq 21/11/1849). This is consistent with modern research on whale migrations (Jenner et al. 2001).
Although the start of the season in each area presumably reflected accumulated knowledge of when whale migrations passed that particular point in the coast, Seymour's (n.d.) records show that this was by no means a finely tuned system. The records for Castle Rock, summarized in Table 3.5, show a variation of up to three months for the starting date, although the close of the season was within a range of a just over one month. Both the opening and closing of the season may well have been arbitrary points within the general time frame of the migration, with the stations managers probably hoping to catch the peak of the herd without keeping the station open longer than necessary.
| Year | Commenced | Ended | Total Days |
|---|---|---|---|
| 1846 | June 1 | Nov 22 | 175 |
| 1847 | Aug 3 | Nov 30 | 119 |
| 1848 | July 14 | Dec 3 | 142 |
| 1849 | Sept 1 | Dec 3+ | 95+ |
| 1850 | Sept 14+ | Nov 14 | 62 + |
| 1851* | July 16 | Oct 30 | 107 |
| 1852 | July 2 | Nov 6 | 127 |
| 1853 | July 26 | Nov 5 | 103 |
| (* Taken from Inquirer and Perth Gazette) | |||
| (+ Records incomplete; earliest or latest confirmed date) | |||
Table 3.5 Whaling season - Castle Rock 1846–1853
There is also the likelihood that the whaling season in each region was affected by demands on the labour force to organize or participate in other seasonal rural tasks. In particular, November saw the movement of sheep and cattle to summer pastures, which may have provided men with several months work as shepherds, but also drawn them away from the whaling parties.
Catch efficiency
An analysis of the information in Seymour's journal (Seymour n.d.) provides insights into the efficiency of the operation of the Castle Rock station over the eight year period 1846 to 1853. This can been done by comparing the rate of success in each stage of the whaling process, detailed in Tables 3.6 to 3.11, and summarized in Table 3.12. Table 3.6 summarizes of the number of days each month in which whales, excluding killer whales, were sighted from the Castle Rock station. This can be contrasted with Table 3.7, which shows the number of days in each month in which whales were actually pursued. Seymour's diary suggests that the only reasons why the crews would not pursue a whale were extremely heavy weather or gales which might swamp the boats, or because the men were already occupied in processing a whale which they had previously brought to shore.
Although it is not possible to determine exactly how many whales were pursued by the Castle Rock boats, Seymour records how many times a day the crews engaged in chase (Table 3.8). As shown in Table 3.9, a mean of only 21% of these chases resulted in a whale being struck with a harpoon. Once the whale was struck a variety of incidents could occur, including the iron 'drawing' from the blubber, or the whale turning and destroying the boat. The whale might also run so far out to sea that the men would be forced to cut the line or risk not being able to make their way back to shore (Seymour n.d. 23/10/46). Between 29% and 86% of whales struck were eventually killed (Table 3.9–3.10), averaging 60%. 47
| 1846 | 1847 | 1848 | 1849 | 1850 | 1852 | 1853 | Total | |
|---|---|---|---|---|---|---|---|---|
| June | 2 | - | - | - | - | - | - | 2 |
| July | 1 | - | 1 | - | - | 8 | - | 10 |
| Aug | 6 | 14 | 6 | 1 | - | 12 | 6 | 45 |
| Sept | 21 | 13 | 23 | 17 | 13 | 14 | 11 | 112 |
| Oct | 25 | 19 | 26 | 23 | 18 | 30 | 26 | 167 |
| Nov | 17 | 13 | 22 | 2 | 5 | 1 | 4 | 64 |
| Dec | - | - | 2 | - | - | - | - | 2 |
| Total | 72 | 59 | 80 | 43 | 36 | 65 | 47 |
Table 3.6 Castle Rock: days per month whales sighted.
| 1846 | 1847 | 1848 | 1849 | 1850 | 1852 | 1853 | Total | |
|---|---|---|---|---|---|---|---|---|
| June | 2 | - | - | - | - | - | - | 2 |
| July | 1 | - | 1 | - | - | 4 | - | 6 |
| Aug | 6 | 12 | 6 | 0 | - | 11 | 3 | 38 |
| Sept | 21 | 12 | 20 | 18 | 12 | 14 | 9 | 106 |
| Oct | 23 | 18 | 21 | 23 | 16 | 29 | 25 | 155 |
| Nov | 16 | 14 | 23 | 2 | 5 | 1 | 4 | 65 |
| Dec | - | - | 2 | - | - | - | - | 2 |
| Total | 69 | 56 | 71 | 43 | 33 | 58 | 41 |
Table 3.7 Castle Rock: days per month whales chased.
| 1846 | 1847 | 1848 | 1849 | 1850 | 1852 | 1853 | Total | |
|---|---|---|---|---|---|---|---|---|
| June | 2 | - | - | - | - | - | - | 2 |
| July | 3 | - | 1 | - | - | 6 | - | 10 |
| Aug | 6 | 17 | 7 | 0 | - | 12 | 4 | 46 |
| Sept | 28 | 20 | 27 | 32 | 18 | 23 | 13 | 161 |
| Oct | 51 | 38 | 38 | 46 | 19 | 53 | 48 | 293 |
| Nov | 27 | 33 | 43 | 5 | 8 | 1 | 3 | 120 |
| Dec | - | - | 5 | - | - | - | - | 5 |
| Total | 117 | 108 | 121 | 83 | 46 | 95 | 68 |
Table 3.8 Castle Rock: no. of whale chases per month.
| 1846 | 1847 | 1848 | 1849 | 1850 | 1852 | 1853 | Total | |
|---|---|---|---|---|---|---|---|---|
| June | 0 | - | - | - | - | - | - | 0 |
| July | 0 | - | 0 | - | - | 0 | 0 | 0 |
| Aug | 7 | 3 | 0 | 0 | - | 1 | 3 | 16 |
| Sept | 6 | 6 | 4 | 10 | 5 | 3 | 2 | 38 |
| Oct | 11 | 8 | 13 | 15 | 2 | 2 | 9 | 64 |
| Nov | 7 | 11 | 12 | - | 0 | 0 | 0 | 30 |
| Dec | - | - | 2 | - | - | - | - | 2 |
| Total | 31 | 28 | 31 | 25 | 7 | 6 | 14 |
Table 3.9 Castle Rock: no. of whales struck per month.
| 1846 | 1847 | 1848 | 1849 | 1850 | 1852 | 1853 | Total | |
|---|---|---|---|---|---|---|---|---|
| June | 0 | - | - | - | - | - | - | |
| July | 0 | - | 0 | - | - | 0 | 0 | 0 |
| Aug | 7 | 2 | 0 | 0 | - | 1 | 1 | 11 |
| Sept | 2 | 3 | 3 | 6 | 4 | 2 | 0 | 21 |
| Oct | 5 | 8 | 8 | 11 | 0 | 0 | 3 | 39 |
| Nov | 6 | 11 | 8 | - | 0 | 0 | 0 | 25 |
| Dec | - | - | 2 | - | - | - | - | 2 |
| Total | 20 | 24 | 21 | 17 | 4 | 3 | 4 |
Table 3.10 Castle Rock: no. of whales killed per month.
| 1846 | 1847 | 1848 | 1849 | 1850 | 1852 | 1853 | Total | |
|---|---|---|---|---|---|---|---|---|
| June | 0 | - | - | - | - | - | - | 0 |
| July | 0 | - | 0 | - | - | 0 | 0 | 0 |
| Aug | 9 | 2 | 0 | 0 | - | 1 | 0 | 14 |
| Sept | 2 | 2 | 3 | 4 | 3 | 1 | 0 | 16 |
| Oct | 5 | 5 | 7 | 8 | 0 | 0 | 1 | 30 |
| Nov | 4 | 7 | 7 | - | 0 | 0 | 0 | 18 |
| Dec | - | - | 0 | - | - | - | - | 0 |
| Total | 20 | 16 | 17 | 12 | 3 | 2 | 1 |
Table 3.11 Castle Rock: no. of whales brought to shore.
| 1846 | 1847 | 1848 | 1849 | 1850 | 1852 | 1853 | Total | |
|---|---|---|---|---|---|---|---|---|
| Days sighted | ||||||||
| 72 | 59 | 80 | 43 | 36 | 65 | 47 | 343 | |
| Days chased | ||||||||
| 69 | 56 | 71 | 43 | 33 | 58 | 41 | 371 | |
| Chase events | ||||||||
| 17 | 108 | 121 | 83 | 46 | 95 | 68 | 538 | |
| Whales struck | ||||||||
| 31 | 28 | 31 | 25 | 7 | 6 | 14 | 132 | |
| Whales killed | ||||||||
| 20 | 24 | 21 | 17 | 4 | 3 | 4 | 77 | |
| Whales brought in | ||||||||
| 20 | 16 | 17 | 12 | 3 | 2 | 1 | 71 | |
Table 3.12 Castle Rock: summary of operations 1846-53.
| 1846 | 1847 | 1848 | 1849 | 1850 | 1852 | 1853 | Total | |
|---|---|---|---|---|---|---|---|---|
| % chases where whales struck | ||||||||
| 24 | 26 | 26 | 30 | 15 | 6 | 20 | 21 | |
| % struck whales killed | ||||||||
| 64 | 86 | 68 | 68 | 57 | 50 | 29 | 60 | |
| % killed whales successfully brought to shore | ||||||||
| 100 | 67 | 81 | 71 | 75 | 67 | 25 | 69 | |
| % chases resulting in whales killed & brought to shore | ||||||||
| 17 | 15 | 14 | 14 | 7 | 2 | 2 | 10 | |
Table 3.13 Castle Rock: success and efficiency.
Seymour's diary suggests that once ashore, the process of cutting–in the whale and then trying-out and barrelling the oil took an average of three days. This could take longer if interrupted by whale chases, although Seymour (n.d. 16/10/1846) mentions the look–out not being kept while the process was completed. Cleaning whalebone seems to have been the least pressing task, done after the trying out was completed or at some later date (Seymour n.d. 21/8/1852).
It is interesting to note that over the eight years of records, the efficiency of the Castle Rock station actually appears to decline. Even though decreased whale sightings may partially account for diminishing performance, in general the rate of success at striking, killing and returning the whales to shore also fell. This cannot be easily explained by reference to Seymour's journal, although contemporary reports suggest some mismanagement by the crews (Inq 19/10/1853).
Species of catch and catch strategy
The species of whale involved in each chase by the Castle Rock whalers is summarized in Table 3.14, while the number killed (but not necessarily brought to shore) is presented in Table 3.15. Humpback whales dominate the sample, forming 79% of the species chased, and 77% of the total killed. Right whales form the next and considerably smaller group at 15% of the species chased and 15% of the total kill.
The location of the Castle Rock station on the lower west coast placed it within the migratory path of humpbacks and right whales. While Malus Island in the Dampier Archipelago is positioned at the northern end of the humpback migration, Castle Rock's situation at the northwest corner of Geographe Bay makes it one of the last places on the west coast passed by the whales on their 48southward journey. The opportunity to take two shots at the main body of the humpback migration provides ample explanation for Bateman's decision to open a station at each of these locations during the early 1870s (see Chapter Four and Appendix A).
Overall, the catch of humpbacks versus right whales at Castle Rock was in a ratio of 5:1. However, for both species there was a 14% success rate between chasing and killing the animals, suggesting an equal degree of ease (or difficulty) in the pursuit of each type. This is despite the differing swimming speeds (Table 3.16).
| Hback | Right | Other | UnID | Total | |
|---|---|---|---|---|---|
| 1846 | 87 | 23 | 3 | 4 | 117 |
| 1847 | 91 | 14 | 3 | 0 | 108 |
| 1848 | 103 | 12 | 6 | 0 | 121 |
| 1849 | 69 | 11 | 2 | 1 | 83 |
| 1850 | 41 | 4 | 0 | 1 | 46 |
| 1852 | 70 | 21 | 4 | 0 | 95 |
| 1853 | 45 | 13 | 3 | 7 | 68 |
| Total | 506 | 98 | 21 | 13 | 638 |
Table 3.14 Castle Rock: Species of whales in each chase.
| Hback | Right | Other | UnID | Total | |
|---|---|---|---|---|---|
| 1846 | 11 | 2 | 7 | 0 | 20 |
| 1847 | 20 | 4 | 0 | 0 | 24 |
| 1848 | 19 | 2 | 0 | 0 | 21 |
| 1849 | 16 | 1 | 0 | 0 | 17 |
| 1850 | 3 | 1 | 0 | 0 | 4 |
| 1852 | 1 | 2 | 0 | 0 | 3 |
| 1853 | 2 | 2 | 0 | 0 | 4 |
| Total | 72 | 14 | 7 | 0 | 93 |
Table 3.15 Castle Rock: Species of whales killed.
| Species | Feeding | Cruising | Fleeing |
|---|---|---|---|
| Right | 1.2–2.5 | 3–6.5 | 7–11 |
| Humpback | 1.2–2.5 | 3–9 | 15–16.5 |
| Sperm | 1.2–3.5 | 3–9 | 21–27 |
| Blue | 1.2–4 | 3–20 | 24–30 |
| Fin | 1.2–4 | 3–22 | 25–33 |
| Sei | 1.2–4 | 3–22 | 36–40 |
Table 3.16 Swimming speeds of whale species in miles per hour (after Cousteau and Paccalet 1988:126).
The next most commonly–pursued species at Castle Rock was the blue whale (Balaenoptera musculus intermedia), referred to in Seymour's (n.d.) journal as 'sulphur bottoms'. These animals also migrate north from the Antarctic and along the Western Australian coast as they head towards Indonesian waters (Cousteau and Paccalet 1988). Up to half a dozen sightings of blue whales were made from Castle Rock each year, with the main migration apparently passing between August and November like the other whales. In August of 1853 Seymour (n.d. 19/8/1853) also recorded sighting a cow and calf sulphur bottom passing by the station.
Despite chasing blue whales whenever they were within range of the station, the Castle Rock crews were usually unable to strike these animals with their harpoons. This was presumably due to the ‘famed swiftness’ of the species (Inq 24/9/1851), which was able to flee twice as quickly as humpbacks and three times as quickly as right whales (Table 3.16). There is only one report of the Castle Rock party fastening to a blue whale, although on that occasion they were forced to cut the line for unspecified reasons (Inq 24/9/1851). There are in fact only two records of Western Australian shore–whalers being able to kill blue whales, at Bunbury in November 1858 (Inq 1/12/1858), and at Fremantle in March 1859 (PG 1/4/1859). Although the Fremantle whale was lost in transit, the carcass brought in at Bunbury was reported as not yielding as much oil as an ordinary right whale, while its bone was also inferior, if better than that taken from humpbacks (Inq 1/12/1858).
There are several references by Seymour (n.d.) to sightings of 'finbacks', possibly referring to fin whales (B. physalis) or sei whales (B. borealis) (cf. Baker 1990). Both species are similar to blue whales, although shorter, with the modern populations thought to spend summer off the northwest of Western Australia and winter in the Antarctic (Cousteau and Paccalet 1988). The Castle Rock crews are recorded as unsuccessfully chasing finbacks during the 1840s, so that by the 1850s there are sightings of ‘lots of finbacks’ without any indication of pursuit (Seymour n.d. 16/9/1853). As for blue whales, it is quite possible that the swimming speed of these animals simply put them beyond the capabilities of the open–boat whalers, who could only row at about five miles per hour (Ansel 1978). There are no historical references to other Western Australian shore stations chasing finbacks.
There is a single account of the Castle rock whalers capturing sperm whales (Physeter macrocephalus), a species which normally feeds along the continental shelf and does not approach the shore. In mid–August of 1846 Seymour (n.d. 14/8/1846) recorded that ‘a score’ of sperm whales was raised in Geographe Bay, while a contemporary report states that there were over 200 seen (PG 22/8/1846). Although Seymour's diary suggests that only seven were taken by the Castle Rock crews, it is possible that as many as 25 were eventually killed by them and another nearby station (Inq 2/9/1846). A cow and calf sperm whale was also taken by the Castle Rock boats just over a decade later (Inq 30/9/1857). The only other report of a shore station killing a sperm whale was in 1846, when the Torbay crews, with assistance from a small vessel, took a single animal (PG 3/10/1846).
Although the Castle Rock crews did not hunt killer whales (Orcinus orca) for oil, Seymour's diary suggests that a pod of these animals became associated with the station over a period of years. In the first year of the station's operation in 1846, killer whales were sighted cruising around Castle Rock on the 24th of July. In subsequent years they would continue to appear within a week or so of this date, with Seymour especially noting their arrival in his journal (Seymour n.d. 17/7/1848).
Unlike the co–operative arrangement at Twofold Bay in New South Wales where killer whales herded whales toward the whaleboats (Mead 1961), the relationship between the Castle Rock whalers and the killer whales 49was competitive. On several occasions the whalers salvaged humpbacks slain by the killers (Seymour n.d. 13/11/1846, 10/10/1848) and chased others which ‘the kilers ad [sic] been at’ (Seymour n.d. 2/11/1852). On at least one occasion the killers took advantage of the whaler's work, attacking a carcass being towed behind a whaleboat and dragging both beneath the surface (Inq 24/9/1851).
There are no explicit references in Seymour's journals to the catch strategies employed by the shore whalers. However, one clue is provided by Whitecar's observations of the fisheries at Castle Rock and Bunbury during the mid–1850s.
If a whale is attended by a calf, they always fasten to the latter first, knowing that the mother, in her solicitude for her offspring, is very careful not to use her tremendous flukes; or if a humpback, her sweeping fins: but woe betide the boat, unless an experienced boat–header directs it, that is in the vicinity when she discovers that her calf is dead (Whitecar 1860:91).
The consistent capture of cow and calf pairs is borne out by Seymour's records. Over the seven years covered by the diary, 18 cow and calf pairs of humpbacks (36 individuals) were killed, representing 50% of the total humpback catch, or 39% of all whales taken by the station in that period. A high proportion of the remaining catch also represents cows or calves which were taken while the other half of the pair escaped. No cow and calf pairs of right whales are recorded as being taken at Castle Rock, although there is little doubt that the whalers would have used similar tactics. The capture of cow and calf pairs was obviously a successful strategy at Castle Rock, and it is highly probable that it was also used at the r shore stations. For example, in a single fortnight during September 1837 the Bathers Beach station was reported as catching four whales and their calves (PG 19/81837).
While there are insufficient historical data to undertake a comprehensive analysis of whale catch for all of the stations throughout Western Australia, an attempt was made to determine whether the trends detected in Seymour's records were exhibited by the whole of the colonial industry. Two contemporary newspapers and the Blue Book reports were analysed to extract information on the species of individual catches.
The reports on the success (and failures) of local fisheries which were published in the Inquirer and Perth Gazette newspapers were irregular and variable in quality over time, particularly with regard to the south coast. The extent of coverage appears to have been dependent upon the current perception of the significance or potential of the whaling industry, with interest waning rapidly after the mid–1860s. Prior to the mid–1840s the newspaper reports rarely provided information on which species were being captured. The analysis of the two newspapers is presented in Figures 3.15 and 3.16. The Blue Book listings are also variable and infrequently mention the number of individuals of each species taken (Figure 3.17).
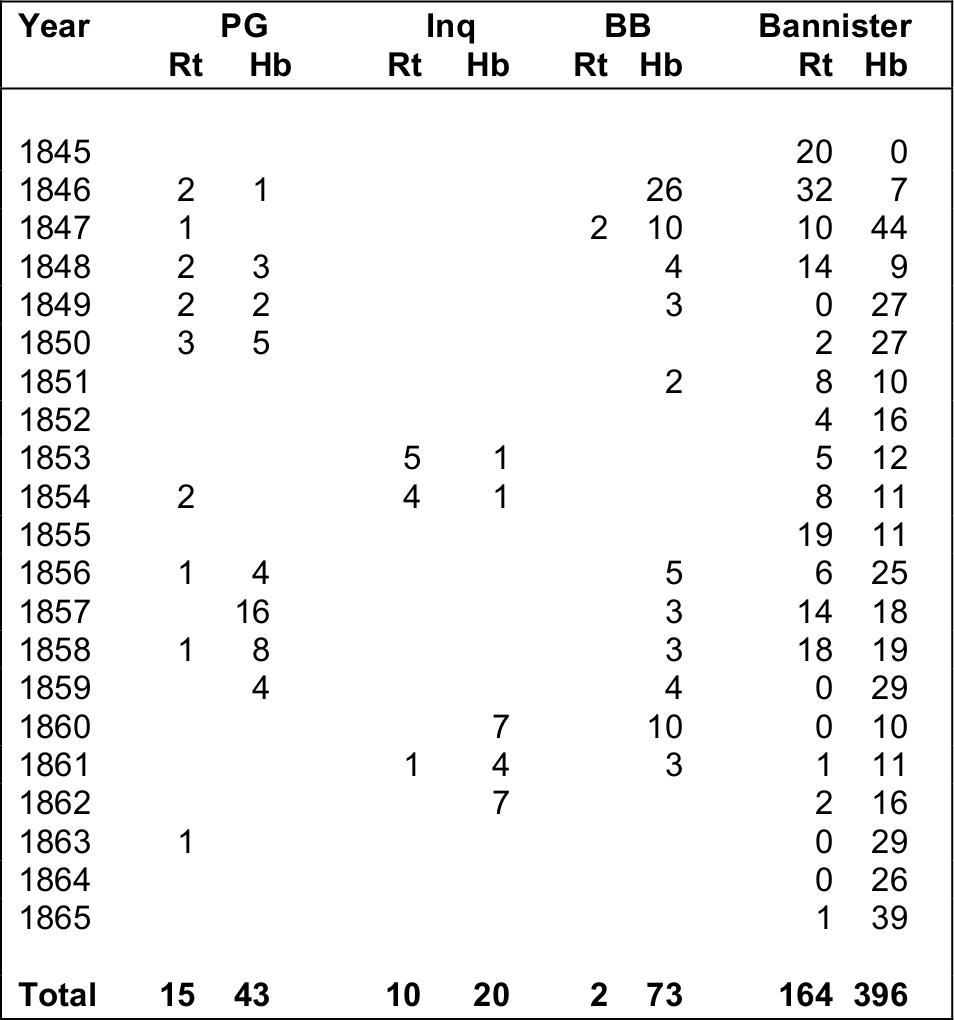
Table 3.17 Comparison of reports from different sources of right and humpback whales caught 1845–65.
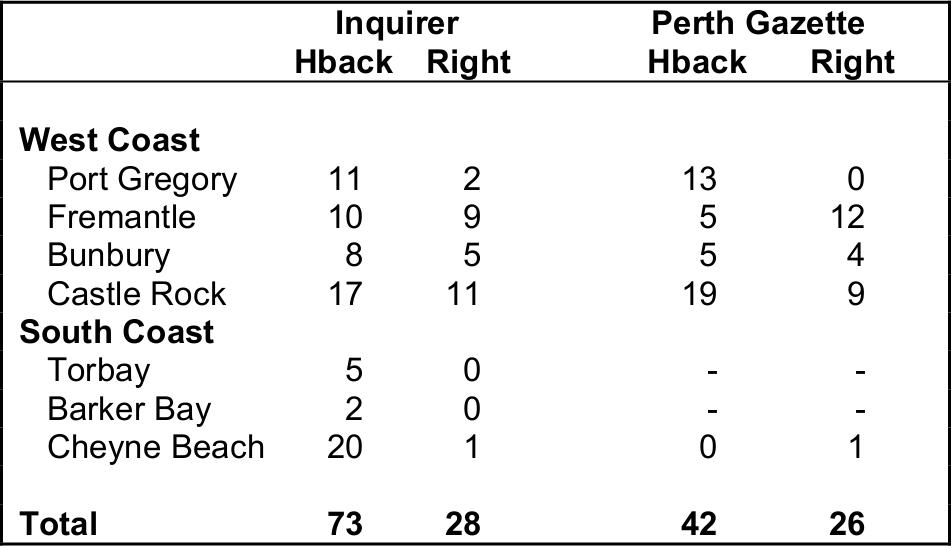
Table 3.18 Distribution of whale species caught 1836–79.
Comparison of the results from the three sources shows some differences (also see Appendix B8), although in general they all demonstrate that a greater number of humpback whales was being returned, especially in later years. Although the Perth Gazette accused the Inquirer of deliberately ‘puffing’ catch reports in an attempt to raise public and foreign confidence (PG 19/12/1846), there appears to be little reason why either source might try to misrepresent the species returned. However, it is possible that the reported right whale count may well have been skewed upwards as a result of its less frequent capture and greater (and slightly higher quality) oil return making them more newsworthy. Because of the incompleteness of the data and the sampling biases involved, these graphs are only indicative of the catch record. It was not possible to confirm the 5:1 humpback to right whale catch ratio suggested by Seymour's diary, and despite there being a number of cow–calf pairs reported, there were insufficient data to lend firm support to the catch strategy suggested by the Castle Rock material. 50
An indication of the 19th century distribution of right and humpback whales catches by foreign whalers is seen in Townsend's (1935) analysis of catches by American whaleships (see Wace and Lovett 1973:13). The American catch of humpback whales was focused on the northwest coast of Western Australia, around the area of the Dampier Archipelago, between July and September. In contrast, right whales were taken from the south and extreme lower west coast of Western Australia between September and January. However, the lack of humpbacks shown as taken in the southwest, despite known catches by Americans (Whitecar 1860:219), would suggest that these charts are only plotting major trends in the record.
Although no attempt has been made in this current study to calculate the number of individual whales killed, Bannister (1986) previously estimated a total of at least 266 right and 591 humpback whales taken by the Western Australian shore–whalers for the period 1836 to 1878. This includes an upper estimate of 311 right whales if no humpbacks were taken prior to 1846. There are, however, a number of difficulties with these figures and the way they were obtained.
| Year | Right | Hback | Year | Right | Hback |
|---|---|---|---|---|---|
| 1836 | 3 | - | 1858 | 18 | 19 |
| 1837 | 23 | 36 | 1859 | 0 | 29 |
| 1838 | 24 | - | 1860 | 0 | 10 |
| 1839 | 0 | 9 | 1861 | 1 | 11 |
| 1840 | 0 | - | 1862 | 2 | 16 |
| 1841-42 | 26 | - | 1863 | 0 | 29 |
| 1843 | 3 | - | 1864 | 0 | 26 |
| 1844 | 16 | - | 1865 | 1 | 39 |
| 1845 | 20 | - | 1866 | 7 | 13 |
| 1846 | 32 | 7 | 1867 | 0 | 7 |
| 1847 | 10 | 44 | 1868 | 0 | 10 |
| 1848 | 14 | 9 | 1869 | 0 | 5 |
| 1849 | 0 | 27 | 1870 | 0 | 27 |
| 1850 | 2 | 27 | 1871 | 0 | 30 |
| 1851 | 8 | 10 | 1872 | 0 | 22 |
| 1852 | 4 | 16 | 1873 | 0 | 15 |
| 1853 | 5 | 12 | 1874 | 0 | 3 |
| 1854 | 8 | 11 | 1875 | 0 | 11 |
| 1855 | 19 | 11 | 1876 | 0 | 4 |
| 1856 | 6 | 25 | 1877 | 0 | 3 |
| 1857 | 14 | 18 | 1878 | 0 | 0 |
| Total | 266 | 591 |
Table 3.18 Estimated catch of individual right and humpback whales by Western Australian shore–whalers 1836-1878 (after Bannister 1986).
Bannister's (1986) calculations are mainly based on Blue Book records, which report oil and bone returns for each region and sometimes for individual stations, but only infrequently provide information on species (see Chapter One). His methodology can be divided into two parts, the first being the use of a ratio of whalebone to oil to ascertain which species was being taken at each station (when this is not stated in the original report). By taking several instances where the bone and oil returns for a known number of individuals of a particular species are provided, Bannister determined that if the reported ratio of oil to bone is greater than 25:1, the animals which had been taken were most likely humpbacks, while a ratio of less than 25:1 indicates right whales. Morton's (1982:53) research on New Zealand's shore–whalers produced a figure of approximately 100 tons of oil to 5 tons of bone (20:1) for right whales, which validates at least this part of Bannister's methodology, although Morton does not indicate a comparable ratio for humpbacks.
Once the whale species had been established, the second part of Bannister's methodology was to determine the number of individuals from the reported oil return by an using an average of 5 tuns of oil per right whale, based on only three instances in historical (presumably Blue Book) records. He acknowledges that this is low in comparison with other areas and may be as much as two tuns lower than the average figure obtained using a much wider range of reports (see Table 3.18). Bannister is not specific as to what figure he used for humpback whales.
The major difficulty with Bannister's calculations is his apparent assumption that individual whaling stations only caught humpbacks or right whales. Newspaper accounts and other records such as Seymour’s diary clearly show a combination of both species being taken, with occasional contributions from other species. Not surprisingly there are discrepancies between his figures and those suggested by contemporary sources (see Figure 3.18). One example is in 1846, where Bannister estimates 32 right whales and seven humpbacks taken, while figures obtained from newspaper reports suggest at least 36 humpbacks and only two right whales.
The general pattern of the figures presented in Table 3.18 is, however, consistent with the trends suggested by contemporary accounts and reports (Figures 3.15 and 3.16). In particular, Table 3.18 suggests that after the late 1840s the number of right whales being taken by the shore whalers decreased sharply, with the catch being increasingly dominated by humpbacks. Bannister's (1986) figures and these other sources raise the possibility that in the early period the shore–whalers may well have expressed a catch preference for right whales, extending to humpbacks only as the more favoured resource diminished.
Bannister (1986) attributes the reduction in right whales to the activities of American whaleships during the pre–1850s period. This is also the conclusion reached through the analysis of whaleship activity along the Western Australian coast (Gibbs 2000), summarized in Figure 2.3. Foreign whaling peaked in the early 1840s, probably decreasing thereafter as the right whale population was fished out. This left the colonials with the harder to catch, lower yielding and consequently less valuable humpbacks. The resurgence of American activity in the mid 1850s (Figure 2.3) may well have prevented any slight recovery in the right whale population which could have been exploited by the colonial whalers. Combined with the hypothesized colonial strategy of targeting the breeding stocks, it is not surprising that the right whale population was almost reduced to extinction. 51
Oil Yield
The return of oil from the various shore stations, and its value on the export market, are the main measures of the success of the Western Australian shore whaling industry. Once again I will examine the changing production at individual stations before turning to an analysis of the industry as a whole. While the records of oil production and value are incomplete, it is possible to trace the progress of the Castle Rock and Cheyne Beach parties through the period 1846 to 1866. Castle Rock was a three–boat west coast fishery, while Cheyne Beach was a two–boat south coast fishery. The standard unit for measuring oil was the tun,, equal to 252 gallons (1146 litres), or seven barrels of 36 gallons each.
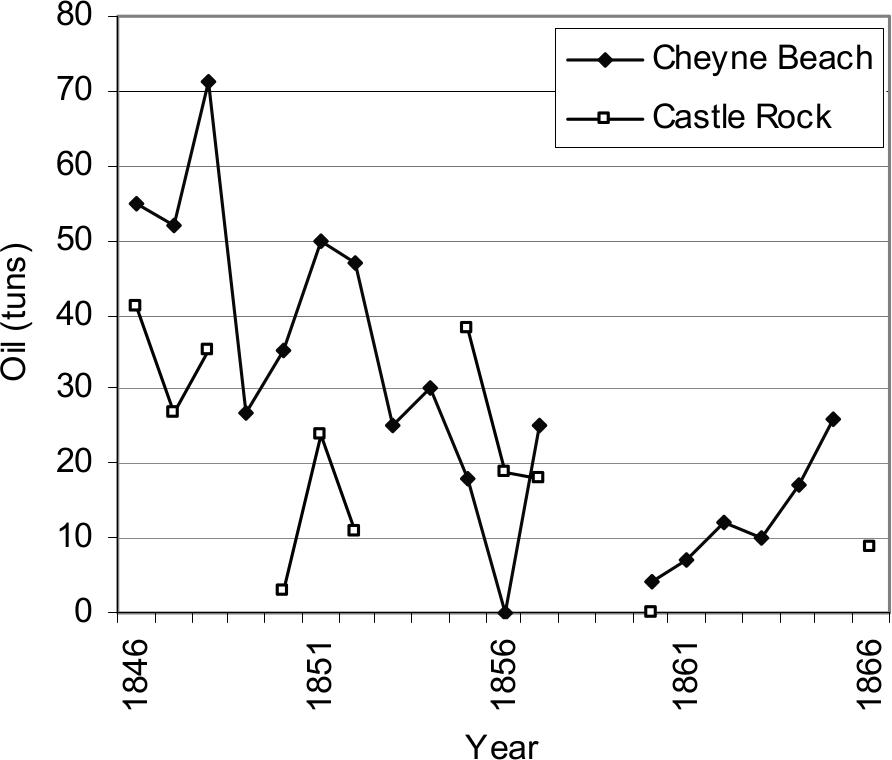
Figure 3.19 Reported yield of whale oil (tuns) from Cheyne Beach and Castle Rock stations 1846–1866.
While it might be expected that increasing skill and experience would result in increased production, Figure 3.19 shows that the returns of oil from Castle Rock and Cheyne Beach gradually declined over time. From peak yields of 41 tuns and 71 tuns respectively in the late 1840s, by the early 1860s both parties appear to have been reduced to annual returns of consistently less than 15 tuns (also see Appendix B7).
| Source | Humpback (tuns) | Right (tuns) |
|---|---|---|
| Perth Gazette | 2.9 | 6.2 |
| Inquirer | 3.2 | 6.8 |
| Blue Books | 3.5 | 5.4 |
Table 3.19 Average reported oil yield for individual right and humpback whales in Western Australia.
Analysis of reported oil yields from individual whales caught throughout Western Australia, taken from newspaper and Blue Book accounts shows that while right whales were frequently reported as producing eight tuns of oil or more (up to a maximum of 12 tuns), humpbacks did not usually produce more than four tuns. The mean yield by individuals which is presented in Table 3.19 represents a combination of bulls, cows and calves, and should not be confused with an average yield from an adult of either species. There are, unfortunately, insufficient data to see if the mean yields for humpbacks and right whales change over time. The most important result from this is that all three sources show that on average a right whale produced double the oil as from a humpback. With the decreasing right whale population the shore parties would have had to catch more humpbacks to produce the same quantity of oil.
It is interesting to note that even though Cheyne Beach was the smaller of the two fisheries, it achieved a better result. While this may be the product of greater efficiency or skill on the part of the whaling party, it may also reflect some as–yet unidentified natural factor associated with the migratory patterns and availability of whales, or some other environmental difference within each region.
The value of the oil taken by the two parties is harder to trace, although some figures are available. It can be seen in Figure 3.20 that the value of the season's catch frequently fell below £500, not to mention the several seasons where there was no return at all. Considering that it was necessary to pay the 13 to 21 crewmen, boat steerers and headsmen their proportional lays, as well as meet operating costs and equipment expenses for the station, the shore fisheries clearly operated on the extreme margin. Using the pay scales discussed earlier, the shore whaling industry appears to have been remarkably unprofitable for either workers or owners. After four to six months of what must have been extraordinarily hard labour, a boat hand may well have been left with far less than £10 for his efforts. This naturally raises the question of how or why the industry was able to continue at this level.
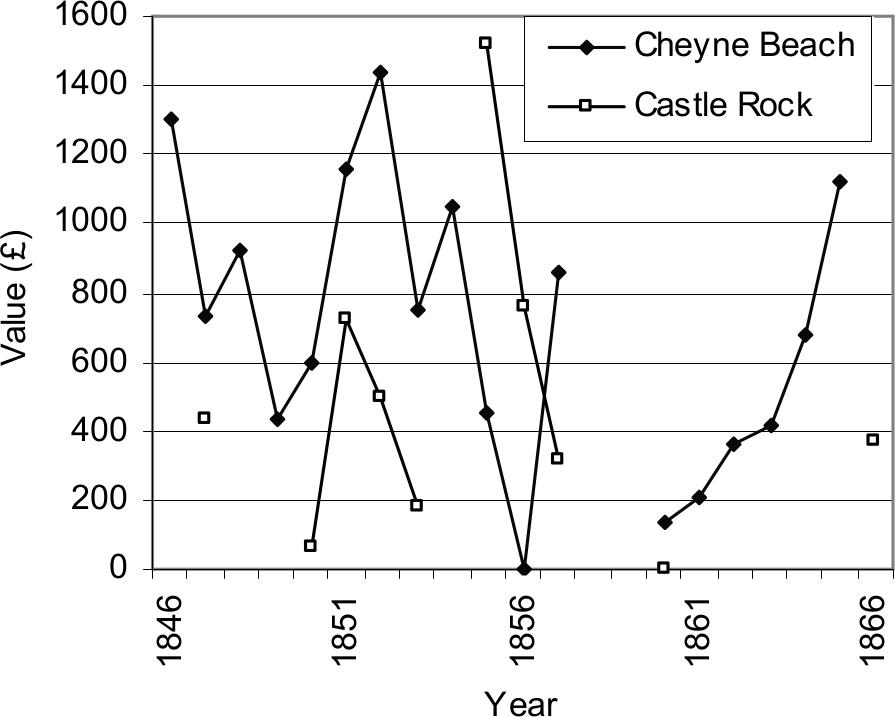
Figure 3.20 Reported values of whale products from Cheyne Beach and Castle Rock, 1846–1866.
For the whaling industry as a whole the Blue Books provide the only consistent reports of oil yields, although 52the accuracy of these reports can be questioned for a variety of reasons. Statham (1980) points out that irregular communications sometimes prevented outer ports from submitting their statistical reports by the due date, with the information either being omitted or simply added to the following year without explanation. The 1844 peak of £5314 for bone and oil, after the 1843 value of £450, is pointed out as being one such example.
Figure 3.21 shows the reported production of oil by the Western Australian shore whaling stations on the south and west coasts, while Figure 3.22 provides the total for the colony. Many of the fluctuations shown have already been discussed in Chapter Two and need not be repeated here, although once again there is clearly a general decline in the output from the fishery.
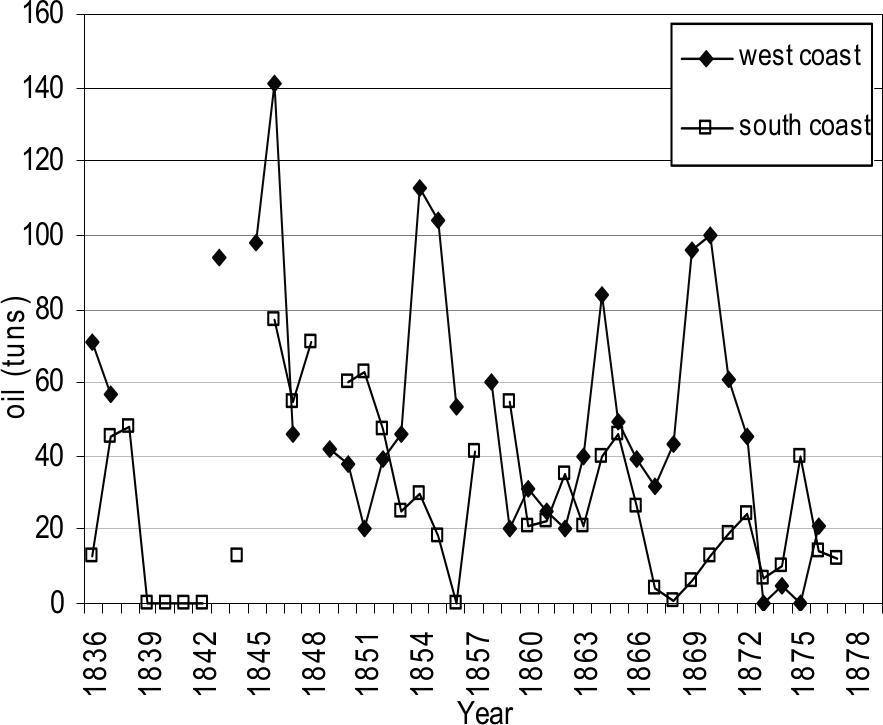
Figure 3.21 Reported oil productions – west and south.
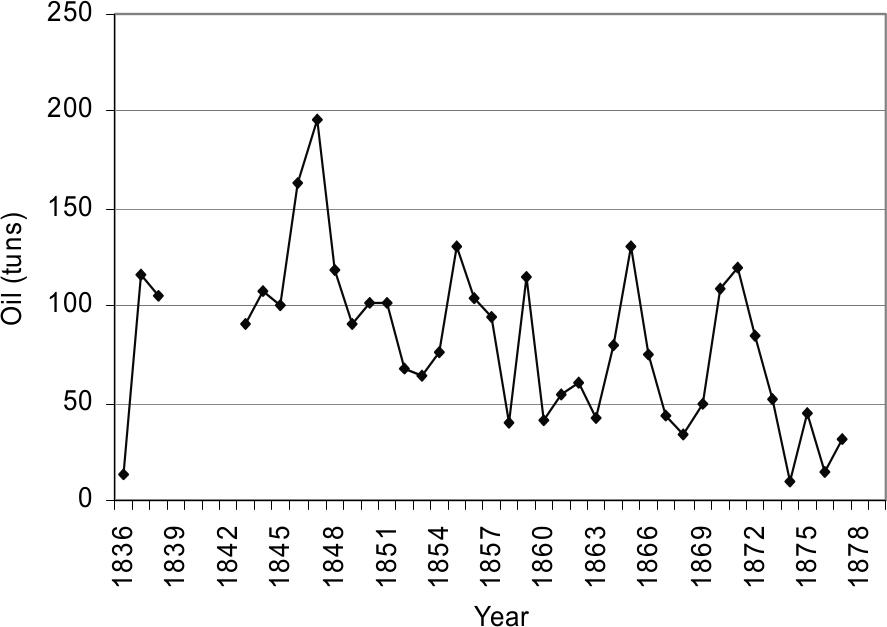
Figure 3.22 Reported total production of whale oil.
In addition to deliberate or inadvertent misreporting, the declared quantities and values might vary from the actual catch, particularly if oil had been directly sold to American or other vessels. An example is in 1851, when the early capture of eight right whales at Castle Rock raised hopes of increasing the circulation of capital into the Vasse district ‘if the oil has not already been parted to some of the American Whalers, whose notions [trade goods] may have proved too great an attraction’ (PG 10/10/1851).
The average return of oil per whaleboat, seen as the basic industrial unit of the fishery, has been shown in Figure 3.23 as a means of examining the productivity of the Western Australian whalers over time (also see Appendix B2). Higher returns per boat were achieved in the pre–1850s period, possibly because of the greater availability of whales and the higher yields from the right whales. Although the number of whaleboats in operation continued to increase during the 1850s (See Figure 3.10), the output per unit declined. This may have been the result of either the heavy fishing during the 1840s leading to a decline in the available whale stocks, or the increased number of colonial parties (and whaleboats) competing for a finite resource.
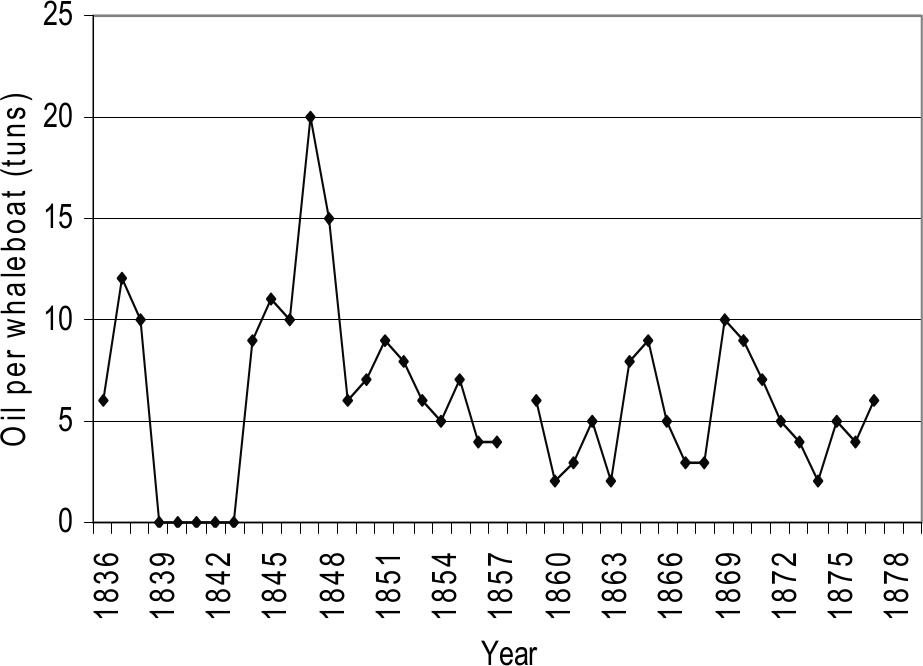
Figure 3.23 Mean volume of whale oil per whaleboat.
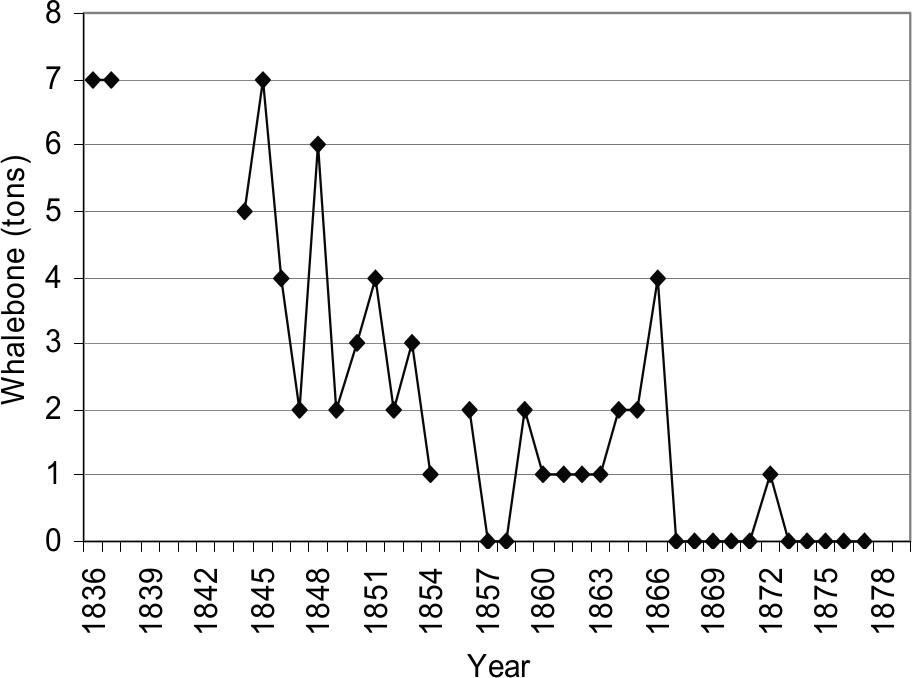
Figure 3.24 Reported total yield of whalebone.
Comparing Figures 3.8, 3.10 and 3.23 it is also worth noting that despite the decreased returns per boat during the period 1853 to 1863, the number of whaling parties and whaleboats remained high. The major internal economic development in Western Australia at this time was the introduction of convicts, which raises the possibility that the market had suddenly become flooded with cheap free (non–convict) labour. As the introduction of convicts appears to have been primarily aimed at 53breaking the high wages demanded by free workers (Statham 1981b), it is possible (although there is no direct evidence) that the whaling party owners such as Bateman and Harwood took the opportunity to reduce the lays, or redirect capital to expand their operations.
The slightly improved performance after 1863 may indicate a recovery due to the reduced activity of American vessels, or may be a product of the falling numbers of whaling parties and whaleboats competing for the resource. Other speculations include the possibility that later improvements may have been the result of the introduction of new technology, greater stability of the workforce, or other factors which are not readily identifiable.
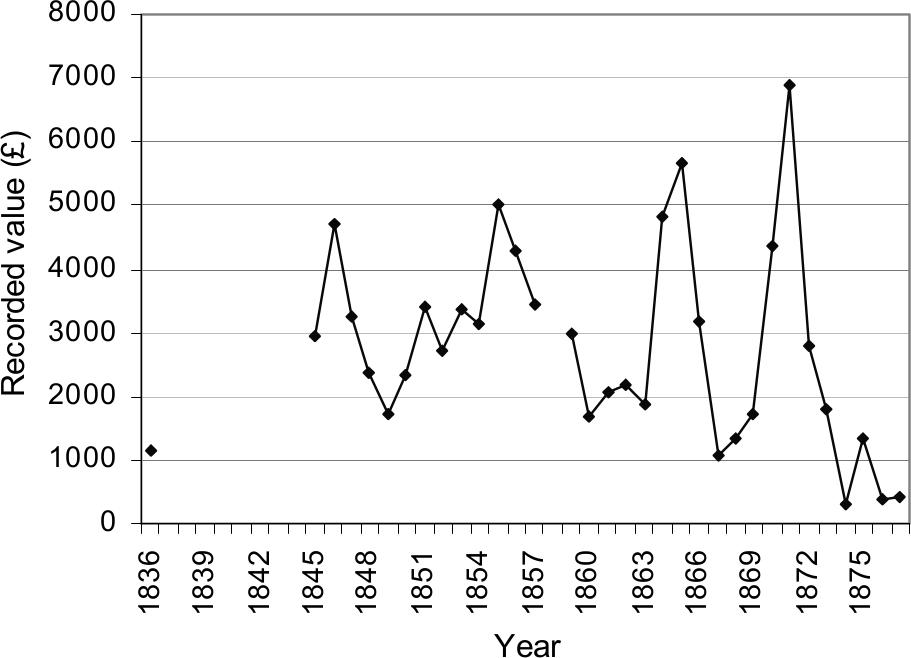
Figure 3.25 Reported value of oil and bone (Blue Books).
Although the annual return of whalebone, shown in Figure 3.24, exhibits the same pattern of decline as for whale oil, there is not the close relationship between the two measures which might be expected from following Bannister's (1986) ratios. As both humpback and right whales are baleen whales, any catch should have yielded some bone. However, despite oil returns exceeding 100 tuns in 1870 and 1871 (Figure 3.22), no bone is recorded in the Blue Book records. These and earlier omissions may simply indicate poor reporting on either the part of the whaling parties, or the compilers of the Blue Books. Some other mechanism may be at work, but this could not be determined through the available documentary record.
Figure 3.25 provides the gross annual value of oil and whalebone as reported by the Blue Books (see also Appendix B4). These figures were presumably calculated on the basis of the reported return by each fishery, and should not to be confused with the export returns. Returns from exports of oil and whalebone have previously been discussed (Figure 2.1), as has the diminishing contribution of whale products to the total colonial export income (Figure 2.2). Another component which bears on these latter two measures is the extent of local consumption of the whale oil which was produced. As there are no figures which describe this, an approximation can be gained by calculating the difference between the quantities reported as taken and the quantities reported as exported (Table 3.20).
Taken as a whole, during the period 1846–1877 over a third (34.7%) of the oil produced in Western Australia appears to have entered the local market. The only minor anomaly is in the first 5 year block, when 25 tuns more oil was exported during 1845–49 than recorded as produced in that period, indicating either a slight discrepancy in reporting, or supply from stockpiles. Consumption in different periods was presumably related to the growth in population, with the early (pre–1850) period having only a small European community with limited oil needs.
| 5 Year blocks | Catch (tuns) | Export (tuns) | Difference (local use?) | % Diff. |
|---|---|---|---|---|
| 1846–49 | 667 | 692 | -25 | -3.7 |
| 1851–54 | 309 | 150 | 159 | 51.4 |
| 1855–59 | 484 | 319 | 165 | 34.0 |
| 1860–64 | 277 | 121 | 156 | 56.3 |
| 865–69 | 332 | 156 | 176 | 53.0 |
| 1870–74 | 379 | 156 | 218 | 57.0 |
| 1875–77 | 91 | 59 | 32 | 35.0 |
| Total | 2539 | 1653 | 881 | 34.7 |
Table 3.20 Estimated local consumption of whale oil.
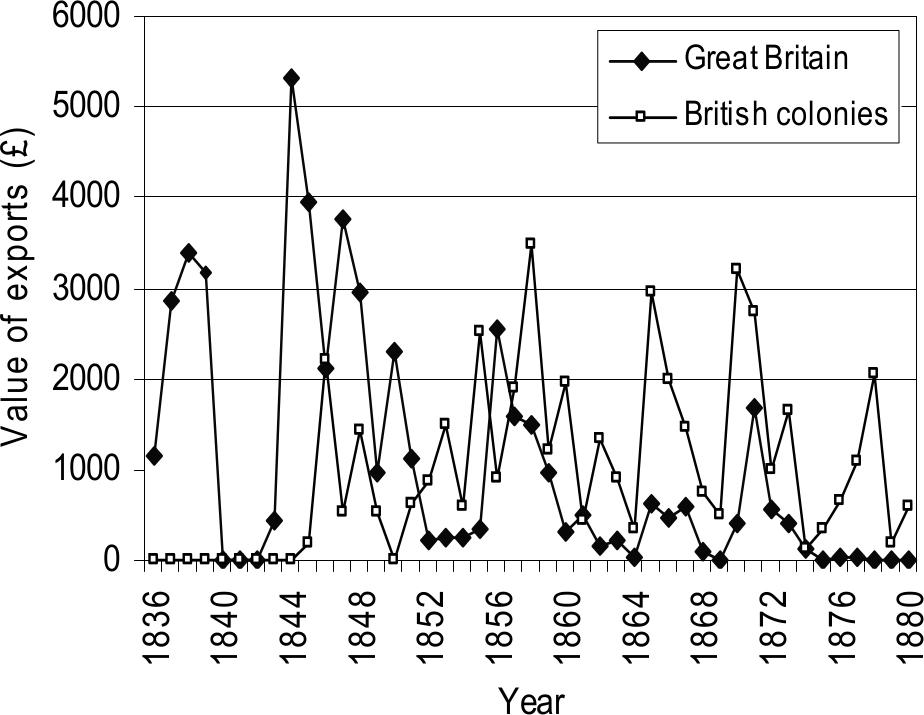
Figure 3.26 Destination of whale products exported from Western Australia 1836–1880 (Blue Books).
The period after 1850 saw the introduction of convicts, the rapid expansion of the civil establishment and a general increase in population, as well as construction of public works such as lighthouses which required oil. By the mid–1870s the local whaling industry was entering into decline while kerosene steadily became cheaper and more accessible for the colonists. In 1870 kerosene was reported at between £50–54 per tun, versus £36–40 per tun of whale oil (Herald 13/8/1870). By 1873 it had dropped to between £36–39 per tun with whale oil at £31–34 per tun (Herald 14/6/1873).
If the difference between production and export presented in Table 3.20 truly does represent the level of local consumption of oil, then there was obviously a wide variation in annual demand. The only indicator of the level of oil use during the early 1850s is a single report 54which states that a recent catch of five to six tuns of oil would be totally inadequate for the needs of Perth and Fremantle (PG 14/10/1853). There are several references to such oil shortages in the colony through the 1850s and 1860s (Inq 23/7/1851; PG 14/10/1853; Inq 24/5/1865), during which prices could be driven from around £30 per tun, up to £70 per tun (Inq 19/10/1853).
The Blue Book records show that prior to 1850, the majority of Western Australian whale products by value were exported directly to England (Figure 3.26). After this date the bulk of production was sent to the eastern Australian colonies of South Australia, Victoria and Tasmania. Whether the oil and bone were then dispatched from these colonies to England or America or kept for local use is unclear.
Before closing this section it is worth reiterating the relatively limited scale of the Western Australian industry compared to other parts of Australasia. For instance, on the southeast coast of Tasmania in 1838 Alexander Imlay’s three shore stations employed 104 men, with another 31 on a whaling barque, taking 539 tuns of oil and 25 tons of whalebone. In 1843 in the Wellington region of New Zealand alone, there were 91 boats and 768 men, taking 1289 tuns of oil and 65 tons of whalebone (Prickett 2002:7). In 1841 it is estimated that New Zealand shore stations produced 1800 tuns of oil and 70 tons of whalebone worth at least £54,800 on the London market (Prickett 2002:2). However, by the late 1840s there were dramatic falls in production throughout Australasia and a rapid decline in the numbers and successes of shore stations. Further comparison is provided Chapter 8.